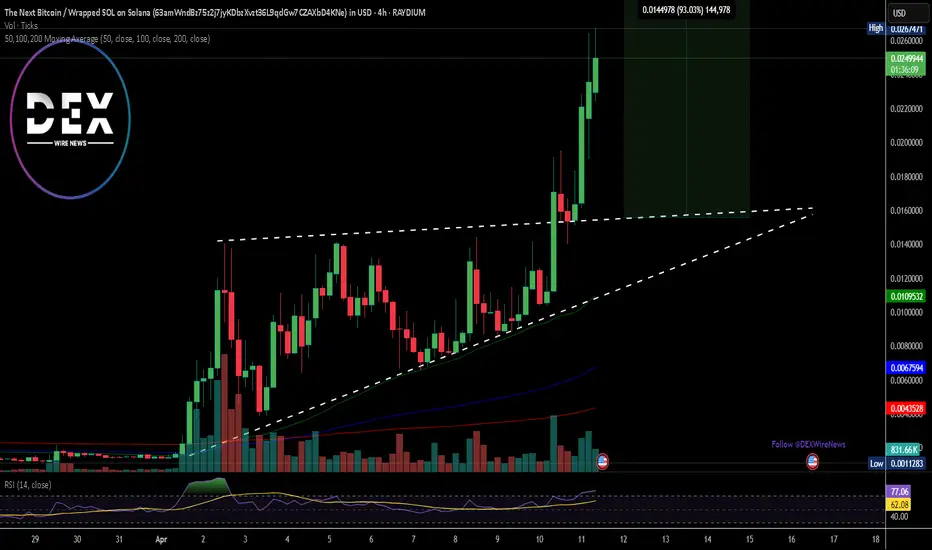
Breaking: $BUTTCOIN Spikes 50% Gearing Up For 100% Surge The price of "The Next Bitcoin" ($Buttcoin) broke out of a bullish symmetrical triangle pattern soaring 50% and setting sail for 100% voyage amidst build-up momentum and increase hype.
Based on the 4-hours time chart, the asset broke out of a presumed symmetrical triangle pattern albeit the crypto market was overall consolidating yesterday.
The 4-hour price chart depicts a typical three white crow pattern, a pattern generally seen as a continuation of a current trend with ($BUTTCON) gearing up for a 100% surge as hinted by the Relative Strength Index (RSI) at 77.
What is The Next Bitcoin?
Buttcoin (BUTTCOIN) is a playful twist on the cryptocurrency landscape, embodying the spirit of a meme while functioning as a real token. Launched on January 30, 2025, on Pump.fun, it’s a community-driven memecoin on the Solana blockchain. The concept was inspired by a humorous 2013 YouTube video by James D. McMurray, which satirized Bitcoin's complexities and introduced Buttcoin as a simpler alternative.
The Next Bitcoin Price Live Data
The live The Next Bitcoin price today is $0.024262 USD with a 24-hour trading volume of $14,482,140 USD. The Next Bitcoin is up 50.31% in the last 24 hours, with a live market cap of $24,241,574 USD. It has a circulating supply of 999,151,679 BUTTCOIN coins and a max. supply of 1,000,000,000 BUTTCOIN coins.
Buttcoin
BITCOIN patterns - parabolic curveDepending on how much stock you place in patterns for trading. Here is a pattern that shows up pretty often during run-ups. This is Bitcoin currently compared to the last parabolic run up pattern I saw on Meta. This pattern can also be found on TSLA, MSFT, BBBY, DOGE, SHIB, and actually quite a few of the alt coins. Again, everyone trades in different ways, so this is not a 100% pattern, but it is something to at least consider while doing your analysis.
IMO, the low looks to be 19.9 and the question point is right around 22.7
ALSO, as far as trends are concerned, you need to view bitcoin on the 4h chart and the 1d chart. The bearish trend (or rejection point) is actually trending towards positive price movement, and we currently have hit the bullish trend support. I have no idea if it holds, but I like the potential especially once these short term time frames start to line up with the longer term frames.

HEX in a Wyckoff type of accumulation (daily), phase AHEX could be in a Wyckoff type of accumulation. If so ,price action is after the selling climax (which was in June) ,and now we are at the end of phase A (we should see a marginally lower low very soon) sub 0.02c!!!
Phase B will be the longest phase (3 months or more) . It will be a more bullish phase ,where price will consolidate near resistance (0.04c-0.07c) giving "investors" hopium that the bottom is in
Phase C will be a short and sharp decline ,the ultimate capitulation . This happens usually at a black swan event or whales simply testing liquidity, dumping price and rebuying NEAR ultimate support. Sometimes price does lower lows or marginally higher lows on the grand scheme. ( +/- 0.02c )
This could play out probably Q1 next year
Phase D will be a sharp BUY . Will play out in Q1 or Q2 next year. At this point nobody will care cuz everybody will be REKT
Price could reach new yearly highs ,first 0.114 then the good ol` 0.168 cent area .
Conclusion :selling now is quite stupid (exept if u are still up 10-100x) hex could be a good buying oportunity UNDER 0.02 ....
I`m buying at 0,019 cents ....from this point a 5x should be easy in this shitcoin .
LONG

Holders & buyers are in for a rough rideThe crypto market has been shaken up by macros like it has been over and over again. BTC has strayed far below its 10 & 20 SMA. Long-term logarithmic support is at $27000, and we are not even in the $20,000s. Volume has dropped off. Will next week's macro news bring new lows? SPX is at major support and a bounce is possible, however DJI has made new lows, and a test for resistance would probably not hold. Based on these technical indicators, I think it's likely we are heading to new lows.

BTT Price Updates and Mainnet LaunchBINANCE:BTTUSDT
Today we will see #BTTC Mainnet Launch
#BTT Redenomination Plan will redenominate old #BTT and swap with the new at 1:1000 ratio.
This is possible move by this news for BTT retest middle line downtrend channel, and going inside upside trend channel to the next target 0.38 on global fib since May.
Hope you enjoyed the content I created, You can support with your likes and comments this idea so more people can watch!
✅Disclaimer: Please be aware of the risks involved in trading. This idea was made for educational purposes only not for financial Investment Purposes.
Don't forget sub and join my channels under this idea!

Believing in Butt BoinSometimes it takes about a trillion dollars to believe in something.
Reversal-sideways or moon booster launch sequence incoming.
I'm bullish on btc esp w how bearish the DXY is looking.

Bitcoins Break Down 2Reasons for a bearish probability:
RSI is bottoming out.
Head and shoulders formation on top of a falling wedge pattern.
Target: 6k bitcoin.

Short BTC - Hard short if it breaks below 7500If it breaks below 7500 then the "Long Term Rise" narrative is broken - it's not a Store of Value

dis what i imagine happening in a bearish situation for bitcoinsthe more I look at it the more I believe it lol

idk what im doing tbhfor me, if it stays above the fat blue line we are peachy keen. dont ask me why, for i know nothing
above the less thick blue line keeps the "new ATH, the summer of 2019: bitcoin broke the internet" hope alive

R.I.P. TAI know I'm not the first person to point out this relationship but I think it warrants another mention following the price action that we've been seeing. Following our breakdown from 8500 USD, we entered a downtrend. 7500 USD acted strong support and we went on to bounce off it ~3 times. Now, I think the fourth bounce would have been fatal for the bulls as it would completed a double top continuation and the big mutant H&S that we've been making for some time now. Further more, we were below both a big Ichi Cloud and the 200MA on the 4H.
This fourth bounce never happened because - at seemingly tactical points - after the third bounce, mysterious pumps would arrive out of nowhere and buoy the price up just as it was eyeing another bearish attack on support. Looking at the upper wicks on the hourly, this resembled a price being dragged higher without regard for consensus. Upon breaking out of the downward channel, there was no volume confirmation and the mysterious pumps continued to procrastinate the bearish downturn into never happening.
Anyway, to my point: I think this rally (like the 20k rally) is a Tether bubble. This chart highlights the correlation and the (roughly) month long delay that changes in Tether's market cap have on BTC's price. Anecdotally, look at the price action that we've been seeing and the charts that people have been posting: I found that both of these pointed to a healthy correction to ~$6.2k being on the cards and my analysis aligned with that too. Instead, what we have is a rally that can't correct. We breezed through the resistance at $6k having spent months leaning on it as support and now we're not even going to correct and retest it. This isn't the irrational exuberance of FOMO - I believe this is inflation by Tether and - if I'm correct - we should see a pretty steep rally to 10k soon; you've got to dance while the music's playing.
Best of luck on this crazy, one-way escalator and don't forget to keep an eye on the news re. Bitfinex, Tether, and the DoJ. If the Tether market cap starts shrinking or it gets canned all together, hold on to your hats.
P.S.: For those that think the correlation between BTC's price and Tether's market cap comes about due to demand for BTC producing demand for Tether, please check out the statistical analysis at Tether Report dotcom that debunks this and points much more strongly to tether being used to inflate BTC's price when it stagnates. For more on the 20k rally, look up Griffin and Shams.

Zooming out from Bitcoin shows there's far more upside to come.Forget about RSI and MACD and Bollinger Bands. What is the product? What does it symbolize?
Bitcoin will continue to grow, look at the steady sustainable growth when delete November 2017 bullrun from the equation.
If you are not buying at these prices I feel there will be a lot of regret in the future. We may go back to 5k-5400 range in the coming weeks but the move is certainly up in my opinon.
Good luck out there, stay informed and stay hydrated.

Short Term Rising Wedge, Long Term OptimismAfter about 6 months in the doldrums, the bulls have recently broken critical long term resistance and can look forward to the greener pastures on the horizon. There's a rising wedge to navigate in the short term and there's a good chance we'll need to test the support at 5,755USD. However, looking beyond that, I think we're going to see some medium to long term bullish action with the past six months acting as a trend reversal and our new bottom.
(For the lunatics out there, overlaying the fractal of the 1,000USD ATH to the 20,000USD ATH (scaling for price whilst holding time fixed) yields a target of 326,847USD for the next ATH - if you don't believe me, just zoom out.)

The bets I'm making on BTCUSDTwo bets in mind right now. I want to do a quick short (long on the inverse chart) from here to at least 5.5k, maybe lower if I'm lucky.
Then I think the real trade is from the upper 6k, lower 7k region to the lower 4k.
Using the inverse chart to help with bias

GBPUSD LONGVoids above market; Daily chart nearing an area of support. Need to see a breakdown in market structure before I enter a trade and expect void to get filled.

USDCAD SHORTVoid below maket. Friday blew out some major highs and filled a void on the daily chart which leaves me thinking this pair is headed straight down. I really like this set up if it were on a Tuesday so have a smaller size on it today

AUDUSD LONGWe've blown out Friday's low and there is a little void to fill below market. Risky trade I'd say so I'm not sure I'm taking this one but just giving an idea of what i look for.

USDCHF SHORTThis pair looks ready to topple on the daily chart to me. Inefficiencies above market on the 15min chart represent a good area to fill in and get a better price with a tighter stop.


Confirmed bullrun - potential 99999+% gains end 2018This is the only chart you guys wanna see and need.
Thank me later and give me those 9999999999999999999999999999999999999999999999999999999 likes.

Scenario 1: slow and painful.Hi biggest FUDDER here.
I feel this is going to take a long time...
People are persuaded they'll become millionaires, so they're just going to never let go till this thing hits the ground.
There's no reason for anyone to buy right now.
Comparing the 2 bear markets they have the same main steps, I'm certaintly not calling to start a trade based on this, just trying to get an idea of how long this could last...
Going to take a while and people won't sell at 3000-4000 because they'll think that's the final bottom.
I'm just wishing the alts lose correlation to BTC but that ain't going to happen let's face it.
I have a second scenario I think the bulls will love it ;)

bitcoin bitcoin bitcoinduck duck duck duck duck duck duck duck duck duck duck duck
duck duck duck duck duck duck duck duck duck duck duck duck
duck duck duck duck duck duck duck duck duck duck duck duck
duck duck duck duck duck duck duck duck duck duck duck duck
duck duck duck duck duck duck duck duck duck duck duck duck
duck duck duck duck duck duck duck duck duck duck duck duck
duck duck duck duck duck duck duck duck duck duck duck duck
duck duck duck duck duck duck duck duck duck duck duck duck
duck duck duck duck duck duck duck duck duck duck duck duck
duck duck duck duck duck duck duck duck duck duck duck duck
goose
