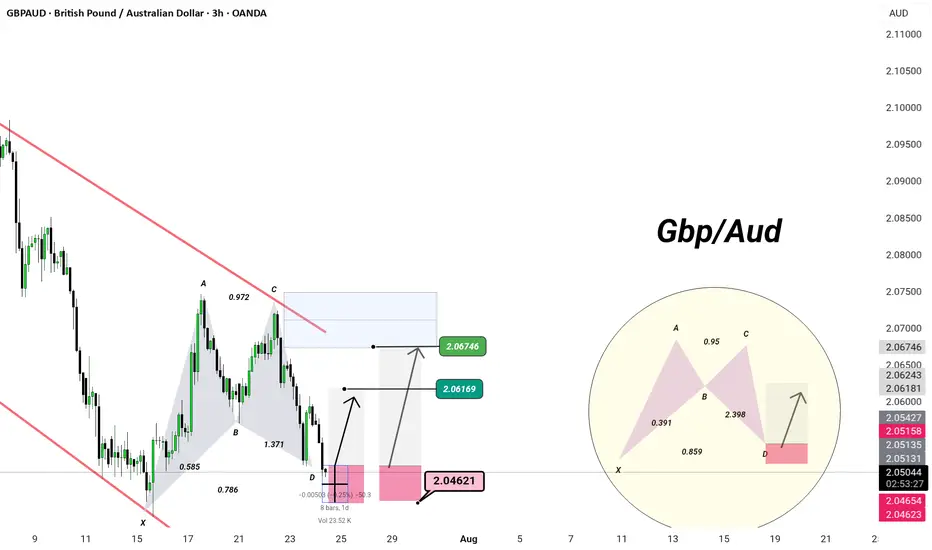
IGBPAUD | 3H Chart | Precision Setup –
🦋 Bullish Harmonic Activation – Deep Zone Precision
When elegance meets geometry — we trade like a Monaco man.
🔺 Pattern: Potential Bullish Bat/Alt Bat
XA → AB → BC → CD
Ideal D-point completion at 2.0462
88.6% XA retracement + 2.0+ BC extension = high-probability reaction zone
🛡️ Demand Zone:
Price is testing the PRZ (Potential Reversal Zone) at 2.0462
Reaction expected → projected targets:
🎯 TP1: 2.0616
🎯 TP2: 2.0674
⚙️ Entry Plan:
Long from 2.0462–2.0465
Invalidation below structure low
Maintain composure. Let the setup mature — precision > prediction
💡 Bias: Tactical long within channel, targeting liquidity above C
🎩
Butterfly
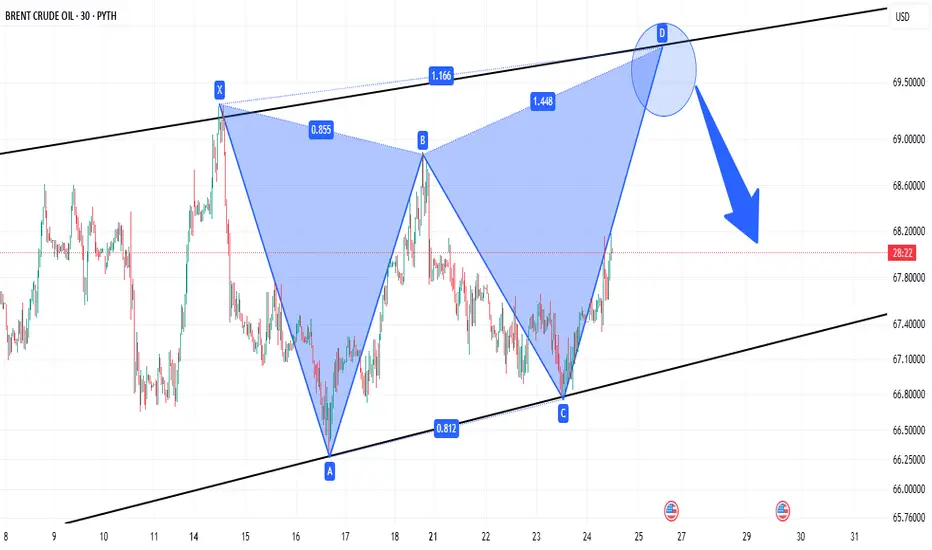
RANGING OIL PRICE HEADING FOR RESISTANCE.Price has been stuck in consolidation mode
Currently heading for resistance levels where we expect a decline
Backed-up by a bearish harmonic pattern
and a bear flag clearly visible on the 4HR time interval
MAJOR MONTHLY SUPPLY ZONE ON GBP/JPY SELLERS INBOUNDRegarding the monthly supply zone, my technical analysis indicates that the price has historically failed to breach this area over several years. I anticipate a potential reversal and recommend waiting for confirmation, such as a double top or harmonic pattern, before initiating a sell position. Furthermore, i will consider selling opportunities upon the .618 Fibonacci level being reached.
Entry: 199.0
Take Profit: 183.3
Overall Price Target: 163.0

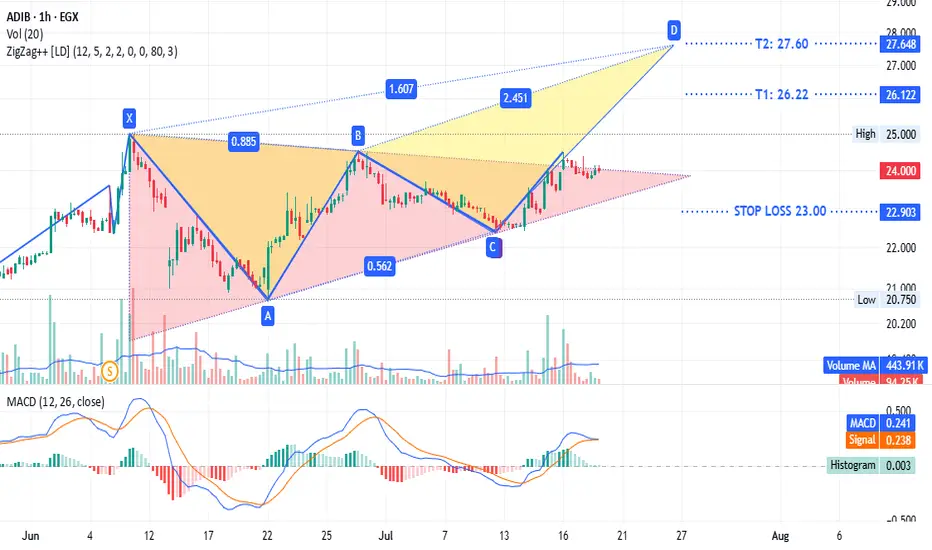
ADIB - same $comi patternADX:ADIB timeframe 1 hour
Is showing a triangle pattern with a potential bearish trend. It is currently testing the upper line of the triangle. The stop loss is at 23.00, and the target sell point ranges from 26.22 to 27.60.
This is not investment advice, only my analysis based on the chart data. Consult your account manager before making any investment decisions. Good luck.
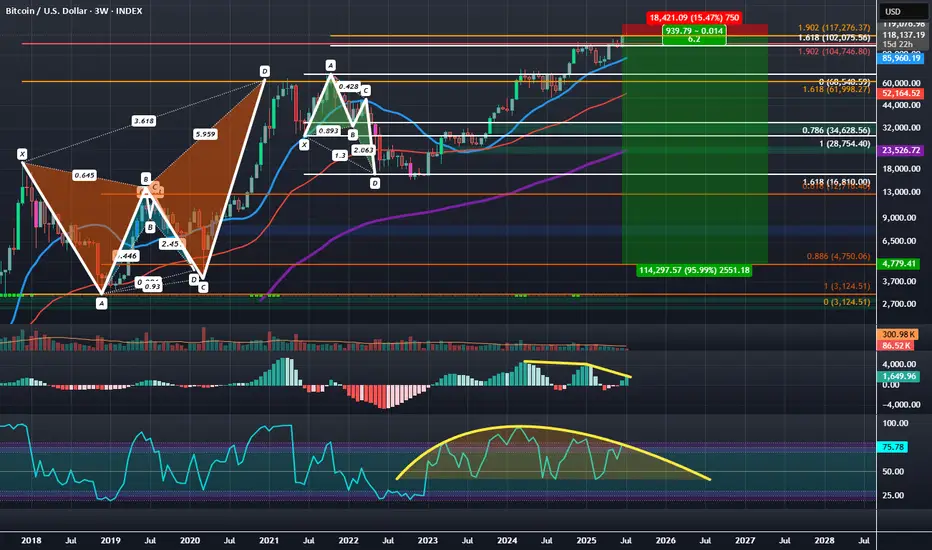
BTCUSD: Bearish Logscale Butterfly with Bearish RSI DivergenceBitcoin has been setting up at the log adjusted 1.902 HOP for a Type 2 retest of the Logscale Bearish Butterfly for the last few months but recently pushed a bit above it and appears to be settling at the linear 1.902 HOP of the local price around the $118,000 area. Between $104,000 and $118,000 is a zone of linear of logscale Fibonacci confluence pointing towards the being the area to look for a more major downside reaction than we got off the initial Type 1 Reaction 1.618 PCZ reversal in 2021.
The most recent push to the linear 1.902 seems to have allowed the structure of the RSI to develop a more Bearishly Distributive and Divergent curve, while the MACD is in the process of developing a 2nd layer of Bearish Divergence. Ultimately at these highs we'd like to see the RSI weaken further as price begins to settle back within the 1.902 bearish zone of confluence before being more sure of downside.
Additionally, during the push higher, longer dated bearish call interest came in around the 123-125k levels which to me signals a newly formed hard resistance that will be hard to gap over and will make failure here more likely. I think if we do see failure we can of course fill the CME gap down at 91.8k, but ultimately the true first target is down at 30k with max targets down near the 0.886 around $4.8k and the 100 percent retrace down at around $3,123.51 over the coming quarters.
Taking into account the wide range in downside exposure I think the best and safest way to speculate on this downside would be through the buying of the March, 27th, 2026 Puts at the $95,000 strike or the closest IBIT equivalent March, 20th, 2026 Puts at the 58 strike this will give plenty of time, as well as plenty of range for the puts to appreciate 10's of thousands of dollars in value as BTC trades down into the targeted zones below it.
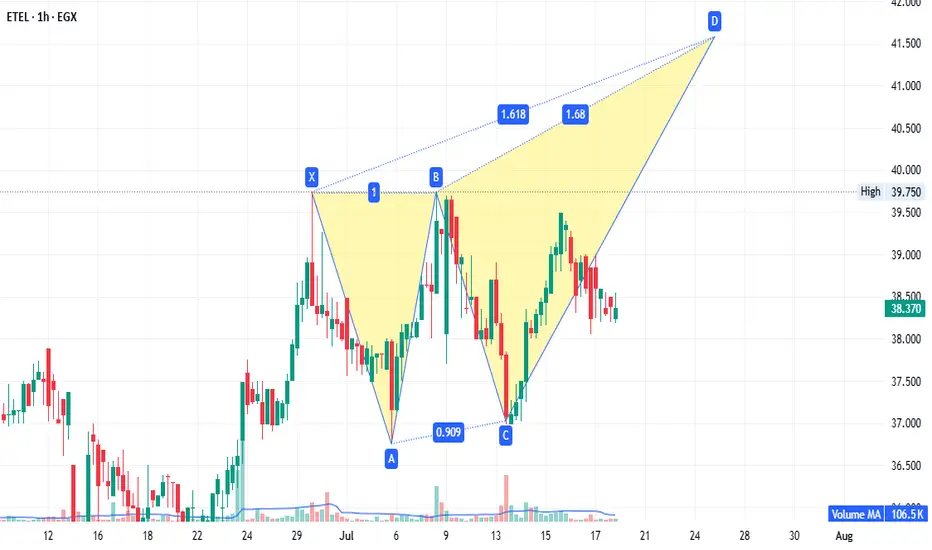
ETEL - strong fundamentals.EGX:ETEL 1-hour timeframe:
A potential bearish Gartley pattern targets 41.50. If prices reach 41.55 (without breaking 37.00), it becomes a sell point with targets at 39.73 and 38.60. Conversely, if prices continue rising and close above 42.70, rebuy what was sold at 41.50, targeting 52.00. This setup is both strategic and supported by strong fundamentals.
Disclaimer: This is not financial advice, only our analysis based on chart data. Consult your account manager before investing.
GOLD SHORT TRADEAronnoFX will not accept any liability for loss or damage as a result of
reliance on the information contained within this channel including
data, quotes, charts and buy/sell signals.
If you like this idea, do not forget to support with a like and follow.
Traders, if you like this idea or have your own opinion, please feel free command me.

TRG LongTRG has made a perfect bullish harmonic pattern where it has retraced to exact 127.2% of its last top and now will move till 161.8% of its all-time high which is nearly 295. This is not a buy/sell call, its just my own analysis and you may disagree. However, I'd urge you to study bullish and bearish harmonic patterns which are not so common in Pakistani market but some international players often run a stock through this pattern. Similar patterns can be noticed in GHNI and GAL as well.

EURUSD ||| '' W '' PATTERN IDENTIFIED . ✅ Harmonic Formation (Bearish Potential)
⚠️ Selling Bias forming soon
---
🧩 Pattern Breakdown:
A Bearish Harmonic Pattern (likely Butterfly or Deep Crab) has been identified and is now nearing completion at the D point.
Current price is approaching key resistance / reversal zone, precisely around the 0.786 - 0.886 fib area (highlighted red).
The Risk-to-Reward is clearly mapped:
🔺 Stop Loss: 1.19405
✅ Entry Zone: Around 1.17106
🎯 Target: 1.09588
Potential short setup if price respects the harmonic symmetry and fails to break above resistance.

GBPAUD BearishUpon examining the daily chart for GBPAUD, the outlook appears to be bearish, bolstered by the presence of bearish butterfly harmonics that affirm this trend. As I assess the market conditions for the coming week, I am contemplating entering a short position.
For this trade, I am setting my take-profit levels as follows:
- TP1 at 2.06
- TP2 at 2.05
- TP3 at 2.03
To manage risk, I will place my stop-loss at 2.11. This strategy aims to capitalize on the anticipated downward movement while safeguarding against potential reversals.

EUR/USD Weekly Outlook | Harmonic Butterfly PatternHere is a professional TradingView publish description for your EUR/USD Weekly Butterfly Pattern Analysis:
---
🦋 EUR/USD Weekly Outlook | Harmonic Butterfly Pattern
Pair: EUR/USD
Timeframe: 1W (Weekly)
Strategy: Harmonic Pattern Recognition – Butterfly Pattern
Bias: Bearish Reversal Setup
---
🔍 Pattern Analysis:
Butterfly Harmonic Pattern completed with precision at the 1.272–1.414 extension zone, forming the critical D-point near 1.14700.
Price has reacted sharply from the PRZ (Potential Reversal Zone), aligning with a historical supply zone.
Confluence from Fibonacci extensions:
AB = 0.786 retracement
BC = 0.382 to 0.886 retracement
CD = 1.618 to 2.618 extension
📉 Bearish rejection expected from this high-probability reversal zone.
---
📌 Key Levels:
PRZ (Potential Reversal Zone): 1.14500 – 1.15000
First Target Zone (Support Block): 1.11500 – 1.10500
Invalidation (Pattern Failure): Close above 1.15500
---
📅 Projection: This weekly harmonic butterfly suggests a potential trend reversal or deep pullback. We may see EUR/USD targeting lower support as D-point gets respected. Watch for signs of weakness such as long-wick rejections, bearish engulfing patterns, or RSI divergence confirmation.
---
💡 Conclusion: EUR/USD is at a critical juncture. If the butterfly holds, this could be a high RR short opportunity for swing traders. Patience is key—confirmation on lower timeframes will validate entry.
---
📊 #EURUSD #ButterflyPattern #HarmonicTrading #ForexAnalysis #TechnicalAnalysis #SwingTradeSetup

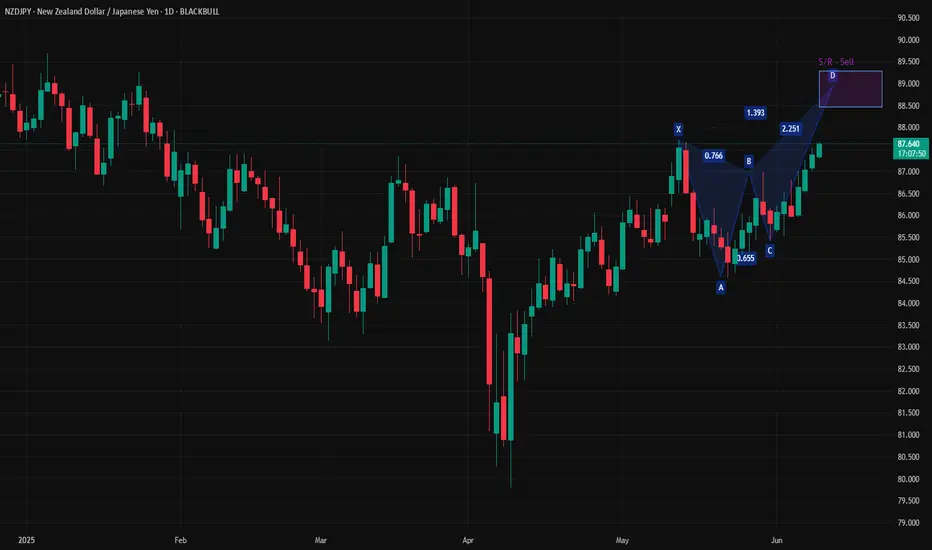
Butterfly pattern setting up on NZDJPYIs NZDJPY heading for 89.00? Or maybe push onto 90?
A bearish butterfly pattern is shaping up at the moment. Price action still has a lot to do before getting there but if does. Look to sell in the S/R area.
SBI towards 650? Butterfly pattern to complete "W"SBI is on the verge to form Butterfly pattern it has potential to reach 650 target with following support.
720 / 700 / 680 / 650

Tesla Bearish Daily Reversal Harmonic Butterfly patternWaiting for the Formation of LHs and LLs
Divergence before the D point confirms Potential Reversal Zone
Hypothetical Calculation of Potential Target Points
A bit of Rare Pattern Bearish Butterfly

Analysis of GBP/USD PriceThe possibility of the GBP/USD exchange rate dropping from the 1.36 USD level has been highlighted, based on the harmonic Butterfly pattern.
This analysis points towards potential movement towards predetermined target levels.
Keep an eye on these developments if you're following the currency market closely, as patterns like this can provide valuable insights for decision-making.

Technical Analysis for NIL/USDT (1H Chart)The NIL/USDT pair is currently trading at $0.4662, showing signs of bullish momentum with a +4.06% gain in the latest hourly session.
A confirmed breakout above this previous high (HH) would signal a potential bullish continuation, targeting the next resistance around $0.5602. RSI is trending upwards, currently at 45.89, suggesting building momentum.
If the price fails to break the HH level, it may continue to range within the current structure

Platinum Butterfly Harmonic patternPotential deep drop in platinum prices spotted
based on the Butterfly Harmonic pattern.
📉 Stay cautious, traders! 🦋

A Look at Nasdaq Buyers around the $21.5k .Looks like Nasdaq buyers took a breather at the $21.5k level. Time to watch if the market flutters back up like a butterfly or dives deeper. 🦋📉

QQQ Bearish Ideal Butterfly Pattern.Okay, so the idea is, what are the odds of butterfly QQQ taking a nosedive from 500 ?
My guess? Pretty high.

Understanding the Recent Rise and Preparing for a Potential Dip.In our previous analysis, we highlighted the initial stock decline of Netflix driven by concerns surrounding potential tariffs and anticipated a deeper correction.
However, investor greed ("The Greed Butterfly") took flight, pushing the stock upwards.
While this surge might seem positive, it's important to understand the market dynamics at play. This rapid ascent, fueled by speculative buying and the fear of missing out (FOMO), is likely unsustainable. Like a butterfly that has exhausted its energy, the stock needs a significant period of consolidation and rest.
This suggests that a deeper correction than initially anticipated is still possible. The "Greed Butterfly" needs to land and allow fundamentals to catch up.
SEYED.

Canadian Dollar Butterfly needs a Deep Rest.Get ready for a potential dip in the Canadian dollar!
Forecasts suggest we might see it weaken from the $72.85 mark.
Keep an eye on the market, folks, because this could mean some exciting changes for trade and investment!

LONG XAUUSDGold (XAU/USD) – Bullish Outlook Backed by Harmonic Structure and Market Fundamentals
We are currently anticipating a bullish continuation in XAU/USD, supported by a combination of technical signals and macroeconomic drivers.
On the technical side, the recent completion of a Bullish Butterfly Harmonic pattern suggests a potential reversal zone (PRZ) has been confirmed, indicating strong buying interest at the 3195 level. The symmetry within the XA, AB, BC, and CD legs of the harmonic structure aligns well with Fibonacci ratios, reinforcing the credibility of this bullish signal.
Additional confluence is found with:
Strong horizontal support near 3195
Positive divergence on momentum indicators (e.g., RSI )
Price action respecting the 50 EMA as dynamic support
On the fundamental front, growing market uncertainty, dovish expectations around global central bank policy, and sustained geopolitical tensions are likely to keep gold attractive as a safe-haven asset. Moreover, persistent inflation concerns and weaker global growth forecasts continue to support the upside potential for precious metals.
Trade Setup:
Entry: 3195
Take Profit 1: 3225
Take Profit 2: 3245
Stop Loss (Recommended): 3180
Risk Management Note: Proper risk-reward ratio and position sizing are advised, considering increased volatility due to upcoming economic releases and geopolitical developments.

Short on BTCUSDBitcoin (BTC/USD) – Bearish Outlook Amid Economic Uncertainty
We anticipate a short-term bearish trend for BTC/USD, driven by escalating economic concerns and the recent resurgence of trade tensions. The imposition of new tariffs has negatively impacted market sentiment, contributing to downward pressure on Bitcoin. The current price structure also suggests limited bullish momentum, favoring another potential sell-off.
From a technical perspective, forming a Bearish Butterfly Harmonic pattern further supports the expectation of a downward move.
Trade Setup:
Entry Level: 84,500
Take Profit 1: 78,500
Take Profit 2: 74,500
We recommend monitoring macroeconomic developments closely, as further deterioration could accelerate the bearish trend.
