The goal of reducing 3.5-4$According to the Butterfly pattern, the Fibo perfectly converges the decline on the target of 3.5-4 $. The timing is not clear when we will get there, but according to the schedule of the decline of #HSI1, we should reach it by October 2023, there will be an excellent point for going to long to new heights.
Butterfly

The goal of reducing 180$According to the Butterfly pattern, the Fibo perfectly converges the decline to the target of $ 180. We also go down the channel where the lower border of the channel will be. All 3 parameters should be added together. We should reach it by June 2024, there will be a great point for going to long.

The goal of reducing 160$According to the Butterfly pattern and the Fibo, the decline to the target of $ 160 ideally converges. We should reach it by spring, there will be a great point for going to long.

The perfect butterfly on the declineIdeal default values. The reduction target is $220-240. As we decline further, it will be a good time to buy a company for a long time

Sideway Consolidation, Perfect for Counter-Trend Traders!📊 If you're a trader seeking both buying and selling opportunities without worrying about trends, this one's for you! Australia-Canada is in a sideway consolidation, ideal for counter-trend traders who love buying low and selling high. 📉📈
👀 On the daily chart, observe the group of highs and lows. The four-hour chart heads towards previous supports, while the one-hour chart shows a new low, great for shorting.
📈 Weekly potential shark pattern at 0.8704, and daily shark pattern at 0.8728, hint at a close-range longer-term buying opportunity. Don't miss the ABCD pattern on the left—amazing trading opportunities await!
🦋 Butterfly traders watch for completion at 0.8730 on the four-hour chart. Focus on repeated levels for the best returns.
💡Want to spot opportunities like a pro in just 15 mins a day? Scan the QR code and join our community of like-minded traders!
🔍 Different trading strategies point to the same level, making it a key focus for buying opportunities. But don't disregard shorting opportunities—be cautious around 0.8730.
📈 Follow me on my only account @raynlim for insightful analysis and updates. Let's trade smarter together! 💹📈

USDNOK: Confirmed Bullish Butterfly at Structural Demand LineUSDNOK is sitting at the Demand Line of an Overall Bearish Ascending Broadening Wedge Pattern that happens to align with the 1.272-1.618 PCZ of a Bullish Butterfly; along with that, we have PPO Confirmation, RSI BAMM, and a MACD Bullish Crossing. Given the scenario, I can see this trying to retrace up 50-88.6% of the Harmonic Range before coming back down and confirming a partial rise, after which we will then possibly have to look for opposing Bearish signals.

GOLD sort BUY
Hello Traders, here is the full analysis for this pair,
let me know in the comment section below if you have any questions,
the entry will be taken only if all rules of the strategies will be
satisfied. I suggest you keep this pair on your watch list and see if
the rules of your strategy are satisfied.
Dear Traders,
If you like this idea, do not forget to support with a like and follow.
PLZ! LIKE COMMAND AND SUBSCRIBE

📉FETCH.AI --> 0.21$ then 0.18$ 📈BINANCE:FETUSDT
COINBASE:FETUSD
Hello Traders, please check out my previous ideas.
If the price stabilizes above the red area, the short scenario won't be fulfilled.
targets are on the chart.
optimum stop-loss is above the 0.2561 level.
✌💥If you are satisfied with my analytical content, please share my ideas💥✌
✍🐱👤Otherwise, make sure you leave comments and let me know what you think.🐱👤✍
🤑🍾Thank you for your support. I hope you will gain profit by following my analyses.🍾🤑
CrazyS✌

Shorting Opportunity Alert on EUR/USD!🐻 Weekly Chart: The overall setup on EUR/USD points to a Weaker Bear trend. 📉 This means there's potential for downward movement in the coming weeks.
⏳ Patience is Key: While we wait for the perfect entry point, keep a close eye on the lower timeframes for a shorting opportunity. 🧐
📈 Lower Timeframes: Look for price action signals and confirmation on the lower timeframes to pinpoint the ideal entry point for your short trade. 🎯
📉 Set Your Stop-Loss: Always remember to set a proper stop-loss to manage risk effectively. 🛡️
🚨 Stay Alert: Monitor the market closely and be ready to act when the right setup presents itself. 📊
Remember, trading requires discipline and patience. Wait for the right opportunity, and when it arises, execute your trade with confidence. 💪
Happy trading and best of luck! 🍀 Follow me @raynlim for more trading insights and updates. Let's capitalize on the market together! 🚀

Gold Short Entry
Hello Traders, here is the full analysis for this pair,
let me know in the comment section below if you have any questions,
the entry will be taken only if all rules of the strategies will be
satisfied. I suggest you keep this pair on your watch list and see if
the rules of your strategy are satisfied.
Dear Traders,
If you like this idea, do not forget to support with a like and follow

EURUSD - Bullish Pullback Trade - Why Is This DB Invalid?Last week we took a look at the EURUSD & had shorts on the radar. Now that those shorts have played out, we're once again looking for the next opportunity to get long. In this video we'll look at a potential pullback trade with a large continuation potential as well as a lesson on what validates or invalidates certain double tops & bottoms for me.
Please leave any questions or comments that you may have below & make sure you hit that LIKE BUTTON before heading out.
Akil

📈Bitcoin prediction, 26K or 31K? 📉BINANCE:BTCUSDT
COINBASE:BTCUSD
Hello dear traders
Due to the decrease in trading volume in the last few weeks, I'm going to do some weekly Bitcoin analysis.
In the next few days, Bitcoin is expected to return to the $31,000 range if it holds above the indicated areas.
If the price breaks below the mentioned areas, the price will drop to the level of 28,150 and then 26,500.
✌💥If you are satisfied with my analytical content, please share my ideas💥✌
✍🐱👤Otherwise, make sure you leave comments and let me know what you think.🐱👤✍
🤑🍾Thank you for your support. I hope you will gain profit by following my analyses.🍾🤑

QQQ: Looking Out for a 20-40% Pull BackThe NASDAQ100 is currently sitting at the 0.886 and 1.618 PCZs of big Bearish Shark and Bearish Butterfly patterns as the indicators hover around the overbought zones; we don't exactly have much confirmation yet that these PCZs will hold, but it seems like it wouldn't be a bad idea to position against the QQQ early on via some SQQQ monthly calls and perhaps getting Bearish on some of the top stocks within the index such as NVDA, TSLA, and MSFT.
Being conservative, I will only be looking for it to come back to the common Fibonacci Retracement zones below, but it's also possible that this ends up being a macro top; for the time being, that doesn't really matter because as of right now, it looks quite Bearish.
On a side note, the VIX also looks like it's been preparing to spike up for a few months now and the targets for such a spike are pretty massive, as seen here:

DXY RSI Bullish Divergence at Bullish Butterfly PCZFrom the looks of it, DXY will try to hold the 1.414 Butterfly PCZ and make its way up towards previous Resistance. I don't think DXY will Break the Resistance, but it does look like there is a good case to be made for DXY coming back up to challenge those levels.

Still Looking to Short!⏳ This week marks my last opportunity to go short on EURUSD. The Weekly Chart shows a violation of structure, forming higher highs and higher lows.
🦋 A Bearish Butterfly setup is visible on the Daily Chart, pending confirmation with a candle close at 1.1195 or below.
💪 Aggressive traders, like me, may choose to wait for a market retest to the previous resistance at 1.2420 on the 1-hourly chart.
📊 Stay tuned for further updates and trading insights!
#EURUSD #ShortOpportunity #BearishButterfly #TradingInsights #StayInformed #TradeSmart

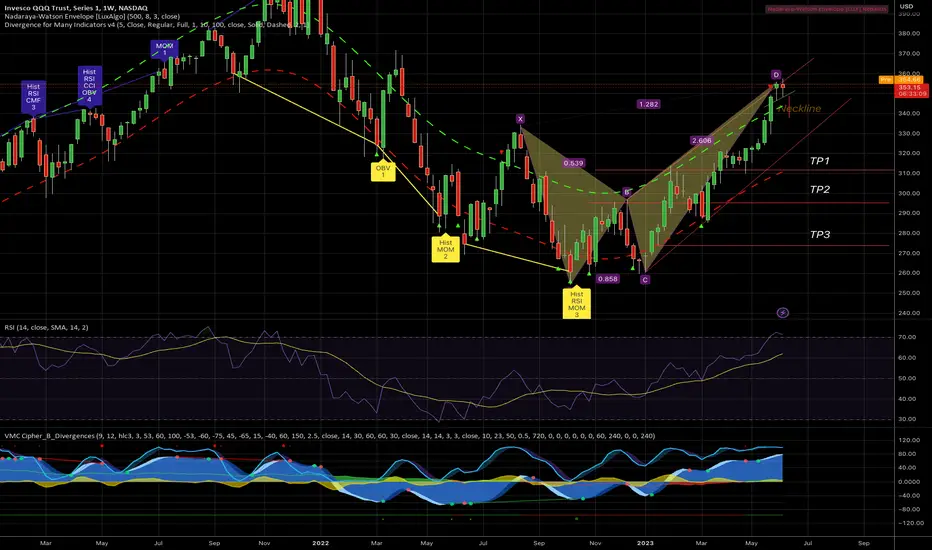
QQQ Bearish butterfly patternThe QQQs have created a head & shoulders pattern now and In the chart, you can see that we have a butterfly-bearish pattern.
For short-term target head and shoulder measurement move the target to 340$
We have a rising wedge pattern when the price breaks the support line of the rising wedge:
1st Target around 310$
2nd Target around 300$
3rd Target around 275$
I guess the price gonna drop to 330 before the FED meeting on the 13th of June.
I'm not a financial advisor.
EUR/USD IDEA...
AronnoFX will not accept any liability for loss or damage as a result of
reliance on the information contained within this channel including
data, quotes, charts and buy/sell signals.
If you like this idea, do not forget to support with a like and follow.
Traders, if you like this idea or have your own opinion about it,
write in the comments. I will be glad.

Gold Short SELL Now......AronnoFX will not accept any liability for loss or damage as a result of
reliance on the information contained within this channel including
data, quotes, charts and buy/sell signals.
If you like this idea, do not forget to support with a like and follow.
Traders, if you like this idea or have your own opinion about it,
write in the comments. I will be glad.

DOLLAR INDEX NEED SEEMS TO BUY CORRECTIONHello Traders, here is the full analysis for this pair,
let me know in the comment section below if you have any questions,
the entry will be taken only if all rules of the strategies will be
satisfied. I suggest you keep this pair on your watch list and see if
the rules of your strategy are satisfied.
Dear Traders,
If you like this idea, do not forget to support with a like and follow.
PLZ! LIKE COMMAND AND SUBSCRIBE.

EURUSD: Bearish Reentry with a Potential Bearish ButterflyThe previous .786 entry got stopped out at much lower prices with a tight stop and now we are showing potential for reversal again at the 1.272 Fibonacci Extension and PCZ of Potential Bearish Butterfly as the RSI goes well above the last overbought reading. Given the scenario, I'd say it's worth trying again with a stop above the next Fibonacci extension.

EURUSD completing the Butterfly pattern- price at D point of the Butterfly pattern
- potential contraction to the 1.19
- then returning to the main trend

Shorting Opportunity🔍 Take Note! This week's market may experience a retracement, and my focus is on a potential shorting opportunity at the resistance level of 1.0987.
Stay tuned as we analyze the charts and identify the optimal entry points for profitable trades.
Let's navigate the retracement together and seize the right opportunities! 💪📉

GBPNZD | Bullish | Potential IdeaPotential Idea
GBPNZD
Zone : 2.06543
TP : 2.09044
SL : 2.05436
BE : 2.06769
