EURGBP - Bearish - Potential IdeaEURGBP
Bearish
Zone : 0.86246
SL : 0.86491
TP : 0.85192
BE : 0.86137
Butterfly

USDCAD | Bearish | Potential IdeaPotential Idea
USDCAD
Bearish
Zone : 1.32424
SL : 1.32762
TP : 1.31181
BE : 1.32264

GBPNZD | Bullish | Potential IdeaPotential Idea
GBPNZD
Bullish
Zone : 2.07154
TP : 2.09124
SL : 2.06349
BE : 2.07415

NZD/CAD | Bearish | Potential IdeaPotential Idea
NZD/CAD
Bearish
Zone : 0.81308
TP : 0.80232
SL : 0.81565
1st BE : 0.81202

Shorting Opportunity🔍📊 Current Market Overview:
I'm closely monitoring the EURUSD pair for a potential shorting opportunity on the higher timeframe. However, at the moment, two buying opportunities have emerged, which deserve our attention. Let's dive into the details:
🦋 Bullish Butterfly Pattern:
On the daily chart, we have identified a Bullish Butterfly Pattern with completion anticipated at 1.0355. This pattern suggests a potential buying opportunity, indicating a reversal in the price action. It's crucial to keep a close eye on the price as it approaches this level.
🦈 Bullish Shark Pattern:
Another interesting development is the Bullish Shark Pattern observed on the 4-hourly chart. This pattern is expected to complete around 1.0764, signalling a potential buying opportunity. However, it's important to remember that these patterns occur in the context of a counter-trend trading strategy.
💼 Trading Strategy:
Given the absence of a clear shorting opportunity, I will adopt a conservative approach and focus on the identified buying opportunities. I will set conservative targets for these trades while remaining vigilant for a suitable shorting opportunity to align with my overall strategy.

AUDUSD - BULLISH - Potential OpportunityAUDUSD
Bullish
Zone : 0.66854
TP : 0.69066
SL : 0.66380
BE : 0.66961

AUDCAD - Bearish - OpportunityPotential Idea
AUDCAD
Bearish
Zone : 0.88048
SL : 0.88237
TP : 0.87409
1st BE : 0.87939

FTM ShortI saw Harmonic butterfly on FTM lets watch and c.
We have 3 main targets as shown in the graph , you can take 75% from your profet and leave 25% to the order block.

Will GBPUSD React or Reverse?GBPUSD has done a Wyckoff Distribution with a 4th hit to the upside to clear out stops and a potential Bearish Butterfly pattern on the H1 timeframe. This pattern could send the price down towards the next LQP 1.25000. I'll wait for confirmation to see how price reacts to this pattern. Will it yield a reversal or a reaction?

HUT 8 Mining: Bearish Pull Back Before Bullish ContinuationThere is a Bearish Butterfly on HUT 8 Mining with Bearish Divergence on the CAD pairing and it suggests that we may pull back to try to test old resistance as support before continuing higher later.

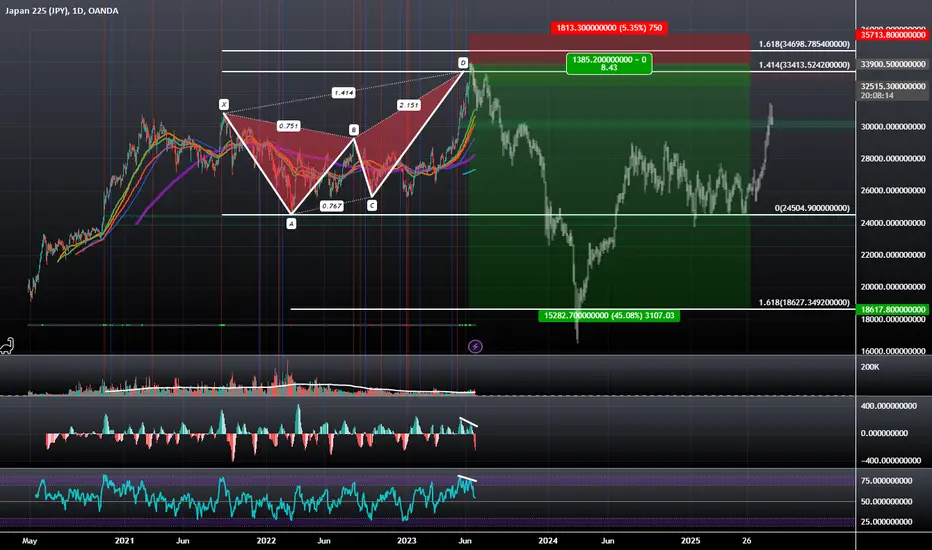
Nikkei 225: Bearish Divergence at Bearish Butterfly PCZThere is Bearish Divergence on both the RSI and MACD at the PCZ of a Bearish Butterfly, and there will hardly be any support until we reach the 1.618 Fibonacci Extension down at 18627JPY, but from the looks of it, it will likely be a very fast drop followed by an even faster recovery, but in the meantime the JPY could gain some strength.
Goldman Sachs: Head and Shoulders at a Bearish Butterfly PCZThere is a Head and Shoulders pattern that has formed at the PCZ of a Bearish butterfly; it is also breaking down the trend line of a Bearish Dragon and the likely target seems to be $129.

Sharda Corp ViewSharda Corp best for short term swing trade gave BO with high volume and retest also done. Entry 520-530 SL 472 target 596 and 670 with in next 2-6 months.

Potential Idea : EURGBP - BearishPotential Idea :
EURGBP
Bearish
Potential Zone : 0.85950
Potential INV (SL) : 0.86193
Potential Exit (TP) : 0.85178
-Tend break
-Fibo Break (0.886)
-Market Structure Break
-McGinley Break

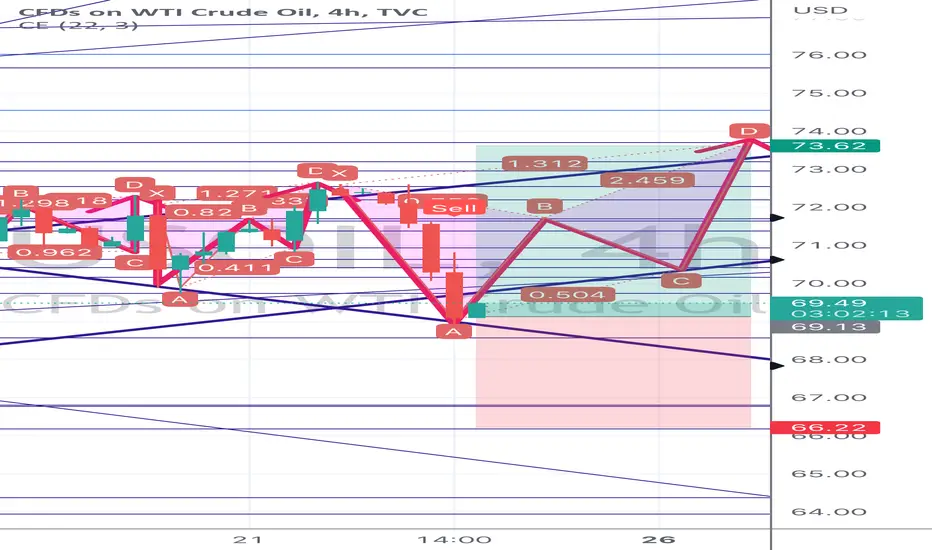
UsoilUsoil now buy trend starting on my analysis, hope it will work correctly like last one .
If u like my this idea the. Hit like button thanks
XAUUSD: Bullish Butterfly with Upside up $2,022Gold has Double Bottomed at the PCZ of a Bullish Butterfly that is visible on the 1 Hour time frame; if it plays out it could go up to at least $1,958 and at most $2,022

GBPAUD →Technical pullback, after which the growth will continueFX:GBPAUD forms a reversal pattern at the base and support of the lateral range of 1.86094. The implementation phase of the set-up leads to the strengthening of the currency pair to 1.88950. The technical pullback begins, which may reach the retest of SMA-200.
The price is inside the range. From the support we see active price strengthening towards resistance. The strategy of trading inside the range is simple - it is worth to focus on the resistance and support of the flat.
At the moment correction is forming, which may be directed towards 0.382 Fibo or to SMA-200, as we have an uptrend, these levels are the key for possible entry point.
Support levels: 1.87738, SMA-200, 0.382 fibo
Resistance levels: 1.88200, 1.89214
I expect the end of the technical pullback in the area of 1.87738-1.87450 with further strengthening of the currency pair to 1.89214 or to 1.90350.
Sincerely R. Linda!

$Btc Butterfly, with combo Cypher Risky set here in CRYPTOCAP:BTC , stop just below 414 extension, targets are shown, Tp1 move stop to break even, aim 2/3. Can consider a smaller position and use 1.618 as stop. Always keep a runner for higher targets especially with he butterfly pattern. GL and let's see

Butterfly possible? Any help is appreciated Ive never used butterfly patterns but thought this looked close to one....Perhaps it's possible 🤔
If you could offer any insight I'd appreciate it, thanks

Dollar Bias!My Bias for Dollar Appreciation started on 14 Oct 2021; it has been right after all. The leading trade I'm looking at is a buying opportunity on the 1-hourly chart, left and might keep my final target open and observe the candlestick pattern movement when it approaches its new resistance level.
If you are looking for a counter-trend move, I've something for you. A Bearish Butterfly Pattern that seems to complete at 141.65; in order for this trading setup to complete, the candlesticks pattern must touch 141.51 within the next 2 candles, which means within 8 hours after the market opens.
If you love what you are seeing, remember to follow my only account, raynlim

Perfect automated detection of Butterfly & DeepCrab PRZ - ShortA bearish-type Butterfly pattern occurred near the resistance zone of 95.60-96.60.
If the price rises to 96.78, a bearish-type DeepCrab pattern could occur.
Short after seeing the rebound.
*Harmonic patterns and support/resistance zones are automatically detected using the indicators below.
- Harmonic auto-detect PRO
- Support/Resistance Zone Auto PRO

CHFJPY ADVANCE HARMONICS PATTERN CHFJPY has formed an advance harmonics butterly bearish pattern on its hourly chart.
The price is trading the short entry level EL: 154.458.
Targets:
62% AD: 153.775
79% AD: 153.550
127% AD: 152.899
162% AD: 152.431

GOLD ADVANCE HARMONICS PATTERN BUTTERLYGOLD has formed an advance harmonics pattern butterfly on its hourly chart the price is trading above the long entry level EL: 1943.96,.
ST: 1931.35
TARGETS:
38% AD: 1988.59
62% AD: 2023.61
79% AD: 2048.44
