EURJPY - Bearish ButterflyI've been nothing but patience for this setup. A Bearish Butterfly setup with RSI Divergence, probably the first trade I'm looking to get involved first thing in the morning tomorrow.
Let's see how this goes.
Butterfly


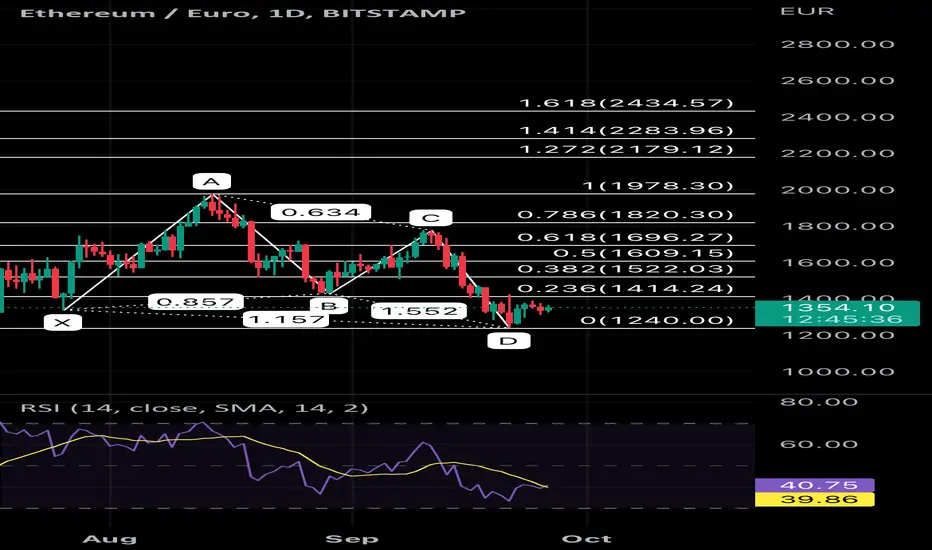
Daily ETHEUR analysisButterfly pattern is available on daily chart, Check the fibo levels for clear vision.
Bearish Butterfly Harmonic Pattern DXY / Trend ReversalTrading the bearish Harmonic pattern;
Place the sell order at point D (a 127 percent extension of the XA leg). Position the stop-loss right above an extension of 161.8 percent of the XA leg(personal preference). And place the profit target at A or lower for a more aggresive take-profit since it might indicate a trend reversal.
This depends on the condition of the market.

$TSLA Butterfly idea I am overnight 233/232$ limit on $TSLA, stop below 231$. I am not bullish on $TSLA but this could offer a nice bounce play if it has a gap down or sharp drop at the open. You can watch 234-235$
for bullish price action @786 fib extension, i have 0 interest with that level, but it can work.
Look for a pin bar, engulfing bar on gap down at the 1.272 extension. Aim for TP 1 and move stop to entry and then maybe we can get 618 at tp 2.
Low conviction play, Smaller size. Overall lower on $TSLA in my opinion. It should be volatile tomorrow, Non-farm payroll tomorrow use caution, I am expecting lower on the indices personally.

BUY USOILWe see a potential bearish Harmonic butterfly formation and a couple of FIBS confluencing forming a FIBS cluster at the potential reverse zone. Trade with proper risk management,.. Good Day Traders

Spiked Neckline from this bearish pennantLINKUSDT spiked closely @ TP1 which is a harmonic AB=CD pattern target from a breakdown of the prior low 1M candlestick inside bar. Reacting now from the volume POC. A complex Head and Shoulders can be validated after a pullback to neckline. Plus potential bullish Butterfly target.

IRCTCIRCTC is enroute to confirm butterfly pattern, technically its a buy only above 726 where it confirms its pattern. One can also buy here @ 718-719 assuming it ll break above 726.
In that case should be bought with mentioned stoploss & target

EUR/USD Need To Buy Contamination .....
Hello Traders, here is the full analysis for this pair,
let me know in the comment section below if you have any questions,
the entry will be taken only if all rules of the strategies will be
satisfied. I suggest you keep this pair on your watch list and see if
the rules of your strategy are satisfied.
Dear Traders,
If you like this idea, do not forget to support with a like and follow.
PLZ! LIKE COMMAND AND SUBSCRIBE.

Perfect automated detection of WhiteSwan & Butterfly PRZ - LongA Bullish-type WhiteSwan pattern occurred within the support zone of 1.1140-1.1180.
If the price drops to 1.1036, a Bullish-type Butterfly pattern could occur.
Long after seeing the rebound.
*Harmonic patterns and support/resistance zones are automatically detected using the indicators below.
- Harmonic auto-detect PRO
- Support/Resistance Zone Auto PRO

WTI CRUDE OIL WAITE FOR BREAKOUT THEN BUY....
AronnoFX will not accept any liability for loss or damage as a result of
reliance on the information contained within this channel including
data, quotes, charts and buy/sell signals.
If you like this idea, do not forget to support with a like and follow.
Traders, if you like this idea or have your own opinion about it,
write in the comments. I will be glad.

Perfect automated detection of Butterfly & DeepCrab PRZ- LongA Bullish-type Butterfly pattern occurred.
If the price drops to 0.8529, a Bullish-type DeepCrab pattern could occur.
Long after seeing the rebound.
*Harmonic patterns are automatically detected using the indicators below.
- Harmonic auto-detect PRO


AUDCAD - Bullish ButterflyAUDCAD also has a Bullish Butterfly. Some traders may choose 1 trading setup over the other, especially they they see some similarity among their portfolio.
Trading for 17years, I do not do that. I've witness that 1 trading setup might profit while the other might fail; or 1 ran into profit so much in advance of another.
You can check out AUDUSD under the related ideas within the link.

AUDUSD - Bullish ButterflyA potential Bullish Butterfly may form up at 0.6340, NO. By looking at the current candlestick pattern formation, it is more likely for the market to react from the current price of 0.6368.
To most Harmonic Patterns traders is a big No-No for them, but sometimes we have to execute flexibility. With that said, I will look closely at the market movement from 8-10am( GMT +8).

WTI CRUDE OIL SEEM SELL CORRECTION THEN BUY....
AronnoFX will not accept any liability for loss or damage as a result of
reliance on the information contained within this channel including
data, quotes, charts and buy/sell signals.
If you like this idea, do not forget to support with a like and follow.
Traders, if you like this idea or have your own opinion about it,
write in the comments. I will be glad.

SOLANA - PB to SELL!!Waiting for this low to come in and give us our next sell level.
Multiple corrective patterns over the last couple of months followed by a sharp drop has set up more downside.
It could get back down below 20 again before the next decent rally.
Ideal scenario would see a rally back to the 38 area in an ABCD pattern over a week.
Lets see how this one plays out..

Dollar Index Chart Analysis....
In this situation DXY chart Hopefully create bearish butterfly pattern.
So, market need to Seem sell correction on 112.180 support zone then fully
bullish or if breakout 113.037 resistance level, then market Buy to 114.163
and 115.710 resistance level.

DXY Chart Analysis....
In this situation DXY chart Hopefully create bearish butterfly pattern.
So, market need to breakout 111.450 resistance level then market Buy to 112.700
and 114.420 resistance level.

LINKUSDT Monthly Inside Bar ZoneLINKUSDT price action is now returning to the Monthly Inside Bar Zone after rejection from neckline of the Head and Shoulders Top. I'm expecting a swing downward to fill the gap below the weekly volume POC by least at Monthly Inside Bar open level. This level seems to be a psychologic key level for traders that waiting for long positions opportunities. I'm considering, if price reaches this zone at the time of the US Market open, a strong pullback can occurs. Then a 2nd touch to superior trendline will be expected. Due to the bearish tendence of US market, specially after S&P500 made a lower low invalidating a possible double bottom, more lows can be expected. LINKUSDT will remains bearish below weekly volume POC @ USDT 7.00 zone when entering in a daily bearish momentum with a weekly candlestick bearish close. 2 weekly candles downward can be form a right shoulder on 1W chart due to a Butterfly as showed on comments below. Then a potential breakout from this monthly Inside Bar will be the frontier for bears to project new bearish impulsive wave.
Oscillator:
Fisher Transform H4 and 1D timeframes

$NQ Combo Long side worked perfect for plus 352$, risking only partial profit on short. My favorite pattern by far, let's see how it goes. Es has a bat pattern as well. High fail rate but if it works this will really be painful for bulls.

MCDOWELLMcdowell made butterfly pattern on smaller (15) min time frame.
Could be bought with mentioned stoploss & targets

$BTC Butterfly If Btc trades in the 1.272/1,414 extension window I will be looking for price action to get long. That price action would include a pin bar, engulfing bar or inside bar. In addition a 2 /618 double bottom or low time frame harmonic would also trigger the pattern. I will update price action if it gets there. Please note the double daily inside bar that a break high or low should give us a direction, I will update in notes. Thanks for looking and let me know your $BTC thoughts in comments.
