SOFI weekly bullish butterfly Kinda a classic pattern!
I'm researching for personal lending platform stocks recently,
as UPST is no doubt the rising star last year, SOFI still has something that's worth looking at.
Also, the concept of Social Finance will still catch many crypto investors' eye to see how it happens in 2022,
SOFI's crypto business is also part of the reason that I'm interesting in it.
In short, as it enters the entry point of this butterfly, I would like to look for some long opportunities here.
Let's see how it goes yo!
Butterfly

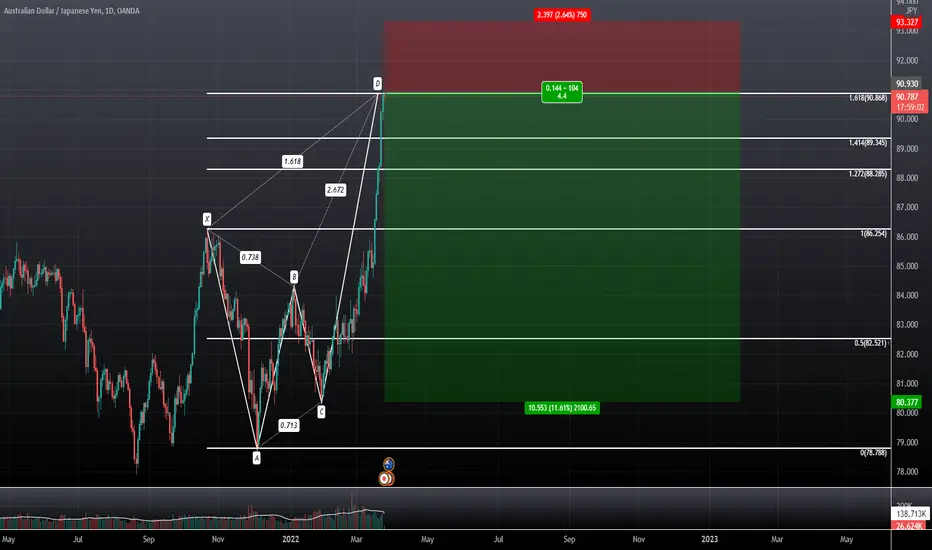
AUDJPY at PCZ of Bearish Butterfly Looking Ready to CollapseWill be entering an Initial Short Position now and will be entering a Deeper Position if after the Bank of Japan releases their minutes tonight we don't see a sudden decline in the JPY to invalidate the pattern.
COMPUSDLONG-TERM: Weekly classic bullish divergence , double bottom , falling wedge breakout, PCZ of bullish butterfly . (not financial advice)
tailoring position sizes for looser stops is important*

XVS/USDT-1D-BINANCE (Bullish Butterfly)This is not a financial advice. Always do your own research and always put stoploss in your trade (SL) :) If you want more detailed info
how to study and read charts or just need help with some coin, just write to me here a comment, i will try to answer to everybody...
i can help you :) all for free, don't worry, BE HAPPY!

DOGE/USDT-1D-BINANCE (Bullish Butterfly)This is not a financial advice. Always do your own research and always put stoploss in your trade (SL) :) If you want more detailed info
how to study and read charts or just need help with some coin, just write to me here a comment, i will try to answer to everybody...
i can help you :) all for free, don't worry, BE HAPPY!

DODO/USDT-1D-BINANCE (Bullish Butterfly)This is not a financial advice. Always do your own research and always put stoploss in your trade (SL) :) If you want more detailed info
how to study and read charts or just need help with some coin, just write to me here a comment, i will try to answer to everybody...
i can help you :) all for free, don't worry, BE HAPPY!

SLPWe might dip back to 0.0170 and most likely bounce from there. We might reach levels back to 0.0185 and possibly 0.0190. RSI resistance is being retested, we will know if we will bounce back or dip back inside the RSI triangle. We might also dip lower than 0.0170 which is 0.0162 due to the hidden bearish divergence.
- Hidden Bearish Divergence
- RSI resistance being retested once again
- Bearish Butterfly Pattern


GBPJPY - Butterfly patternEntry Sell
-Expanding Triangle.
-Butterfly pattern.
-Trendline.
TP
-Demand zone (Fibo 50%)
-Structure (Fibo 78.6%)


Shiba Inu/ USDButterfly Pattern Formation on Shiba Inu:
It starts with a bullish XA move. AB is then Bullish. BC is bearish, and CD is Bullish again.
XA: This can be any price activity on the chart. There is no specific price movement in Butterfly pattern.
AB: The AB move should be 78.6 % Fibonacci of XA.
BC: The BC move should finish between 38.2% and 88.6% Fibonacci of AB.
CD: The CD move will be the final part of the pattern and often extends forming 127%, 161.8% or 224% of AB extension.
The target price of the pattern can be 3 intermediate targets before the final target which are:
Target 1: point B swing.
Target 2: Point X swing.
Target 3: 161.8% of AB.
Target 4: 224% of AB.
Falling Wedge (Contracting or Symmetrical Triangle): When the top resistance is declining and bottom support is raising a contracting or symmetrical triangle is formed. In case of Shiba Inu we are waiting for the breakout of the current pattern.
Disclaimer: “The above is an idea only and not any kind of financial advice so please do your own DD (Due Diligence) before any kind of investment”.
If you like my TA & ideas!! Want to keep yourself updated with current market action,Please follow my profile for more analysis.
Thank You.

AUDJPY....D= Analysis on the daily chart
= Analysis based on harmonic patterns
= He completes the drawing of the butterfly model, and when it is completed, we have a landing to achieve the model's goal


SLP small correction Looking at 1H TF, It seems that we have a hidden bearish divergence in the chart. Supporting the hidden bearish divergence is the bearish butterfly pattern as well. We might go down back to 0.0157 and from there we will bounce very high for long term.

haHavells broke out of previous swing high in yesterday's session & its trading above it in today's session with decent volumes.
Could be bought with mentioned stoploss & targets.

Bearish Butterfly PatternWe are approaching a completed bearish butterfly pattern. I will be looking for signs of reversal at the 1.272 level

USDCAD....D= Analysis based on harmonic patterns
= He tries to draw a butterfly pattern..and the model is completed if it reaches 1.21878...and if he does so, the target of the model is 1.2498

SLP Bullish butterfly pattern appearing at 1H TF. We might bounce back again back to 0.0172 and retest the resistance. There is also a chance of a dip due to another hidden bearish divergence in the chart. If RSI goes below the green line then we might dip to 0.0155 or lower. As long as we stay above the green line in the RSI levels, SLP is still bullish.

UNI/USDT-1D-BINANCE (Bullish Butterfly)This is not a financial advice. Always do your own research and always put stoploss in your trade (SL) :) If you want more detailed info
how to study and read charts or just need help with some coin, just write to me here a comment, i will try to answer to everybody...
i can help you :) all for free, don't worry, BE HAPPY!

FLM/USDT-1D-BINANCE (Bullish Butterfly)This is not a financial advice. Always do your own research and always put stoploss in your trade (SL) :) If you want more detailed info
how to study and read charts or just need help with some coin, just write to me here a comment, i will try to answer to everybody...
i can help you :) all for free, don't worry, BE HAPPY!


Solana at PCZ of Bullish Butterfly with Bullish DivergenceWe have some Bullish Divergence here at the Minimum Retrace of the Bullish Butterfly it can go all the way to as alow as the 1.618 ay 25 Dollars but it could be worth giving it a shot up here first and if we get stopped out we can try again later when it's lower
