GBPUSD...D= Analysis on the daily chart
He almost finished drawing the butterfly model, which is a harmonic model
Now he will achieve the butterfly's target of 1.3363
Butterfly

"AKROUSDT" looks like Bullish Butterfly BINANCE:AKROUSDT
"AKROUSDT" looks like Bullish Butterfly, the D leg also matches the ATL (All Time Low).

DOCK token formed bullish Butterfly for upto 230% big moveHi dear friends, hope you are well and welcome to the new trade setup of Dock token.
Previously we had a nice trade of Dock:
Now on a weekly time frame chart, the price line of DOCK has formed bullish Butterfly pattern.
Note: Above idea is for educational purpose only. It is advised to diversify and strictly follow the stop loss, and don't get stuck with trade


BTC making bullish butterfly at $35,707Yesterday I shared bearish butterfly on 2 hourly, Today we have a bullish butterfly in process of developing. Its amazing how two harmonics are being developed on same time frame. This clearly is a sign of uncertain market. We have weekly closure and soon FED will have a verdict on interest rate hikes plus other macro factors in play. We also have news circulating that Russia is looking to liquidate billions of $ in crypto through UAE exchanges due to which big short in amount of 5200 positions have been opened by bitfinex bears. So lets wait and see the outcome of these shorts first and then take positions accordingly.

USDJPY H4 WOLFE WAVE AND BUTTERFLY OR DEEP CRAB PATTERNHello traders. I see WOLFE WAVE and BUTTERFLY or DEEP CRAB pattern on USDJPY H4 chart. Good luck everybody.

BTC bearish butterfly touchdown $46KBTC is in the process of developing a bearish butterfly pattern on 2 hourly, If you look at the pattern entry point, That level is a strong supply zone and we will most likely dump down from that level towards $40k. I do have a speculative theory though I really don't believe on speculations AT ALL but my speculative theory has some reasoning to it. From November until now the lowest price BTC touched was $33k afterwards next support was made at $36.8k. Moreover we made another support at $37.5k and now we are in the process of making $39k a strong level and next in line would be $40.5k which is TP2 of this harmonic. These supports are already there but my point is that every time a lowest point was touched, It would not repeat again. We saw $34.4k wick on 24th feb but that end up closing at $38.4k. This is just a mere speculative theory so don't take that as a universal truth :)

SLP will possibly go back to 0.0191SLP might go back to around 0.0184 if RSI breaks resistance. If not then it might dip further to 0.0170. If candle closes above 0.0184 then we might go higher back to the previous high which is 0.0191. I'm favorable on the bullish side due to the bullish butterfly pattern.

Possible slp dipIn 1H TF, SLP might dip around to 0.0174 or even lower.
- Hidden bearish divergence
- Bearish butterfly pattern
I’m just new to doing TA, so all i know right now are patterns mostly. Advices are appreciated in the comments, thanks!

TERRA LUNA Breaking out of Bull Flag Targeting $150We bounced from a Bullish Butterfly at the bottom of a channel and are now breaking the Channel and if targets are reached we will be seeing $150
$XRP SELL Hey everybody! -Much bless and prosperity to whom who reads this idea.
On this idea I'm noticing a retracement in C to the golden zone (61.8%). There is also a very noticeable Hand and Shoulders using the temporality of 2H.
If the price breaks the trend line, we might wait for a retracement to the previous low, and ride the wave down to possible $0.58 - $ 0.52.
Best regards,
JR

TOTAL3 Bullish HarmonicThey're not gonna let this dog down without a fight. Even with net inflows of BTC and ETH to exchanges, massively over-leveraged longs and huge amounts of BTC held underwater. Probably a short but sweet bounce here within an outer downtrend.
* * * Not investment advice * * *

🧿 A Lovely 🅱️bBtcChrt Wouldn't You Agree ? 🎱One Might Find
Themselves At A
Particularly Advantageous Time
To Buy Some
BTC At This
Point
Presently
Just A Thought
💜🔷Ⓜ️
BINANCE:BTCBUSD

gold trading idea till FOMC
Assume base on factor such as
DXY back to 96.5
and people kept on buying US10Y , ( look at the latest balance sheet in fed, there are currently no signs in slowing the buy yet except December)


MUTHOOTFINMuthootfin made butterfly pattern on smaller time frames & confirmend it by breaking 1348.
Could be bought with mentioned stoploss & targets.

COLPALColpal after breaking 1417.65 confirms butterfly pattern.
Could be bought with mentioned stoploss & targets.


Update 2 on the BTC Log XABCD Butterfly & operating assumptionTLDR : Current price action around the $60.6k (1.618fib) target has put the $375k (2.618fib) target into play. Also the NVT is poised bullishly. Confirmation has not occurred for either so margin trading is for degenerates (like me) only. View the linked ideas for more information on the log harmonic XABCD butterfly, which is a very technical formation.
Introduction
My linked ideas will go over the log butterfly and why I think it is a valid formation. Those ideas have focused on the 1.618 target but technically I see the justification in the chart that puts the 2.618 closer into reach. I am pattern trader first and I use indicators to help clear up my biases and set up my trades. For example, volume is suppose to confirm all patterns. I like my margin trades to be backed up with a lot of standard and hidden divergences as possible. I was right when I called the stall at 1.618 based on the chart pattern and now there is a nested structure that can get price above the all time high, which means that an impulse to 2.618 is realistic and even probable.
Analysis
The NVT is now in the green on the 5 day, which is a pretty high time frame for it to be green on. Using the NVT isn't an exact science, but broadly speaking the longer it is in the green the more oversold it was, so the better the recovery, and the higher the time frame it enters the green on the more oversold bitcoin was compared to the network transactions values. Even if the NVT is only in the green for a few periods on the 5 day it has rallied some 40% when it enters the yellow again. If this uptrend is powerful enough we can set new highs. At the least we should get something resembling a beautiful bull trap.
The butterfly target of 1.618 has a downside target of about $625.00 That is pretty hard for people to comprehend, but that is fine. The target is the target none the less. Now the main chart shows the targeting if price reaches the 2.618 target. That target is comically low at less than $250 of full performance. Harmonic patterns are kinda humours to me in a way, because price goes up "bearishly" and down "bullishly" before the pattern snaps and targets get hit. A key point to note is that every point on the way down, X, A, B, and C are all legitimate places for the price action to stall and the pattern was still valid. If I post an update to this idea and price goes up to the 2.618 target and wicks through on the monthly and then falls to B at $13.8k and stalls there I see this series of ideas as an absolute win.
The chart below shows some flagpole analysis and is the nested structure that can perform to get price moving.
Operating Assumptions
Broadly speaking, in bull markets when you see a pattern you expect it to break bullishly, even if it is a neutral pattern. If you are trading and you find you are getting formation not quite reaching target or reversing on you so quickly you didn't move your stops to break even or to take partial profits then that is a sign the trend is changing on you. While Bitcoin was topping in 2021 my shorts did very well when things triggered. When I saw that patterns were not breaking down anymore it was time to reassess. For the last month or so my shorts have done very well again, but the last couple of ones have stalled. I went from getting full performance or over performance to having to close my shorts manually because they looked like they ran out of steam and then finally I was either stopped out just in the money or for a loss. So it is time to reassess trend. I am comfortable swing trading once I have a bias but I do best when I only take one kind of trade, either all longs or all shorts, or I wait to decide what to do. If I find myself tempted to trade against my bias then it is time to wait and reassess.
My linked ideas will show why I am so macro bearish, and even this formation goes up "bearishly" so I don't feel I am contradicting my recent posts with this idea. When you have weird economic conditions you can get a crack up" boom
"A crack-up boom is the crash of the credit and monetary system due to continual credit expansion and price increases that cannot be sustained long-term. In the face of excessive credit expansion, consumers' inflation expectations accelerate to the point that money becomes worthless and the economic system crashes. The term was coined by Ludwig von Mises, a noted member of the Austrian School of Economics and personal witness to the damages of hyperinflation." (www.investopedia.com)
I have a strong suspicion when all this is done if you cant live in it, eat it, or are addicted to it then that asset will be sold off first. That is how we get bitcoin to lose over 99.9% of its value. It isn't that far off when you have a bit of economic history that you lived. I was a young man when the dotcom bubble popped but I still read enough news to find out people lost fortunes holding on to stuff that lost over 95% of its value. My uncle worked in Silicon Valley in the tech industry and was very opinionated about outsourcing, the fact that tangibles will keep their real use value when you are hungry. He was able to make it through comfortably because he sold his company stock wherever it went up "too much". Lessons like that don't just go away easy.
Below are some of the top looser of the dotcom bubble burst. As you can see, they all lost over 85% of their value two or three times. The psychological damage can be very intense now lots of these companies, which made physical deliverables, are also pumping again. But if these investments can lose over 95% of their value, something like bitcoin, which loses 30-50% of its value and gets it back as a matter of routine, is up for quite the beating.
Even a company like Ford, with very tangible products and assets can lose over 95% of its value.
Anyway, back to trading. The flagpole chart has very easily discernible tradable entries and exits to even a new textbook trader. If we don't break the channel on the weekly time frame with a full body then the idea that price can to to the 2.618 level gets negated real quick. If price sets a new low then the idea we can get to the 2.618 level in short order gets negated. I see some bullish line breaks and chart formations on some alts I am going to margin trade long like a degenerate. But as soon as I get done with this post I am moving my stop to guarantee a tiny bit of profit and cover my funding expenses. I have enough TA to justify operating under the assumption that Bitcoin can reverse here and at least move up to 70k. In fact, the log XABCD Butterfly both justifies the stall here at 1.618 and the move higher, so I am going to go with that as well.
My most recent trade
I have not been posting too many of my alt coin trades just because I have a lot going on and those ideas can take a lot of energy and not get a lot of traction due to how few people look at them. Right now I like dydx as a long because of how strong it looks against eth and btc as it sets a floor. This trade is hoping a small ascending triangle gives me a good entry on a pump that gets price out of the falling wedge. I will be moving my stop to guaranteed profit here shortly but I am going to give this one a lot of room to run.

EURUSD-Weekly Market Analysis-Mar22,Wk1If you have engaged the EURUSD trading ideas on Friday, you would have earned 106pips(1,060USD/lot) from Bullish Bat, and have your stop-loss at entry and attained a risk-free trade .
Trend Traders can wait for a shorting at 1.1307. You may wonder, hey, you were long on the 4-hourly chart, why look at short on that 1hourly chart.
If you have checked and compared the trade you would know that by the time the Bearish Butterfly Pattern form on the current timeframe, it would have passed the Target 1 of the 4hourly chart Bat Pattern.
The 1hourly Butterfly Pattern could be a retracement on the 4hourly chart. Besides, a lot of Harmonic Pattern Traders took off major position on the first target, when that happens, a retracement is expected.
However, if this is too confusing for you, stick with a single timeframe trading, and if you are looking to excel, look for a trading coach.

For Long term investment +200% !the daily chart pattern make butterfly pattern
the target will take a month to be in done

AGE | Bear Butterfly Harmonic | Limited upside Take Profit 50%Price action and chart pattern trading
> Bearish butterfly harmonic pattern limited upside
> Take profit 50% long term uptrend
> Target downtrend at B position of butterfly / EMA10 / Fibonacci 0.618
Always trading with affordable risk and respect your stop loss

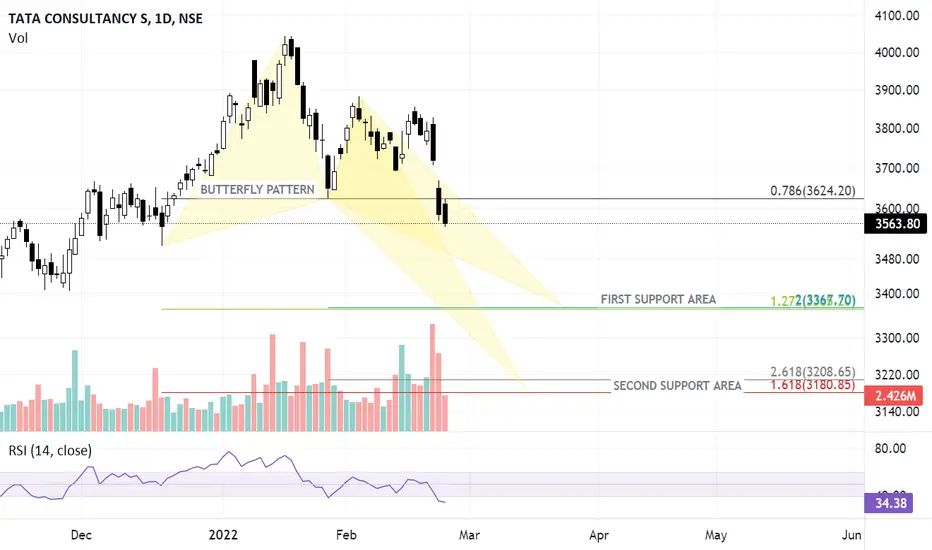
TCS HARMONIC LEVELS FOR POSITIONAL TRADINGTCS is currently in a correction mode, and it is likely that we may see further weakness in the stock, and stock could move lower to 3400 to 3200 levels in the near term.
This is a great stock for Investment and for positional trading also.
I can see butterfly pattern formation on its daily chart, which is suggesting a good support area around 3400 -3367 levels and at 3180-3208
Stock can be bought in tranches as both of these levels can be seen in the stocks.
Disclaimer: Not a recommendation to trade.