TSLA SHORTNASDAQ:TSLA
TSLA ON 15/MIN Chart We may see it run to 1155 before rebound to 11028. PT1120-1101. STOP LOSS 1160 . IF close above 1160 we may see 1170 next
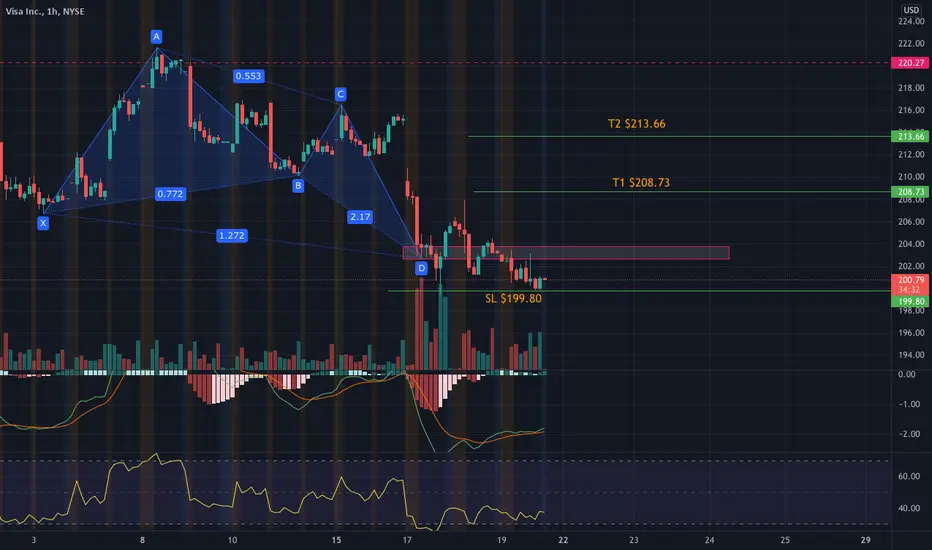
Butterfly

XBTUSD Harmonic pattern: - bullish butterfly pattern printed on 2H timeframe chart, good sign in bear trend but also we don't want to forget its bear trend, on yesterday's pullback i recognized its becoming stronger and i also don't think to miss this opportunity i will try with minimum risk, and keep attention on 1.618 fib extension level if bitcoin price 4H timeframe candle close below fib extension 1.618 level then pattern will be invalid, for good long entry point 56500 - 55700 area open partially order and take profits as per fib extension reversal points, don't worry i cross checked its perfect levels for take profits, best luck.

XELA Turnarount?I've been following XELA recently as it approaches the point of a falling wedge. The point of the wedge seems to converge along an area of resistance. There is also a so-so Butterfly Pattern with the D-leg ending at the same point (though I'm not well versed in harmonics) and RSI about to cross south of 30. Could XELA be poised for a turnaround? Thoughts?
Obligatory "not financial advice" comment.

Reliance Long opportunityReliance moving toward PRZ1=2370
PRZ2=2275. Reversal can be expected from any PRZ and demand zone.
CMP=2373


Bullish Butterfly on FTMBullish divergence which saw a pop out of the PRZ on the bullish butterfly. Didn't quite touch the 1.27, but to me that shows strength. Nice volatility spike with the fisher off of the lows, shows conviction. BBWP looking a little top heavy, so we could just be taking a breather here. Always a possibility we come down and retest that area though. I am looking for the test of the first target at 2.43, with the second at 2.6181. Anything above that, I would be looking for this to make a new ATH.

BTCUSDT Bullish ButterflyBullish Butterfly with divergence. Let's see if it can hold and move higher.

Adopting Scott Carney's Harmonic Pattern: Bitcoin's ButterflyI am just observing this potential pattern. Harmonic patterns like this originate with Scott Carney. You can learn about it at his website @ harmonictrader.com
He is a living legend. As an investor, I think may provide an extra layer of tools to one's personal arsenal in trading. It might come in handy and help one see the market one is looking at from a different perspective.
I hope my identification of the butterfly pattern is correct.

Bitcoin (BTC) formed bullish Butterfly for upto 20% moveHi dear patrons, hope you are well and welcome to the new trade setup of Bitcoin BTC .
Previously we had a nice harmonic trade of Bitcoin:
Now on a daily time frame, BTC has formed bullish Butterfly pattern.
Buy between: $57633 to $54518
Sell between: $60050 to $65900
Stop loss:
Stop-loss can be set below the maximum extent of buying zone which is $54518
Possible profit and loss ratio:
As per the above targets, this trade has a profit possibility of up to 20.5% and a loss possibility is 6%.
Note: Above idea is for educational purpose only. It is advised to diversify and strictly follow the stop loss, and don't get stuck with trade

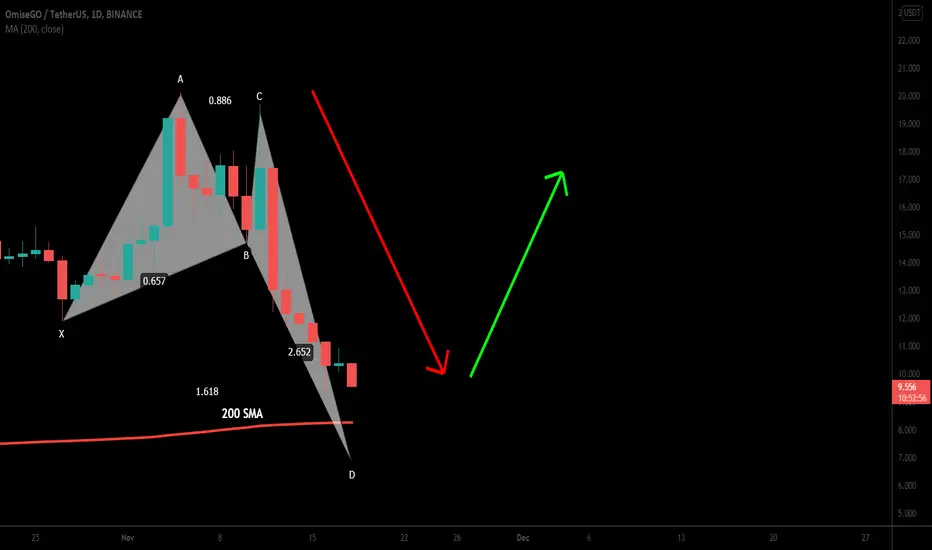
OMG Network (OMG) formed bullish Butterfly for upto 153% moveHi dear friends, hope you are well and welcome to the new trade setup of OMG Network (OMG) token.
Previously we had a nice harmonic trade of OMG:
Now on a daily time frame, OMG formed bullish Butterfly pattern. There is also 200 SMA support in the buying zone.
FTT/BTC-6H-BINANCEThis is not a financial advice. Always do your own research and always put stoploss in your trade (SL) :) If you want more detailed info
how to study and read charts or just need help with some coin, just write to me here a comment, i will try to answer to everybody...
i can help you :) all for free, don't worry, BE HAPPY!

NZDJPY - Bullish ButterflyIf you had joined us last night, you would have seen how we use the Double Top Retracement zone and project a Bullish Butterfly completion that hit our final target level.
The market sort of did a rebound after it "woke up" from the ungodly hour.
Check out the live stream and you can see how the analysis was done at , you could watch from the start and learn how the zone was plotted.
www.tradingview.com

PLTRDISCLAIMER:
I am not a financial or investment advisor. All information found here, including any ideas, opinions, views, predictions, forecasts, commentaries, suggestions, or stock picks, expressed, or implied herein, are for entertainment purposes only and should not be construed as personal investment advice. If you decide to invest, please make your own decision, or contact the specialists’ institutions. Thank you

$VUZI, DailyDISCLAIMER:
I am not a financial or investment advisor. All information found here, including any ideas, opinions, views, predictions, forecasts, commentaries, suggestions, or stock picks, expressed, or implied herein, are for entertainment purposes only and should not be construed as personal investment advice. If you decide to invest, please make your own decision, or contact the specialists’ institutions. Thank you

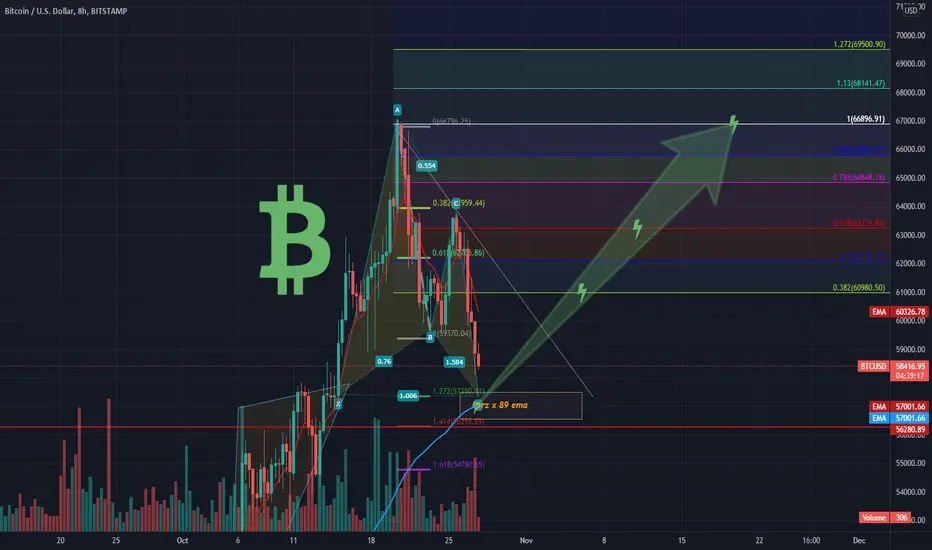
$BTC on watch for bounce, Butterfly x 89 ema Detailed set up, Buying w price action only in prz, watch 89 ema (blue line)
Gold short-term targetGold in the next week will go to 1833 then we will see if he goes to 1900
watch the butterfly pattern
must do a retest before he goes to 1900

Harmonic patternIn case of breaking the blue diagonal line from above, the probability of forming a harmonic pattern of bear butterfly type and climbing up to 320


IOSTUSDTPERP LongI saw the Butterfly harmonic pattern on the IOSTUSDTPerp in 1H TF. The price is perfectly re-testing the current support. Once rejection on the support is confirmed it is safe to enter the trade. If you want to enter the trade, please don't use more than 1% of your capital and manage your risk wisely.

btcusd harmonic pattern :- butterfly pattern, successfully short from the D point, expected target as per fib 0.50 level hit

#EURUSD LongUp move coming on EURUSD ..., Butterfly pattern & possibly the end of wave B ...
Good Luck
