DOGE butterfly to $0.5#DOGEUSDT
$DOGE broke out from descending resistance line and confirmed it as support. now price is above support zone between $0.265 and $0.238. if price hold this support it is possible to touch $0.5 that is the target of butterfly pattern.
a break below $0.238 can drop price to ascending support line.
Butterfly

MIR butterfly pattern to $7#MIRUSDT
$MIR broke out from descending resistance line and confirm it as support. now price struggle to break out from resistance zone between $3.28 and $3.37.
in bullish way after break out from this resistance zone price will head up toward $3.73 and $4.2. also in weekly time frame a butterfly pattern shows the target around $7.
in bearish way price can continue side way moves to $3 and $2.85.


EURAUD's Daily Bullish Butterfly with other SpecsFundamentals:
N/A
*This is purely a technical trade....
Technicals
Scott Carney's Bullish Butterfly Pattern
This pattern stretched a bit, but looks harmonic
Daily Support tested with engulfing bullish candles
RSI oversold
ExDiv#1
Weekly D3 ( not shown in this daily chart )
Comments:
I see this as a possible technical retracement to 1.57, 1.58 or 1.60 (300 to 500 pip retracement).

🦋 🦇, Potential Double Top and BOS! GBPJPY - Potential Double Top on the HTF.
Daily is now bearish and i've just caught this Bat on the LTF that lands directly into an OB/imbalance that potentially needs mitigating before price drops.
(Theres also another one just above, very strong lands on the .886 of that daily zone) I will look to potentially scalp this long up-to these zones before taking any swings short.

HTF Shark 🦈 LTF Butterfly 🦋USOIL - Momentum is bearish on the HTF and I'm looking for the shark to complete, however price is currently ranging and I expect another push to the upside before the continuation.
Let me know your thoughts!

GBPAUD - Bullish Butterfly checkbackA bullish butterfly pattern checks back and it retests the previous candle wick that complete the butterfly pattern with RSI Divergence.
If this is for you. a Deep Gartley Pattern and Shark Pattern formed on the daily chart for a buying opportunity.
Based on the daily chart it is a trend trading(buying) opportunity for trader.

GBPJPY - Bearish BatIf you have engaged after this candle closed. It is a great call. And this is why you should have engaged in the trade.
1. It has reached the completion price of the Bullish Butterfly Pattern(cyan).
2. Bat Pattern consolidation at D, but fail to break and close above Point X of the Bat Pattern and that is a good sign. It attracts structure traders to hop in.
3. Long shadows appears, showing a strong rejection of the Bearish Bat Pattern.
4. RSI Divergence is a good sign of GBPJPY weakening.

US100 will GO DOWN in the PRZCURRENCYCOM:US100
***This is just my personal analysis and there is no buy or sell signal***
!!!Do not forget that the market is based on probabilities!!!
Good luck and profitable

Butterfly@1.272XA
The Incredible and the amusing Bearish Butterfly@1.272XA it's being created by the price perfectly.
Here is what I believe about this edge, the US30 has being in a big uptrend
and that can be possibly the reverse of the trend or just a retracement
and can create a big impulse so the price reach higher highs never thought by the human being,
but the Harmonic Pattern Butterfly that can really provide to us a great opportunity to make some pips,
that being said, let's go to the rules.
Rules:
1. Harmonic Patterns Completion " Bearish Butterfly@1.127XA " - 70% close to completion;
2. PRZ Hit - Waiting;
3. PRZ Test - Waiting;
4. Terminal Bar - Waiting;
5. Type-1 Reaction - Waiting;
6. Type-2 Reversal - Waiting;
7. Candlestick Reversal Sign - Waiting;
8. Candlestick Confirmation Sign -Waiting;
9. RSI Reversal Sign - Waiting;
10. RSI Confirmation Sign -Waiting;
11. Risk Management - Applied;
12. Risk / Reward - 1/3.
" The Lord confides in those who fear him,
he makes his covenant know to them.
My eyes are ever on the Lord,
for only he will release my feet from the snare".
Psalms 25 : 14-15
NIV

Horizen (ZEN) forming bullish Butterfly for next moveHey dear friends, hope you are well and welcome to the new trade setup of Horizen ( ZEN ) coin.
Previously we has a nice trade of ZEN:
Now on a 4-hour time frame, ZEN is completing bullish Butterfly pattern.
Note: Above idea is for educational purpose only. It is advised to diversify and strictly follow the stop loss, and don't get stuck with trade

NZDCAD Bearish ButterflyYou can go for 1:2 or 1:3 and set BE when reached 15-20 Pips. And stop loss 10-15 pips. Good luck 🙂


Potential Butterfly/Crab for PRZ We have a butterfly thats almost complete and a potential crab too if price doesn't respect the butterfly on the HTF (This could indicate a potential PRZ)
If we get reversal signals at either of these levels or in-between then we can be safe to take this short.
But for now momentum is still bullish on the LTF, we have BOS to the upside and a nice momentum trendline (Which is close to the D point of the butterfly, so im waiting for a break in momentum and BOS before potentially shorting this.
Let me know your thoughts?

Potential Daily Crab and Bat Almost Complete!GBPUSD - Weekly supply zone is strong, the pennant failed to break to the upside, so now i'm looking bearish on the HTF.
Price has created EQL and EQL, I want to see this Bat pattern complete, possible with a stophunt on London/NY (4th hit to the high before price falls) to take out the liqudity before falling back towards the previous weekly low and continuing the HTF trend.
Let me know your thoughts!

GBPCHF Bullish ButterflyBullish butterfly detected and you can take this trade once you get confirmation. Make sure you go lower timeframe for finding the position. Good luck 🙂

TEL butterfly pattern#TELUSDT
$TEL broke out from long term descending resistance line and stayed above support zone, also hold the long term ascending support line.
if price hold the current support, for completing the butterfly pattern it can touch $0.035 and $0.0375.
it is possible to head down to the long term support line, and if break it down nearest support is around $0.0135 and then $0.0097.

Butterfly, Pennant a & Liqudity! GBP/USD INSTANT BUY 📈
ENTRY: 1.37778
TP: 1.38880
SL: 1.37624
Re-entry ⚠️ (Risky use low lots to start)
PA is still bullish, we have a pennant on the Daily (If this breaks price will fly) We also have some nice intraday bullish patterns and trapped liquidity above, only downside is were inside a weekly supply zone so it's bull vs bears at the moment, but I'm flavouring bulls!
We already took 30 pips earlier, and PA is still looking good for buys, lets see if we can take some more! 🤘

ETHUSD IS READY TO FLYafter breaking black trend line we are waiting that chart touches the support lines and then break the blue trend line to move on and get its resistance and its reality and what ETHUSD deserves.

Bitcoin, M30 - Potential Butterfly patternAfter reaction on 78.6, possible Butterfly harmonic pattern on external retracement 127.2 (62500-62600). There is also S/R zone.

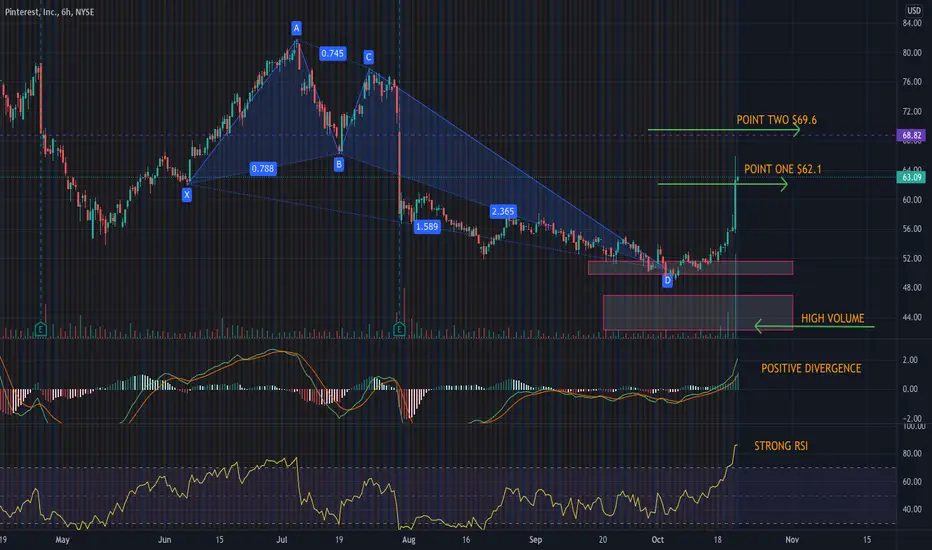
PINTEREST Bullish ButterflyPINS formed a bullish butterfly shape and bounced back from target, point one achieved and point two is $69.6.
REN/USDT (Interval 2H) Bullish ButterflyREN is in a process of making a bullish :butterfly: pattern, Most likely candle will touch the PRZ, I have marked SL, Entry and TPs according to fibonacci values.
