BTC STS (Short Term Short)Daily bearish butterfly in development. Shorting BTC around 68k with SL above 70k. Target 1 is B wave which is around 54k. Counter trend trade but good R/R. And yes I do believe BTC will bounce afterwards and goes higher. We'll see how it plays out!
Butterfly

Shark, Shark, Butterfly! USDJPY - Entered short yesterday but closed early due to momentum change, so now i'm looking for potential PRZ's on the HTF, we have 2 sharks and a butterfly on the daily all pointing to a 200 pip potential PRZ zone with multiple possible entry/reversal points, ill be waiting for a HTF (1H or 4H) reversal pattern before entering anymore short trades on this pair, I will just scalp longs with PA for the time being!
Price is currently sitting in a strong weekly/daily supply zone.
What's your thoughts?

The Dow's is clear.Hang on this cycle, accumulate what you perceive valuable with good bookkeeping and great stable outlook. Tesla, tech whatever goes to the bin until market tells you risk-off is in fashion.

Watchlist EUROWait for confirmation reversal pattern appear.
This announcement is dated 27 August 2021 in Bursa Malaysia (www.bursamalaysia.com).
#TAYOR MYX:EURO

ALGOUSDT BUTTERFLY SETUPBy using Butterfly Harmonic pattern the target is around 1.27% Fibo ext. X-A
Possible entry when price in range between 0.382% to 0.618% fibo retracement B-C.
FBO from descending triangle.
Pattern invalid if fall below C level.
#TAYOR HUOBI:ALGOUSDT

Bearish Butterfly D1Open - 114.104
TP1 - 111.002
TP2 - 107.417
TP3 - 102.562
SL - 116.492
Please note that my setups are not signals to trade but my own personal analysis and predicted direction. To enter a trade it must be validated by multiple different indicators and confluence factors.

AUDCAD - Bearish ButterflyAn aggressive shorting opportunity for Butterfly Pattern traders. The candle wick just touches the HOP level and seems like it's going to reverse.
8minutes to go for the confirmation. I've engage an aggressive trade on this and I'll leave that to your call.

NFTUSDT BUTTERFLY SETUPBy using Butterfly Harmonic pattern the target is around 1.27% Fibo ext. X-A
Possible entry when price in range between 0.382% to 0.618% fibo retracement B-C.
Pattern invalid if fall below C level.
#TAYOR HUOBI:NFTUSDT

ECOWLD FALLBACKFound Bearish Butterfly Pattern at Fibo extension around 1.27%.
My expectation price will retrace first to 0.382% .
#TAYOR MYX:ECOWLD

WILL WCT FORM A BUTTERFLY PATTERN?Wathout if price BO from point B.
It will formed Bearish Butterfly Pattern when price achieve at point D and price should not below from point C.
#TAYOR MYX:WCT

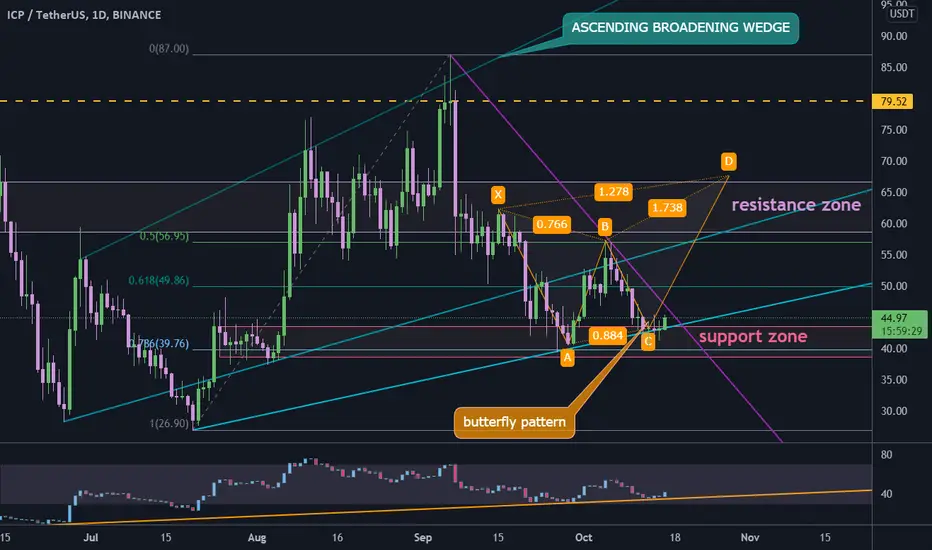
ICP butterfly pattern#ICPUSDT
$ICP seems is in a long term rising wedge, as you can see support zone is doing its job well and price is still above the support. also in RSI if we draw a support, candles hold the support too.
there is a butterfly pattern that if price break out from descending resistance, bulls can go trough the resistance zone to complete this pattern around $65.
Long next shortI think DXY is building a bearish butterfly form. Although it is not perfect, the number is close to the harmonious number, 0.786, 0.886, 2.0, 1.5. So it is possible to get out of this expectation. At present, there may be about 44% room for the first wave of price rise. Reaching the falling 0.618 may reverse after suffering strong resistance. At present, DXY seems to have been adjusted in a small cycle. But it should not rise wildly, at least not in October.

Potential Butterfly!NAS100 - Is about to hit a daily OB, I feel price will reject to the B point or a little lower, creating a liquidity trap to then fill the imbalance before heading up to mitigate the higher and stronger OB before reversing!
I May potentially take all 3 trades if price action confirms it!
Whats your thoughts?
Butterfly@1.272XAThe Bullish Butterfly it's already complete and the PRZ it's on test by th price right now.
Stay tune on that!
Rules:
1. Harmonic Patterns Completion ( Bullish Butterfly@1.272) - Complete;
2. PRZ Hit - Done;
3. PRZ Test -In the Process;
4. Terminal Bar - Waiting;
5. Type-1 Reaction - Waiting;
6. Type-2 Reversal - Waiting;
7. Candlestick Reversal Sign - Waiting;
8. Candlestick Confirmation Sign -Waiting;
9. RSI Reversal Sign - Waiting;
10. RSI Confirmation Sign -Waiting;
11. Risk Management - Applied;
12. Risk / Reward - 1/3

$NIO - Entry based on price action This is another sub-trade I will take based on PinBar price action on the daily timeframe even though it looks shy on the chart, so the stop loss should be more close to the entry. I expect a move of 9% tomorrow🤞

Bullish Butterfly In SightBased on DAILY chart, market is currently busy with a temporary bullish correction.. Soon we should expect strong rejection coming from 1.1650-1.1700 area max. to watch bears continuing down towards Butterfly completion point D.. No rush though! Intraday wise we have to first watch and stay alert for certain resistant areas.. This can take time!


A good harmonic pattern on Gbpusd Hi everyone , how you doing ?
so as we can see , there's a bearish butterfly on gbpusd at 1h
and the price is also in a resistance zone .
after some candlestick confirmations we can probably enter a short position .
!!! today there is an economic report about USD (PPI) , so the market might be a little risky , then don't forget about stop loss .

Gold... A Menagerie of Harmonics
Lots of patterns in play as we approach NFP (Non Farm Payroll) tomorrow.watch politicians make fools of themselves, get deeper in debt ... as world tensions increase.
Take your choice,
I personally favour the $1710 area as the next stop but who knows.
Be flexible and nimble.
Not investment advice
S.

Alibaba (BABA)... emerging from its crystalys ??BABA has lost over 56% of it value in the past 12 months and is now approaching what we believe are support levels.
Additionally we have detected a possible Butterfly Harmonic reversal pattern which may give investors some hope,
This is a weekly time frame and patience is needed.
As usual this is not investment advice. Do your own due diligence,
S.


NAS - Bearish Butterfly ConfirmedThe Broadening Falling Wedge found resistance at the .5 Pattern Break Target and has returned to the linear break level after a confirmed harmonic pattern. Will the low job number add to growth concerns as Big Tech earnings are up this month?

ALGOUSDT BATTERFLY SETUPMy plan as stated in chart.
By using Butterfly Harmonic pattern the target is around 1.27% Fibo ext. X-A
Possible entry when price in range between 0.382% to 0.618% fibo retracement B-C.
Pattern invalid if fall below C level.
#TAYOR HUOBI:ALGOUSDT
