$Nio - investment idea 💡 #NIO has been trading for a while in the demand zone, giving great opportunity for low risk entry. And great target potential. Regardless the fundamental analysis, this is just technical analysis.
From this price I will start buy small positions and buy more with bullish price actions.
❌ - Moving Averages still bearish, price distance to fast ma 0.50% and to slow -17.53%
✅ - The scenario is duble bottom, and bearish butterfly 🦋 pattern.
✅ - MACD
✅ - STOCHASTIC
✅ - Momentum
✅ - RSI Neutral
❌ - Ichimoku very bearish
⏰ - Breakout around: $37
🚦 - Next entries in case if dropped:
- $30
- $23.30
- 18.70
⚠️ - This idea is based on my technical analysis only. Do your research and trade on your own risk!
Butterfly

NZD/USD:DOWNTREND |PRICE ACTION+HARMONIC PATTERN|SHORT 🔔Welcome back Traders, Investors, and Community!
Check the Links on BIO and If you LIKE this analysis, Please support our Idea by hitting the LIKE 👍 button
Traders, if you like this idea or have your own opinion about it, please write your own in the comment box . We will be glad for this.
Feel free to request any pair/instrument analysis or ask any questions in the comment section below.
Have a Good Day Trading !

Attention; Bearish Butterfly on BTC The B point of the Bearish butterly pattern is at 57143.51 which is 0.786. Therefore, if this formation is to work, a pullback from this level may occur. If this analysis works, there could be a downward breakout of the rising wedge around 51,600. After the re-test of the breakout, BTC may fall as low as 32,036. This point is the C level of the formation.
BTC's new target is around 87,100k after the downtrend breakout, indicated by the red line. This point is also the 1.618 point of the formation. The 87k value is also the upper bound of a trend drawn from the 2019 high and 2021 high peaks.
This analysis is the detailed version of the analysis that I have done in the previous days, which includes the potential bearish butterfly pattern formation.
The stated levels are only estimates. It is not investment advice.

Potential Butterfly USDJPY - HTF Bias is Bullish, however Ill be scalping retracements and taking this long if price drops back towards the C point.
Has nice confluence down there & takes out the liquidity and covers the imbalances!
Whats your thoughts?

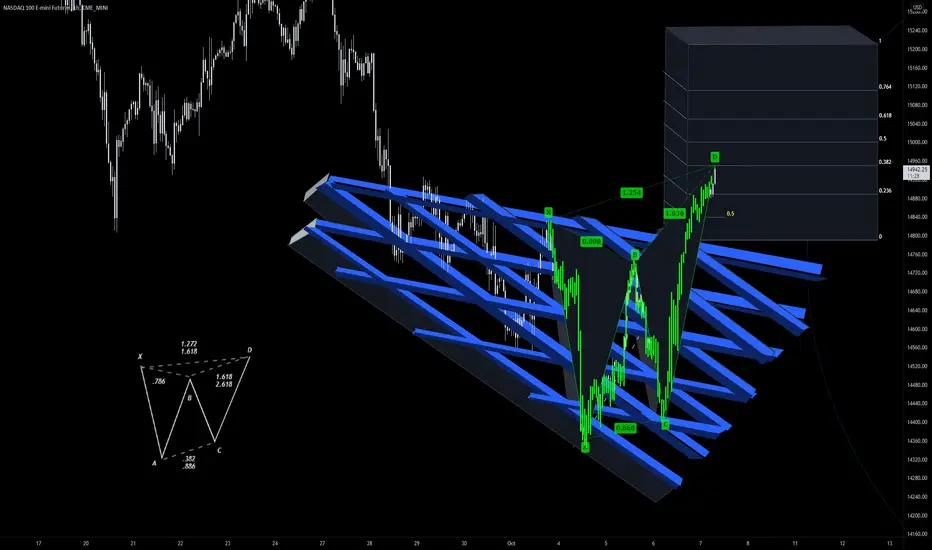
NQ1! - Bearish Butterfly after the BreakoutThe Descending Broadening Wedge confirmed to the upside with a strong move overnight. The pattern moved to the Break Target .382 where a Bearish Butterfly has set-up. With two competing patterns, the break of the descending broadening wedge and the butterfly , scouting a solid higher low. With the Vix crushed and the 10 year note at 1.5 all eyes on rotations between NAS and the Russell as non farm payrolls for September drop tomorrow.
longHi dears
It seems that a head and shoulder pattern and a harmonic pattern have been formed and we are witnessing an upward wave.
Do not forget the loss and profit limits
Good luck.

AUDCAD - Bearish ButterflyAUDCAD having a Bearish Butterfly setup that violates the bearish trendline. The close of the candle at point D of the Butterfly Pattern is pretty important for me to decide if I will engage the trade.

Potansial Bearish Butterfly PatternEarl in the Day, I published a analyze which is short-term bearish. In that analyze, There is raising wedge and that target iş 32-33k area. After that price going into a falling triangle. Triangle target is 87k area. All of that target giriş us a bearish butterfly. I try to see this to you in that chart. By the way İn that chart ( binance future) the butterfly fits perfectly.

longi analys in 1H chart
I'm waiting that price can continue uptrend. We can open long position now and take resistance

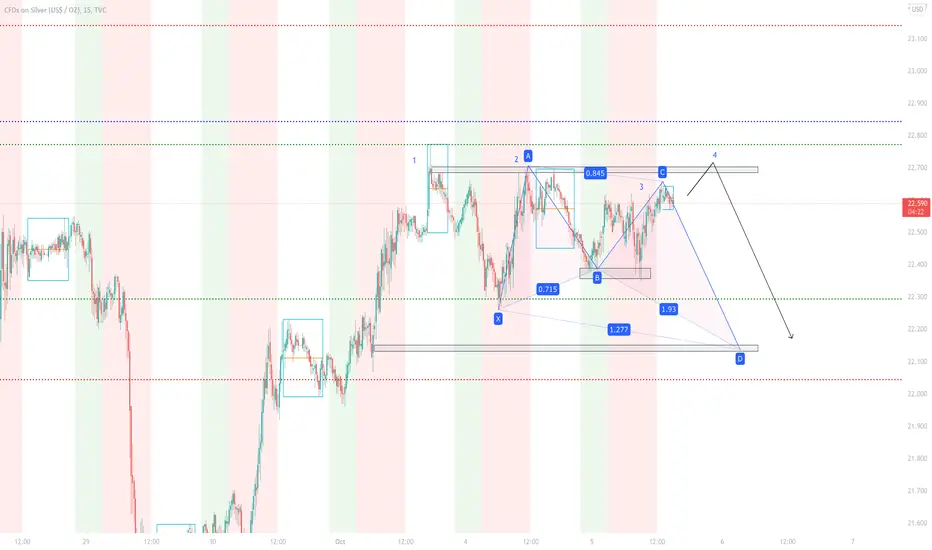
Potential Butterfly! Silver - I'm waiting for a 4th wick to the high to take out liquidity then a break down to the low (Which I will scalp) to complete the potential butterfly which lands on a nice OB, I will then look to take Silver long!
Whats your thoughts?
Bitcoin and it's probable pathIn the coming three weeks, BTC will reach to it's time closure (the red arrow on the chart). furthermore, due to Elliott & harmonic rules, I prefer to think the market can continue to it's retracing path. The support zones are shown on the chart.
Good luck

Potential Butterfly GBPNZD - I'm looking two reversal trades from this pair, one smaller scalp from the X point (Weekly high after liquidity is taken out and the other at the D point at the completion of the butterfly)
There's a very strong OB in this zone and last time price reacted very strongly to it, so that zone is definitely worth setting your alarms for!
Whats your thoughts?

Potential ButterflyUS30 Price has taken out previous liquidity, I'm looking for a retracement to clear some of the imbalance before continuation to make new highs up to the D point of the butterfly!
What's your thoughts?

BNBUSDT BUTTERFLY PATTERNBy using Butterfly Harmonic pattern it will achieve at point D around 1.27%.
It just BO above B level.
SL (stop loss) if price below C level and this plan will invalid.
#TAYOR BINANCE:BNBUSDT

BUTTERFLY FOR BAT?If price BO Below red line my expectation it will form Bullish Butterfly Pattern.
If price BO above white line my drawing will be invalid.
#TAYOR BINANCE:BATUSDT

Butterfly Almost Complete Butterfly completes on the 200EMA, strong support and and order block, I'm going to wait for price to reach this level and wait for the reaction but this is looking like a 100% short, especially looking at the HTF PA! Then targets would be the D point of the Crab which also land down in a strong support zone in January before more rejection!

XRPUSDT REVERSAL PATTERNMy plan is entry when BO from falling wedge line.
Butterfly pattern will form if price achieve 1.27% at point D.
CL if BO belom point C level.
#TAYOR HUOBI:XRPUSDT


Butterfly Landing On the 1.3600GBPUSD, Butterfly D point lands directly on the 1.36000, I'm going to watch priceaction once it reaches this level and look for possible reversals/shorts down to the D point of the higher TF crab which also lands inside a heavy resistsance zone from January.
Whats your thoughts?

DASHUSDT FALLING WEDGETry using Butterfly pattern bcoz freshly BO from falling wedge line.
Risk 1:1 ratio.
#TAYOR HUOBI:DASHUSDT

GBP/USD:BUTTERFLY PATTERN | PRICE WILL GROW 🔔Welcome back Traders, Investors, and Community!
Check the Links on BIO and If you LIKE this analysis, Please support our Idea by hitting the LIKE 👍 button
Traders, if you like this idea or have your own opinion about it, please write your own in the comment box . We will be glad for this.
Feel free to request any pair/instrument analysis or ask any questions in the comment section below.
Have a Good Day Trading !

15 Minute Bearish Butterfly on DogeThe RSI briefly reached overbought and we hit the PCZ, I expect us to come back down towards the bottom half of the range at minimum.

Iggy Azeala to, Dua LipaThis is a special chart here. On the decline, look to the United States dollar and Japanese yen to be the safe haven currencies.
