Bearish Butterfly H4Open - 1.10158
TP - 1.9169
SL - 1.10728
Please note that my setups are not signals to trade but my own personal analysis and predicted direction. To enter a trade it must be validated by multiple different indicators and confluence factors.
Happy trading!!!
Butterfly

TRADE ON XRP/USDT ON 1D TF WITH HORMONICS PATTERN.Here XRP/USDT form a pattern BUTTERFLY if it will break its "B Point" we will short and ride until reversal.
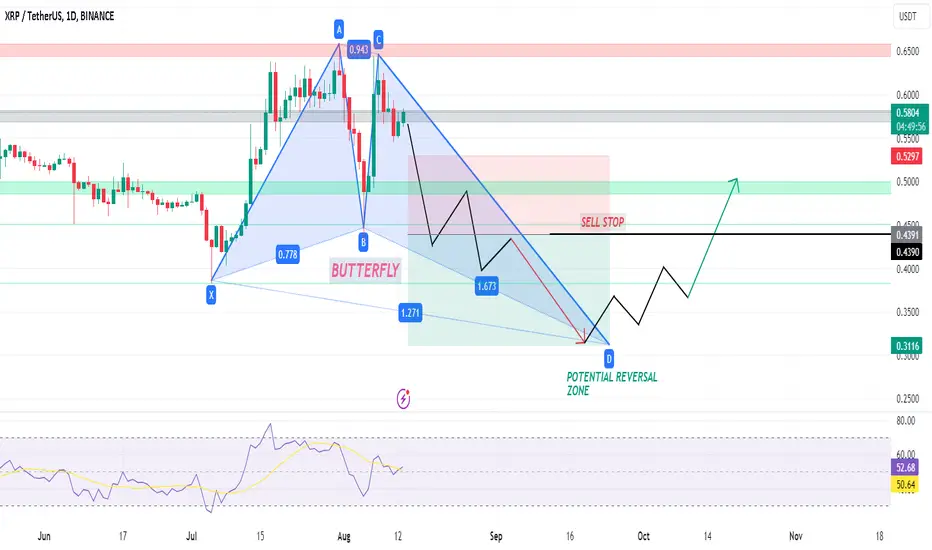
track it - buy at zoneENTRY
- lines marked below is potential reversal zone ( PRZ)
- entry is strictly inside the zone
- look for buying confirmation in smaller time frame ( 15 minutes preferred )
EXIT
1. target
- mark fib retracement from C to latest swing low
- TGT 1 - 0.236 fib level ( intraday target )
- TGT 2 - 0.382 fib level
- TGT 3 - 0.5 fib level ( preferred target )
2. SL
- candle close below (PRZ)
- if u didn't get confirmation inside the zone , ignore this pick
- if candle close is below zone , this pattern becomes invalid . IGNORE THIS PICK
- RE-ENTRY can be done , if u again get buying confirmation inside the zone

Possible Weekly Trend Of VIX 🦋 Butterfly 🦋 the detail is shown in the above Idea.
I made this Idea based on Candlestick Analysis and Harmonic pattern using Fibonacci tools.
in beginning of year 2023
Butterfly of VIX Daily Trend Fall from 29 to 14 .
at last weeks of year 23
buyers crab rose to reach 23.
in year 2024
Butterfly of VIX Weekly Trend probably Will Fall from 19 to 7.

BTCUSD Bitcoin 15Min-TIMEFRAME ANALYSIS💥BTCUSD 15Min-TIMEFRAME ANALYSIS
💗Hello ladies and gentlemen
This is my new idea for 💥BTC Bitcoin
I hope my idea is clear
Support me by like and share thank you
Stay Safe💯💲💲💲
Good luck💰😍

AMD Bear Butterfly Versus AMD Bull Butterfly.the detail is shown in the above Idea.
AMD bear butterfly is formed completely and angry buyers were present in 1.27 F
and now AMD bull Butterfly Is ready ( after growing right eye) to fly higher and higher.

Weekly Analysis of UK100 Butterfly 🦋 the detail is shown in the above Idea.
I made this Idea based on Candlestick Analysis and Harmonic pattern using Fibonacci tools.
In the context of financial markets, the phrase " pull back to last golden level and flying UK100 butterfly to next golden level at 8320 " suggests a potential upward movement in the UK100 index, possibly after a period of consolidation or retracement.
Traders and investors may interpret this as a signal to anticipate a bullish momentum, aiming for a target level around 8320.
It highlights the importance of identifying key support and resistance levels, and the potential for significant price movements.
As with any market analysis, it's crucial to consider risk management strategies before making trading decisions at black circular region .

a RTY Bullish Butterfly Pattern 🦋 Will Start at 1690the detail is shown in the above Chart.
I made this Idea based on Candlestick Analysis and Fibonacci Tool.
RTY buyers are burned in black rectangle ( 0.618 golden level )
Therefore
I expect that RTY Buyers are ready in level 1.27 and 1.618
a Bullish Butterfly Pattern 🦋 Will Start at 1690
.

RUSSELL - Looking Bullish..OANDA:US2000USD Completed a major pattern yesterday so its set up nice for more upside. We do have the big data days coming up on Wednesday/Thursday which can change things but this is where we are for now..
Enjoy the day.

11/07/2024 - XAUUSD - Bearish Butterfly PatternAs of July 11th, 2024, XAU/USD (Gold) is forming a bearish butterfly pattern, indicating a potential downward movement. Here’s the trade plan:
Trade Details:
- Entry: Enter with SL above PRZ or on the breakout of the last HL
- Stop Loss: Above PRZ
Reason for Trade:
The bearish butterfly pattern suggests a potential downward movement. Traders can enter with a stop loss above the Potential Reversal Zone (PRZ) or wait for a breakout of the last higher low (HL) to confirm the bearish trend.
Traders should monitor the price action closely and adjust their positions accordingly to optimize potential profits and manage risks effectively.

Netflix Butterfly 🦋 is Trying to Fly to Next Golden Level.the detail is shown in the above Chart.
I made this Idea based on Harmonic pattern using Fibonacci tools.
We can expect that Netflix Rise up more to reach the golden level and at this point ,a bearish butterfly pattern will start.
To trade a bearish Butterfly pattern, place your sell order at point D (the 127% Fibonacci extension of the X-A leg), position your stop loss just above the 161.8% extension of the X-A leg and place your profit target at either point A (aggressive) or point B (conservative).

Update Tesla stock after profit takingWith this idea, we can easily see the confirmation for a breakout in the weekly frame, which is usually true when the price has passed through the boundary of the second butterfly wing according to this butterfly pattern.
In addition, I have a profit taking level according to this model combined with a 4-year cycle.
Good lucky.!!

Harmonic pattern butterfly + crabHarmonic pattern swing trade
- butterfly H4
- crab H1
Sell in small TF H1 and run profit in H4

Butterfly 1H sellHarmonic pattern 1H
- Butterfly 1H pending sell entry on resistance and 127% Fibo
- Telling stop on 1 RR
simple trade


Update plan gold nonfarm and in JulyIt is forecasted that there will soon be a bullish phase when all signals break for the uptrend. In my opinion, that is a bullish trap.
Please stick to the sell-off scenarios according to the price arrow I draw, every scenario has a stop loss level, don't expect too much from forcing and letting loose stop loss orders in this non-agricultural news for orders. buy. According to my experience, today or before news of gold release, there will be a strong sale, good luck to traders.
Please see updates for other ideas as well.

lower high retest near recent lower high. 1,780Waiting for price to rise to point labelled D , and lower high signal to confirm a continuation of a bearish trend. Also waiting for price to complete a three to four days of rise, from Friday's low and therefore waiting for a bearish signal below and above 1.78055 and with possible stop hunt since its NFP week and anything however above 1.78200 and trend bullish or bullish spike candle could be a sign that the my expected analysis failed

USD/CHF - Bearish Reversal Anticipated from Key Resistance LevelThe USD/CHF currency pair currently exhibits a Bearish Butterfly Harmonic Pattern. This pattern is significant as it is forming at a key resistance area, indicating a potential reversal in price action. The pattern's completion point, identified as Point D, aligns with a 61.8% Fibonacci retracement level, further reinforcing the likelihood of a bearish movement.
Potential Reversal Zone (PRZ):
Point D, also known as the Potential Reversal Zone (PRZ), is the critical area where we anticipate a reversal from the current uptrend. At this point, the confluence of the Bearish Butterfly Harmonic Pattern and the 61.8% Fibonacci level strengthens the probability of a significant bearish reversal.
Entry, Stop Loss, and Take Profit Levels:
To capitalize on the anticipated bearish movement, we recommend entering a short position at 0.90055. To manage risk effectively, a stop loss should be placed at 0.90175, slightly above the PRZ to allow for minor price fluctuations without triggering an early exit.
Take Profit Targets:
We have identified three take profit levels to gradually secure profits as the price moves in the anticipated bearish direction:
TP-1: 0.89935
TP-2: 0.89815
TP-3: 0.89695
These take-profit levels are strategically placed to capture gains at significant price points, providing a structured exit strategy to maximize profitability while managing risk.
Conclusion:
The formation of a Bearish Butterfly Harmonic Pattern at a key resistance area, coupled with the alignment of the 61.8% Fibonacci retracement level, suggests a high probability of a bearish reversal in the USD/CHF currency pair. By entering at 0.90055 with a stop loss at 0.90175 and targeting the specified take-profit levels, traders can effectively benefit from the expected downward movement.
Disclaimer:
This technical analysis report is provided for informational purposes only and should not be construed as financial advice. Traders are encouraged to conduct their own research and consider their risk tolerance before entering any trades.

XAGUSD 15mins - Butterfly Emerging : 44 minutes agoButterfly Fibonacci pattern identified at 6/19 11:45.
This pattern is still in the process of forming.
Possible bearish price movement towards target levels
ranging from 29.55 to 29.27 within the next 2 hours.
Expiry Date/Time: 6/19 14:16

DXY NEXT UPDATE
AronnoFX will not accept any liability for loss or damage as a result of
reliance on the information contained within this channel including
data, quotes, charts and buy/sell signals.
If you like this idea, do not forget to support with a like and follow.
Traders, if you like this idea or have your own opinion, please feel free command me.

📈Fetch AI can go high to $20 level / Alt Season rally📉BINANCE:FETUSDT
COINBASE:FETUSD
Hello traders.
Fetch AI is my Second suggestion for the altcoin market.
As you can see, the price has broken its long-term pitch-fork structure. As long as the price rally is ongoing outside the pitchfork, the $6.4 and $9 targets are active.🎯
Considering the previous price rally, there is a possibility of a price correction to the middle levels of the pitchfork (dynamic and then static supports).🧨
The best strategy for altcoins is to allocate a certain percentage of assets (for example, 10% of the total portfolio) to buy potential altcoins.🎲
In the following week, I will introduce and complete the list of my suggested altcoins.
I plan to monitor these altcoins weekly.

EURUSD: Bearish Butterfly Pattern Signals ReversalThe EURUSD pair is currently forming a Bearish Butterfly Harmonic Pattern (XABCD), a classic reversal structure frequently observed in technical analysis. The Butterfly Pattern suggests that the current bullish momentum may soon exhaust, giving way to a potential bearish trend.
Potential Reversal Zone (PRZ):
Point D, at the completion of the Butterfly pattern, is identified as a Potential Reversal Zone (PRZ). This zone is critically important for several reasons:
Key Resistance Area: The PRZ aligns with a significant resistance level, historically indicating strong selling pressure.
4-Hour Trend Line: The zone coincides with a downward sloping trend line on the 4-hour chart, reinforcing the bearish outlook.
61.8% Fibonacci Retracement: The PRZ is also at the 61.8% Fibonacci retracement level of the preceding move, adding another layer of confluence to our bearish bias.
Entry and Risk Management:
Given the confluence of technical indicators at the PRZ, we anticipate a trend reversal to bearish from Point D. Our proposed trading strategy is as follows:
Entry Point: 1.08865
Stop Loss: 1.09030
The stop loss is strategically placed above the PRZ to protect against potential false breakouts and limit downside risk.
Take Profit Levels:
To effectively manage our positions and lock in profits, we have set multiple take profit levels:
TP-1: 1.08700
TP-2: 1.08535
TP-3: 1.08370
These targets are derived from previous support levels and the harmonic pattern projections.
Conclusion:
The confluence of the Bearish Butterfly pattern, key resistance, trend line, and Fibonacci level significantly strengthens the bearish case for EURUSD at Point D. By entering the market at 1.08865 with a stop loss at 1.09030, and targeting the specified take profit levels, traders can capitalize on the anticipated bearish reversal while maintaining disciplined risk management.

Bearish Reversal Insight AUDCAD Technical Analysis & Trade SetupThe AUDCAD currency pair is currently forming a Bearish Butterfly Harmonic Pattern (XABCD), indicating a potential bearish reversal. Point D, the Potential Reversal Zone (PRZ), is aligned with a key resistance area and intersects a daily trend line, providing a strong confluence for a bearish bias.
Potential Reversal Zone (PRZ) and Key Resistance:
Point D is identified as a critical area where the price is likely to reverse. This zone is reinforced by a key resistance level, adding validity to the bearish outlook. The intersection with the daily trend line further strengthens the likelihood of a trend reversal from this point.
Entry Strategy:
To capitalize on the expected trend reversal, the entry should be made at the breakout of the support level near 0.90450. This level is crucial as a confirmed breakout here would signal the start of a bearish trend.
Stop Loss Placement:
A stop loss should be placed above the resistance level at 0.91400. This placement ensures protection against potential false breakouts and market volatility.
Take Profit Targets:
The take profit targets for this trade are as follows:
TP-1: 0.89500
TP-2: 0.88550
TP-3: 0.87600
These targets are strategically set at significant support levels to maximize gains while managing risk effectively.
Conclusion:
The formation of the Bearish Butterfly Harmonic Pattern, combined with the confluence of the PRZ, key resistance area, and daily trend line, presents a compelling bearish setup for AUDCAD. By entering at the support breakout, setting a prudent stop loss, and targeting key support levels, this trade offers a favorable risk-reward profile for traders.
