Butterlfly
Bullish Butterfly on support areaI setup my support area on a hourly chart. As the price reach the support area I noticed thanks to the RSI that the currency was oversold. On top of that I saw a nice bullish butterfly forming. I went long at 0.76332, set my S/L just below my support area and my T/P just above the pivot point. I'll take another look at what the price is doing in a few hours and might raise my T/P and S/L accordingly
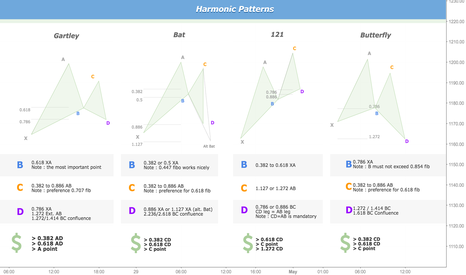
Harmonic Patterns ratio and examplesHi,
Above, some harmonic patterns that i often look for (bullish ones)
These patterns, when identified, have a good risk/reward ratio. They allow traders to enter into the market with minimal risk. Obviously, you need some other confirmations before taking the trade on the pattern completion.
If the point D occurs with some divergence on classic oscillators (RSI / Macd, Sto), on a bottom (or top, if pattern is bearish) of a trendline / channel, previous support/resistance levels, supply/demand zone...then there are good probabilities to see price react on the completion of the pattern.
There are plenty of patterns, but this selection, from my side, is a good start for those who want to learn harmonic pattern.
Below some examples that have worked nicely (this don't work each time, this would be too easy ;)
Earnings pushed Amazon to complete bearish ButterflyLast week, AMAZON's earnings resulted with a huge rally, exploding $AMZN into the PRZ of a bearish Butterfly I've been monitoring.
My pre-earnings setup was bullish with anticipation that the price will complete the pattern and create a bearish opportunity I've been waiting for since August's low.
The first target of this setup is 550-560$. The top of the broadening weekly pattern.
Then.. if $AMZN will decline lower, it'll pave the way to deeper retracement levels like 500$ and 450$ and it will create a weekly False Breakout to the weekly pattern
Tomer, themarketzone.net
This analysis is part of the Weekly Markets Analysis newsletters
To read more interesting technical reviews - goo.gl
To subscribe to the newsletters - goo.gl


