NZDJPY Will Go Up From Support! Buy!
Please, check our technical outlook for NZDJPY.
Time Frame: 1h
Current Trend: Bullish
Sentiment: Oversold (based on 7-period RSI)
Forecast: Bullish
The price is testing a key support 85.439.
Current market trend & oversold RSI makes me think that buyers will push the price. I will anticipate a bullish movement at least to 85.706 level.
P.S
We determine oversold/overbought condition with RSI indicator.
When it drops below 30 - the market is considered to be oversold.
When it bounces above 70 - the market is considered to be overbought.
Disclosure: I am part of Trade Nation's Influencer program and receive a monthly fee for using their TradingView charts in my analysis.
Like and subscribe and comment my ideas if you enjoy them!
Buy!!

NZD/CAD BUYERS WILL DOMINATE THE MARKET|LONG
Hello, Friends!
NZD-CAD downtrend evident from the last 1W red candle makes longs trades more risky, but the current set-up targeting 0.827 area still presents a good opportunity for us to buy the pair because the support line is nearby and the BB lower band is close which indicates the oversold state of the NZD/CAD pair.
Disclosure: I am part of Trade Nation's Influencer program and receive a monthly fee for using their TradingView charts in my analysis.
✅LIKE AND COMMENT MY IDEAS✅

XAUUSD – Is the “Death Triangle” About to Break Down?Hey everyone, looking at the 8H chart, we can see that gold is tightening inside a narrow triangle – a sign of both consolidation and a potential major breakout coming soon. However, what's worth noting is that the price structure leans toward a bearish breakout, as gold continues to form lower highs and gets repeatedly rejected around the $3,250 resistance zone – which also aligns with the upper edge of the triangle.
Below, the long-term ascending support line is under significant pressure. If sellers maintain control and push the price below this trendline, the next potential target could be the $3,080 zone – aligning with the most recent swing low and acting as a possible support area.
Summary:
The $3,250 zone is the “checkpoint” to watch for selling pressure. If the price fails to break above this level, the downtrend is likely to continue.
The lower edge of the triangle is the “lifeline” for buyers. If it breaks, the likelihood of a deeper drop increases significantly.
What’s your take on this setup? Let’s share our views and spot the best trading opportunities together!

Is Gold About to Enter a Sharp Downtrend?Hey traders, looking at the chart, it’s quite clear that gold is currently undergoing a clean technical pullback – with the main objective being to fill the GAP around the $3,200 zone. This area is a strong confluence with the EMA34, and also marks a level where decisive selling pressure was previously observed.
Technically speaking, the overall structure remains bearish. Gold is still neatly confined within the descending channel, and recent rebounds appear to be nothing more than setups for sellers to "reload." The EMA34–EMA89 continue to serve effectively as dynamic resistance, and price action is already showing signs of fading bullish momentum as it approaches this key barrier.
The market is also responding to growing concerns over new U.S. tax policies, combined with a waning sense of defensive positioning. From my observations and feedback from various sources, the general sentiment leans toward gold continuing to weaken in the short term – not because of any sudden shock, but due to a lack of compelling bullish catalysts.

US30 Breakdown May 19thWhy shouldn't you write with a broken pen? Because it's pointless. Just like your life if you don't stay focused on your purpose. Ok let's get to work!
Price is on a beautiful uptrend and right now it's on a retracement down to 42650 area. I believe price will continue to push up to the 42870 Level.
How I'll enter
I am going to wait for price to get down to the 42650 level
Wait for a break of structure as confirmation for a buy (on a 1min)
Then Buy
But like my ex, price does whatever it wants, so be careful and always wait for a break and retest or a break of structure near the key areas.
Have fun. And trade responsibly

BITCOIN Will Go Higher! Long!
Here is our detailed technical review for BITCOIN.
Time Frame: 1D
Current Trend: Bullish
Sentiment: Oversold (based on 7-period RSI)
Forecast: Bullish
The market is trading around a solid horizontal structure 102,856.61.
The above observations make me that the market will inevitably achieve 117,574.76 level.
P.S
Overbought describes a period of time where there has been a significant and consistent upward move in price over a period of time without much pullback.
Disclosure: I am part of Trade Nation's Influencer program and receive a monthly fee for using their TradingView charts in my analysis.
Like and subscribe and comment my ideas if you enjoy them!

USDJPY Will Go Up! Buy!
Take a look at our analysis for USDJPY.
Time Frame: 2h
Current Trend: Bullish
Sentiment: Oversold (based on 7-period RSI)
Forecast: Bullish
The market is testing a major horizontal structure 144.899.
Taking into consideration the structure & trend analysis, I believe that the market will reach 146.054 level soon.
P.S
Please, note that an oversold/overbought condition can last for a long time, and therefore being oversold/overbought doesn't mean a price rally will come soon, or at all.
Disclosure: I am part of Trade Nation's Influencer program and receive a monthly fee for using their TradingView charts in my analysis.
Like and subscribe and comment my ideas if you enjoy them!

GBPCAD Is Bullish! Long!
Here is our detailed technical review for GBPCAD.
Time Frame: 1D
Current Trend: Bullish
Sentiment: Oversold (based on 7-period RSI)
Forecast: Bullish
The market is approaching a significant support area 1.865.
The underlined horizontal cluster clearly indicates a highly probable bullish movement with target 1.902 level.
P.S
We determine oversold/overbought condition with RSI indicator.
When it drops below 30 - the market is considered to be oversold.
When it bounces above 70 - the market is considered to be overbought.
Disclosure: I am part of Trade Nation's Influencer program and receive a monthly fee for using their TradingView charts in my analysis.
Like and subscribe and comment my ideas if you enjoy them!

AUDUSD Is Very Bullish! Buy!
Take a look at our analysis for AUDUSD.
Time Frame: 30m
Current Trend: Bullish
Sentiment: Oversold (based on 7-period RSI)
Forecast: Bullish
The market is on a crucial zone of demand 0.640.
The oversold market condition in a combination with key structure gives us a relatively strong bullish signal with goal 0.641 level.
P.S
We determine oversold/overbought condition with RSI indicator.
When it drops below 30 - the market is considered to be oversold.
When it bounces above 70 - the market is considered to be overbought.
Disclosure: I am part of Trade Nation's Influencer program and receive a monthly fee for using their TradingView charts in my analysis.
Like and subscribe and comment my ideas if you enjoy them!

EURUSD Is Going Up! Long!
Please, check our technical outlook for EURUSD.
Time Frame: 1h
Current Trend: Bullish
Sentiment: Oversold (based on 7-period RSI)
Forecast: Bullish
The price is testing a key support 1.116.
Current market trend & oversold RSI makes me think that buyers will push the price. I will anticipate a bullish movement at least to 1.118 level.
P.S
Please, note that an oversold/overbought condition can last for a long time, and therefore being oversold/overbought doesn't mean a price rally will come soon, or at all.
Disclosure: I am part of Trade Nation's Influencer program and receive a monthly fee for using their TradingView charts in my analysis.
Like and subscribe and comment my ideas if you enjoy them!

GBP/USD BUYERS WILL DOMINATE THE MARKET|LONG
GBP/USD SIGNAL
Trade Direction: long
Entry Level: 1.316
Target Level: 1.338
Stop Loss: 1.302
RISK PROFILE
Risk level: medium
Suggested risk: 1%
Timeframe: 12h
Disclosure: I am part of Trade Nation's Influencer program and receive a monthly fee for using their TradingView charts in my analysis.
✅LIKE AND COMMENT MY IDEAS✅

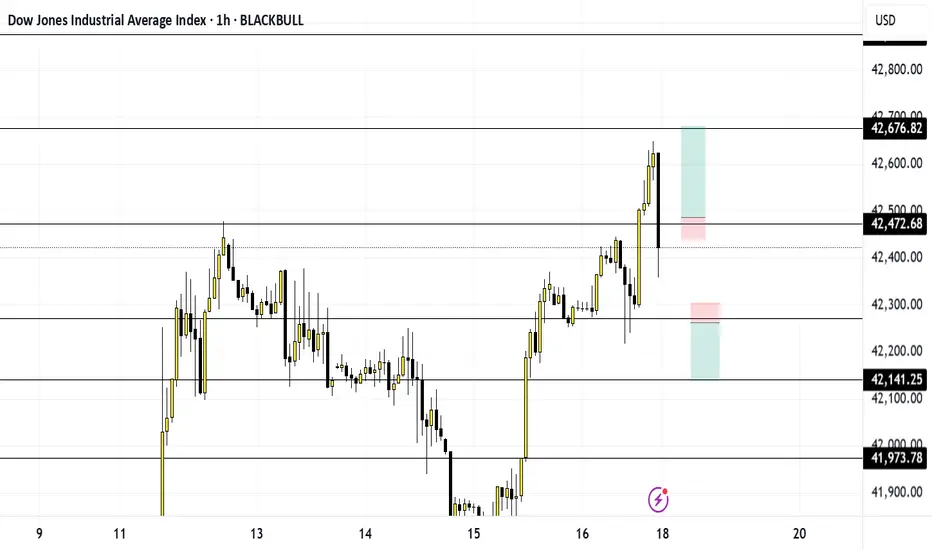
US30 Markup May 18thWhat did the tomato say to the other tomato during a race? Ketchup!! Now lets ketchup on these charts.
Price is in an uptrend and is nearing my key level 42,474. If price breaks and retests that area, then I will get in for the buy and buy up to 42,672 area.
However, like a puppy, price does whatever it wants. So, if price breaks structure around 42,268, I shall wait for price to break and retest that area so I can get in for the sell down to 42,141.
I shall be waiting for the break and retest on the one-minute timeframe for both the buy or sell.
Lastly, enjoy yourself, and be responsible.
doge buylimit midterm"🌟 Welcome to Golden Candle! 🌟
We're a team of 📈 passionate traders 📉 who love sharing our 🔍 technical analysis insights 🔎 with the TradingView community. 🌎
Our goal is to provide 💡 valuable perspectives 💡 on market trends and patterns, but 🚫 please note that our analyses are not intended as buy or sell recommendations. 🚫
Instead, they reflect our own 💭 personal attitudes and thoughts. 💭
Follow along and 📚 learn 📚 from our analyses! 📊💡"

US30 Is Very Bullish! Buy!
Take a look at our analysis for US30.
Time Frame: 1D
Current Trend: Bullish
Sentiment: Oversold (based on 7-period RSI)
Forecast: Bullish
The market is on a crucial zone of demand 42,620.8.
The oversold market condition in a combination with key structure gives us a relatively strong bullish signal with goal 45,530.9 level.
P.S
Overbought describes a period of time where there has been a significant and consistent upward move in price over a period of time without much pullback.
Disclosure: I am part of Trade Nation's Influencer program and receive a monthly fee for using their TradingView charts in my analysis.
Like and subscribe and comment my ideas if you enjoy them!

eth buy midterm"🌟 Welcome to Golden Candle! 🌟
We're a team of 📈 passionate traders 📉 who love sharing our 🔍 technical analysis insights 🔎 with the TradingView community. 🌎
Our goal is to provide 💡 valuable perspectives 💡 on market trends and patterns, but 🚫 please note that our analyses are not intended as buy or sell recommendations. 🚫
Instead, they reflect our own 💭 personal attitudes and thoughts. 💭
Follow along and 📚 learn 📚 from our analyses! 📊💡"

ETHUSD Is Bullish! Long!
Here is our detailed technical review for ETHUSD.
Time Frame: 9h
Current Trend: Bullish
Sentiment: Oversold (based on 7-period RSI)
Forecast: Bullish
The market is approaching a significant support area 2,593.04.
The underlined horizontal cluster clearly indicates a highly probable bullish movement with target 2,920.18 level.
P.S
The term oversold refers to a condition where an asset has traded lower in price and has the potential for a price bounce.
Overbought refers to market scenarios where the instrument is traded considerably higher than its fair value. Overvaluation is caused by market sentiments when there is positive news.
Disclosure: I am part of Trade Nation's Influencer program and receive a monthly fee for using their TradingView charts in my analysis.
Like and subscribe and comment my ideas if you enjoy them!

EURCHF Is Going Up! Long!
Please, check our technical outlook for EURCHF.
Time Frame: 15m
Current Trend: Bullish
Sentiment: Oversold (based on 7-period RSI)
Forecast: Bullish
The price is testing a key support 0.934.
Current market trend & oversold RSI makes me think that buyers will push the price. I will anticipate a bullish movement at least to 0.936 level.
P.S
Overbought describes a period of time where there has been a significant and consistent upward move in price over a period of time without much pullback.
Disclosure: I am part of Trade Nation's Influencer program and receive a monthly fee for using their TradingView charts in my analysis.
Like and subscribe and comment my ideas if you enjoy them!

GBP/NZD BULLISH BIAS RIGHT NOW| LONG
Hello, Friends!
Previous week’s red candle means that for us the GBP/NZD pair is in the downtrend. And the current movement leg was also down but the support line will be hit soon and lower BB band proximity will signal an oversold condition so we will go for a counter-trend long trade with the target being at 2.259.
Disclosure: I am part of Trade Nation's Influencer program and receive a monthly fee for using their TradingView charts in my analysis.
✅LIKE AND COMMENT MY IDEAS✅

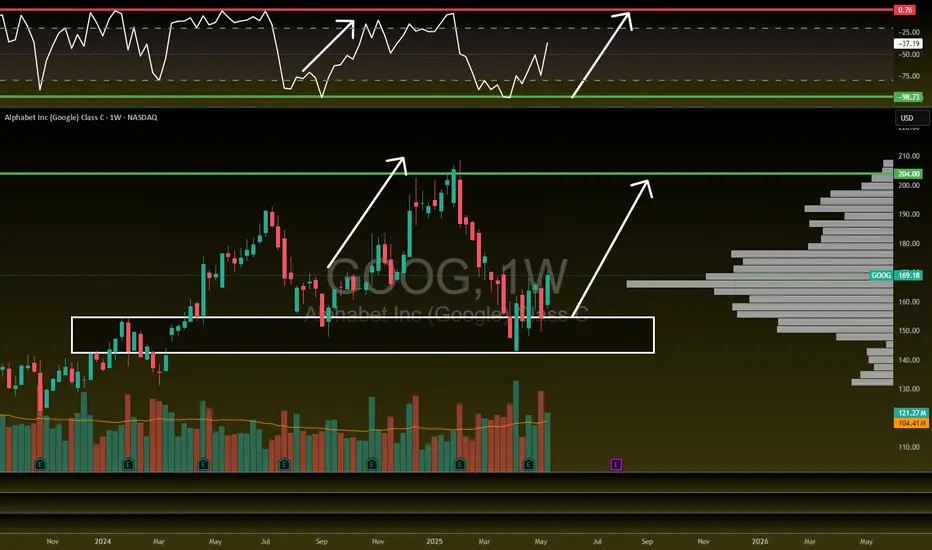
Google to $200!NASDAQ:GOOG NASDAQ:GOOGL
We are uptrending back to ATHs on Google here after they have lagged this whole rally and are the CHEAPEST MAG 7 STOCK!
- Volume shelf launch
- Rising Wr%
- Bouncing off key S/R zone
- H5 Indicator is about to flip to green and make a bullish cross
- Volume is climbing
- Bullish engulfing candle
- Daily looks great as well
Target is $200
GOLD Will Grow! Buy!
Here is our detailed technical review for GOLD.
Time Frame: 2h
Current Trend: Bullish
Sentiment: Oversold (based on 7-period RSI)
Forecast: Bullish
The market is trading around a solid horizontal structure 3,202.52.
The above observations make me that the market will inevitably achieve 3,258.41 level.
P.S
Please, note that an oversold/overbought condition can last for a long time, and therefore being oversold/overbought doesn't mean a price rally will come soon, or at all.
Disclosure: I am part of Trade Nation's Influencer program and receive a monthly fee for using their TradingView charts in my analysis.
Like and subscribe and comment my ideas if you enjoy them!

AUDJPY Will Go Up From Support! Long!
Please, check our technical outlook for AUDJPY.
Time Frame: 12h
Current Trend: Bullish
Sentiment: Oversold (based on 7-period RSI)
Forecast: Bullish
The market is approaching a key horizontal level 93.383.
Considering the today's price action, probabilities will be high to see a movement to 96.039.
P.S
We determine oversold/overbought condition with RSI indicator.
When it drops below 30 - the market is considered to be oversold.
When it bounces above 70 - the market is considered to be overbought.
Disclosure: I am part of Trade Nation's Influencer program and receive a monthly fee for using their TradingView charts in my analysis.
Like and subscribe and comment my ideas if you enjoy them!

AUDCHF Will Go Higher! Buy!
Here is our detailed technical review for AUDCHF.
Time Frame: 12h
Current Trend: Bullish
Sentiment: Oversold (based on 7-period RSI)
Forecast: Bullish
The market is approaching a significant support area 0.536.
The underlined horizontal cluster clearly indicates a highly probable bullish movement with target 0.548 level.
P.S
Overbought describes a period of time where there has been a significant and consistent upward move in price over a period of time without much pullback.
Disclosure: I am part of Trade Nation's Influencer program and receive a monthly fee for using their TradingView charts in my analysis.
Like and subscribe and comment my ideas if you enjoy them!

DXY Bullish Rebound Expected! Buy!
Hello,Traders!
DXY is making a local
Bearish correction towards
The horizontal support level
Around 100.200 but we are
Locally bullish biased so
After the retest we will be
Expecting a local bullish rebound
Buy!
Comment and subscribe to help us grow!
Check out other forecasts below too!
Disclosure: I am part of Trade Nation's Influencer program and receive a monthly fee for using their TradingView charts in my analysis.
