GOLD BULLS WILL DOMINATE THE MARKET|LONG
GOLD SIGNAL
Trade Direction: long
Entry Level: 3,281.65
Target Level: 3,346.60
Stop Loss: 3,238.35
RISK PROFILE
Risk level: medium
Suggested risk: 1%
Timeframe: 2h
Disclosure: I am part of Trade Nation's Influencer program and receive a monthly fee for using their TradingView charts in my analysis.
✅LIKE AND COMMENT MY IDEAS✅
Buy!!

Gold falls below $3,300International gold prices are currently trading around $3,290/ounce, down $40 from last week and far from the record high of $3,500. The bearish structure still prevails as gold is below the EMA34 and EMA89, while failing many times to regain the $3,300 mark.
Strong profit-taking pressure, a recovering USD and rising bond yields are dragging gold prices down, despite the previous optimistic expectations from the Kitco survey. If gold continues to weaken below $3,300, it could head towards $3,250, deeper into the $3,200–$3,220 range. Conversely, only when it surpasses $3,320 will the downtrend be challenged.
Short-term strategy: Prioritize selling when gold recovers weakly.

GBPNZD Will Go Higher From Support! Buy!
Here is our detailed technical review for GBPNZD.
Time Frame: 1D
Current Trend: Bullish
Sentiment: Oversold (based on 7-period RSI)
Forecast: Bullish
The market is approaching a significant support area 2.241.
The underlined horizontal cluster clearly indicates a highly probable bullish movement with target 2.283 level.
P.S
The term oversold refers to a condition where an asset has traded lower in price and has the potential for a price bounce.
Overbought refers to market scenarios where the instrument is traded considerably higher than its fair value. Overvaluation is caused by market sentiments when there is positive news.
Disclosure: I am part of Trade Nation's Influencer program and receive a monthly fee for using their TradingView charts in my analysis.
Like and subscribe and comment my ideas if you enjoy them!

Two Bullish Scenarios to Watch on ETHUSDTThis week, BINANCE:ETHUSDT has shown a significant upward movement, and there's a good chance it could continue its bullish momentum.
There are two bullish scenarios developing on BINANCE:ETHUSDT :
1. After a pullback, we could see an impulsive move that breaks the previous high (marked with the red arrow) and pushes the price towards the first target at 1,911 – 1,957.
2. The price could move sideways for a while, forming a bullish pennant pattern. In this case, a correction towards 1,756 – 1,731 might occur before the price resumes its move to the first target at 1,911 – 1,957.
Both scenarios remain valid as long as the price holds above 1,722.
If the second scenario plays out, the pullback to 1,756 – 1,731 can be considered a good buy zone (for those who are not in position yet).
Remember: wait for a confirmation candle before entering and place your stop-loss just below the confirmation candle.

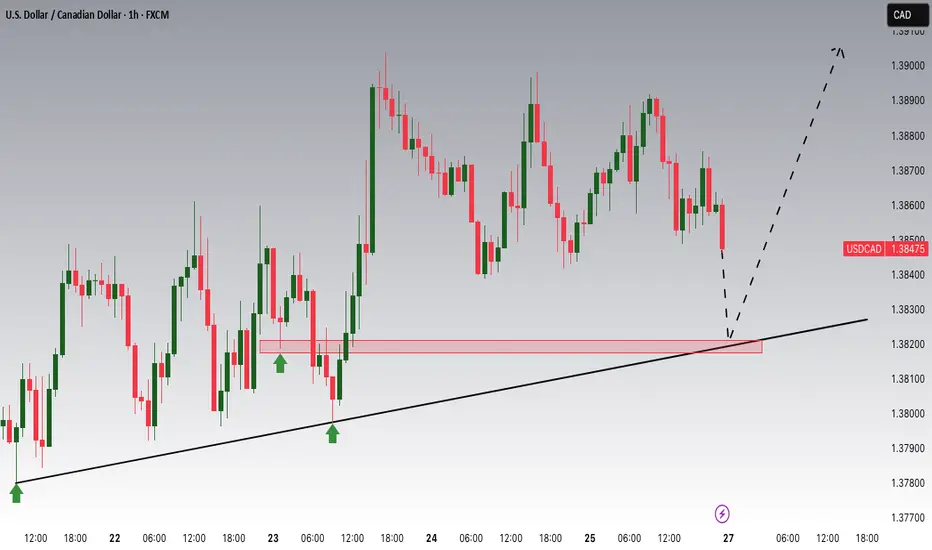
USDCAD Potential UpsidesHey Traders, in today's trading session we are monitoring USDCAD for a buying opportunity around 1.38200 zone, USDCAD is trading in an uptrend and currently is in a correction phase in which it is approaching the trend at 1.38200 support and resistance area.
Trade safe, Joe.
USDJPY: Bulls Eye Key Support as Trade Optimism Lifts DollarHey Traders, We are currently monitoring USDJPY for a potential buying opportunity as price approaches the 143.200 level, an important area that has acted as both support and resistance in recent sessions. Technically, the pair remains in a well-defined uptrend, and this pullback appears to be part of a healthy correction phase rather than a trend reversal. The 143.200 zone also aligns with a dynamic trendline support, increasing the likelihood of a bullish reaction if price holds above this level. From a fundamental perspective, recent developments have started to tilt in favor of the dollar. News of progress toward a trade agreement between the U.S. and India has sparked optimism, as it may lay the groundwork for similar deals with other key global partners. This has been compounded by unconfirmed reports out of China suggesting potential tariff exemptions in specific sectors, which has further boosted investor sentiment and triggered a broader “risk-on” shift in markets. As geopolitical tensions around trade show signs of easing, the U.S. dollar is regaining strength, fueling the case for further upside in USDJPY. Taken together, the convergence of technical support and improving macroeconomic signals presents a compelling opportunity for bulls, provided we see signs of price stability or a confirmed bounce near the 143.200 area.
Trade safe, Joe.

SILVER Will Go Up! Long!
Here is our detailed technical review for SILVER.
Time Frame: 9h
Current Trend: Bullish
Sentiment: Oversold (based on 7-period RSI)
Forecast: Bullish
The market is trading around a solid horizontal structure 3,308.7.
The above observations make me that the market will inevitably achieve 3,462.2 level.
P.S
Please, note that an oversold/overbought condition can last for a long time, and therefore being oversold/overbought doesn't mean a price rally will come soon, or at all.
Disclosure: I am part of Trade Nation's Influencer program and receive a monthly fee for using their TradingView charts in my analysis.
Like and subscribe and comment my ideas if you enjoy them!

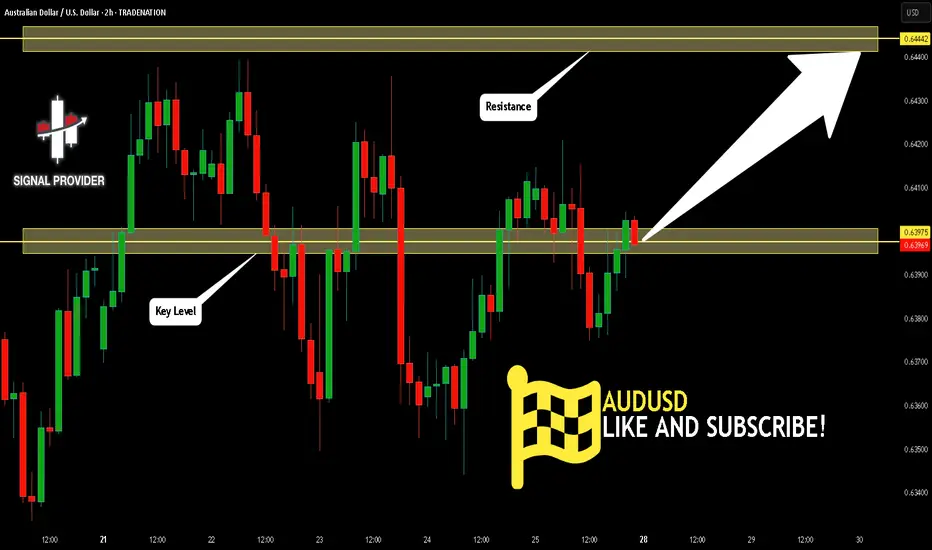
AUDUSD Will Move Higher! Buy!
Take a look at our analysis for AUDUSD.
Time Frame: 2h
Current Trend: Bullish
Sentiment: Oversold (based on 7-period RSI)
Forecast: Bullish
The market is testing a major horizontal structure 0.639.
Taking into consideration the structure & trend analysis, I believe that the market will reach 0.644 level soon.
P.S
The term oversold refers to a condition where an asset has traded lower in price and has the potential for a price bounce.
Overbought refers to market scenarios where the instrument is traded considerably higher than its fair value. Overvaluation is caused by market sentiments when there is positive news.
Disclosure: I am part of Trade Nation's Influencer program and receive a monthly fee for using their TradingView charts in my analysis.
Like and subscribe and comment my ideas if you enjoy them!
GBPUSD Will Grow! Long!
Please, check our technical outlook for GBPUSD.
Time Frame: 9h
Current Trend: Bullish
Sentiment: Oversold (based on 7-period RSI)
Forecast: Bullish
The price is testing a key support 1.329.
Current market trend & oversold RSI makes me think that buyers will push the price. I will anticipate a bullish movement at least to 1.342 level.
P.S
Overbought describes a period of time where there has been a significant and consistent upward move in price over a period of time without much pullback.
Disclosure: I am part of Trade Nation's Influencer program and receive a monthly fee for using their TradingView charts in my analysis.
Like and subscribe and comment my ideas if you enjoy them!

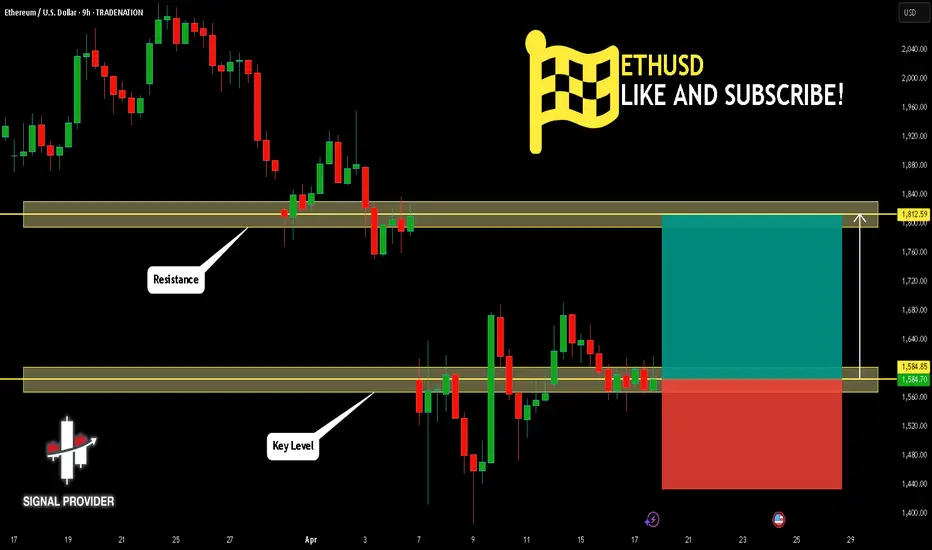
ETHUSD Will Go Higher! Buy!
Take a look at our analysis for ETHUSD.
Time Frame: 9h
Current Trend: Bullish
Sentiment: Oversold (based on 7-period RSI)
Forecast: Bullish
The market is testing a major horizontal structure 1,584.85.
Taking into consideration the structure & trend analysis, I believe that the market will reach 1,812.59 level soon.
P.S
The term oversold refers to a condition where an asset has traded lower in price and has the potential for a price bounce.
Overbought refers to market scenarios where the instrument is traded considerably higher than its fair value. Overvaluation is caused by market sentiments when there is positive news.
Disclosure: I am part of Trade Nation's Influencer program and receive a monthly fee for using their TradingView charts in my analysis.
Like and subscribe and comment my ideas if you enjoy them!
EURUSD Potential UpsidesHey Traders, in today's trading session we are monitoring EURUSD for a buying opportunity around 1.13400 zone, EURUSD is trading in an uptrend and currently is in a correction phase in which it is approaching the trend at 1.13400 support and resistance area.
Trade safe, Joe.

Ethereum Breakout and Potential RetraceHey Traders, in today's trading session we are monitoring ETHUSDT for a buying opportunity around 1620 zone, Ethereum was trading in a downtrend and successfully managed to break it out. Currently is in a correction phase in which it is approaching the retrace area at 1620 support and resistance zone.
Trade safe, Joe.

GBPUSD Potential UpsidesHey Traders, in today's trading session we are monitoring GBPUSD for a buying opportunity around 1.32600 zone, GBPUSD is trading in an uptrend and currently is in a correction phase in which it is approaching the trend at 1.32600 support and resistance area.
Trade safe, Joe.

USOIL Potential UpsidesHey Traders, in today's trading session we are monitoring USOIL for a buying opportunity around 60.80 zone, USOIL is trading in an uptrend and currently is in a correction phase in which it is approaching the trend at 60.80 support and resistance area.
Trade safe, Joe.

Gold forms a top patternOn the H4 chart, the gold price chart is forming a clear bearish structure after forming a three-peak pattern in a row around the $3,435–$3,470 range. Each time the price touches this range, it is strongly rejected, indicating that selling pressure controls the market. The fact that the price cannot maintain above the EMA34 and EMA9 at the same time is also a sign of confirmation of a weakening trend in the short term.
Although gold recovered slightly to the $3,365 range in the Asian session on April 25 thanks to news of PBOC money injection and a weakening USD, the buying pressure was not enough to break the bearish structure. The price quickly reversed and fell below the $3,300 mark, confirming the possibility of further correction in the near future.
Currently, the price has cut below the two EMAs and broken the nearest bottom at $3,290, triggering a bearish signal according to the “small head and shoulders” pattern on the H4. The next target is the strong support zone of $3,180–$3,220. If this zone is broken, the correction trend may extend deeper to the $3,100 area.
The appropriate short-term strategy at this time is to wait for the price to retrace to the $3,310–$3,330 area, cut losses above $3,350 and take profits around $3,200. The bullish scenario will only happen if the price breaks above $3,370 and closes above the old resistance – then the bearish structure will be broken.

GOLD SENDS CLEAR BULLISH SIGNALS|LONG
GOLD SIGNAL
Trade Direction: long
Entry Level: 3,299.27
Target Level: 3,358.08
Stop Loss: 3,259.94
RISK PROFILE
Risk level: medium
Suggested risk: 1%
Timeframe: 1h
Disclosure: I am part of Trade Nation's Influencer program and receive a monthly fee for using their TradingView charts in my analysis.
✅LIKE AND COMMENT MY IDEAS✅

USD/CHF BULLISH BIAS RIGHT NOW| LONG
Hello, Friends!
The BB lower band is nearby so USD/CHF is in the oversold territory. Thus, despite the downtrend on the 1W timeframe I think that we will see a bullish reaction from the support line below and a move up towards the target at around 0.814.
Disclosure: I am part of Trade Nation's Influencer program and receive a monthly fee for using their TradingView charts in my analysis.
✅LIKE AND COMMENT MY IDEAS✅

ATOMUSDT Potential UpsidesHey Traders, in today's trading session we are monitoring ATOMUSDT fora buying opportunity around 4.30 zone, ATOM is trading in an uptrend and currently is in a correction phase in which it is approaching the trend at 4.30 support and resistance area.
Trade safe, Joe.

LanzaTech (LNZA). Extremely oversold! Rally incoming?NASDAQ: LanzaTech (LNZA) , based in Illinois, USA, has recently has seen a price low of $0.1401 . This waste management company in recent times, has been featured as a top pick for buys by various news outlets. Although in an extremely bearish slump, I have a bullish prediction.
In the technicals on the 1 Day Chart , the RSI appears to be indicating oversold , with a slight potential of more of a dip to come. The Stochastic seems to also be indicating oversold market conditions. A long time frame bullish RSI divergence also appears to be forming starting at the middle of Feb 2023.
LanzaTech recently declined a "lowball" offer for $0.02 a share, which could signal insider bullish sentiment. LanzaTech FY25 Q1 earnings are forecasted to be significantly higher than FY24 Q4 at this time (RH). Their website, marketing and twitter appear to show no real signs of slowing business operations in my opinion.
Analysis also appears shows that there is very little open interest on put options at this time. Conversely there seems to be a large number of call options from $1-$7 expiring in the near future signaling institutions and high profile traders may be entering the market quietly.
Given the above signals and analysis I personally am setting a speculative stretch price target of $7 with various other orders taking profit along the way at key strike price cluster levels. With LanzaTech at a discounted price, a buy now could yield significant results.
Anything can happen in the markets. What do you think? Will LanzaTech recover? Or will value become completely wiped out?
Disclaimer: Not Financial Advice

Bullish momentum in $NOW! 22% Upside🔥 Bullish momentum in $NOW!
🚀 $1,126 on the horizon! 🎯
✅ Indicators curling upward
✅ Volume shelf ready to launch
✅ Wr% swinging green to red
✅ Great earning/ guidance
Big move loading—are you in? 👀
Not financial advice

$PLTR momentum is heating up - ATH's INBOUND!🔥 NASDAQ:PLTR momentum is heating up!
All-time highs on the horizon! 🎯
✅ Indicators curling bullish
✅ Volume Shelf ready to launch 🚀
✅ Wr% pendulum swinging in favor
Big move incoming—are you in? 👀
Not Financial Advice

ETHUSD Will Go Up From Support! Long!
Take a look at our analysis for ETHUSD.
Time Frame: 8h
Current Trend: Bullish
Sentiment: Oversold (based on 7-period RSI)
Forecast: Bullish
The market is testing a major horizontal structure 1,754.52.
Taking into consideration the structure & trend analysis, I believe that the market will reach 1,966.56 level soon.
P.S
Overbought describes a period of time where there has been a significant and consistent upward move in price over a period of time without much pullback.
Disclosure: I am part of Trade Nation's Influencer program and receive a monthly fee for using their TradingView charts in my analysis.
Like and subscribe and comment my ideas if you enjoy them!

DXY Is Bullish! Buy!
Please, check our technical outlook for DXY.
Time Frame: 15m
Current Trend: Bullish
Sentiment: Oversold (based on 7-period RSI)
Forecast: Bullish
The price is testing a key support 99.109.
Current market trend & oversold RSI makes me think that buyers will push the price. I will anticipate a bullish movement at least to 99.404 level.
P.S
Overbought describes a period of time where there has been a significant and consistent upward move in price over a period of time without much pullback.
Disclosure: I am part of Trade Nation's Influencer program and receive a monthly fee for using their TradingView charts in my analysis.
Like and subscribe and comment my ideas if you enjoy them!
