GOLD LONG FROM SUPPORT
GOLD SIGNAL
Trade Direction: long
Entry Level: 3,281.17
Target Level: 3,348.67
Stop Loss: 3,236.17
RISK PROFILE
Risk level: medium
Suggested risk: 1%
Timeframe: 7h
Disclosure: I am part of Trade Nation's Influencer program and receive a monthly fee for using their TradingView charts in my analysis.
✅LIKE AND COMMENT MY IDEAS✅
Buy!!

XAUUSD – Pressure becoming evident at higher price levelsAfter an impressive recovery streak, gold may soon have a chance to approach the 3,404 resistance zone – the top of the current ascending channel. This is not only the upper boundary of the technical structure but also an area where price has been rejected multiple times before, making it a likely profit-taking point or a trigger for renewed selling pressure.
In addition, the newly released U.S. PMI data exceeded expectations, signaling that manufacturing activity is recovering well. This has prompted the market to reassess expectations for Fed policy easing – pushing up both bond yields and the USD, while gold – which yields no interest – is facing pressure.
If buyers fail to produce a clear candle close above the 3,404 zone, a pullback scenario toward the 3,324 support area becomes highly plausible. This will be a “strength-testing” zone for both sides in the upcoming sessions.

USDJPY Will Grow! Long!
Here is our detailed technical review for USDJPY.
Time Frame: 8h
Current Trend: Bullish
Sentiment: Oversold (based on 7-period RSI)
Forecast: Bullish
The market is trading around a solid horizontal structure 144.062.
The above observations make me that the market will inevitably achieve 145.457 level.
P.S
We determine oversold/overbought condition with RSI indicator.
When it drops below 30 - the market is considered to be oversold.
When it bounces above 70 - the market is considered to be overbought.
Disclosure: I am part of Trade Nation's Influencer program and receive a monthly fee for using their TradingView charts in my analysis.
Like and subscribe and comment my ideas if you enjoy them!

EURUSD Possible AnalysisEURUSD has been overall bullish with retracemets here and there. It has recently made a deep retracement that could be mistaken for a shift in market structure, while in reality it's just liquidity accumulation. Price recently shifted structure back to bullish on 4h timeframe where it preceded to break more structure before retracing to sweep liquidity below a low and tap a fvg in the process. It preceded to shift structure on the 1h time frame, breaking with a huge bullish candle symbolizing increase in bullish momentum. It is currently retracing towards an orderblock that was responsible for the break and could possibly retest it and fill the imbalance above it before it continues its bullish move up to take out the latest weak high.

MOONPIG Is Taking Off — Thanks to James Wynn’s Viral CloutThe James Wynn Phenomenon:
James Wynn, a crypto trader who turned $4 million into $100 million before losing nearly all of it in leveraged Bitcoin futures, has become a polarizing figure in the crypto space. His massive trades, including a $1.2 billion Bitcoin long position that ended in a $17.5 million loss and a subsequent $1 billion short position with 40x leverage, have made him a viral sensation. Despite these setbacks, Wynn’s resilience and bold moves keep him in the spotlight, with thousands of traders and investors following his every step.
Wynn’s fame stems not just from his trading but from his ability to move markets. His posts on X, where he boasts a significant following, often trigger rapid price movements in the assets he mentions. This influence is now centered on $MOONPIG, a Solana-based meme coin that’s gaining traction thanks to his vocal support.
$MOONPIG: A Meme Coin with Momentum:
$MOONPIG, a meme coin built on the Solana blockchain, has seen its price surge by as much as 80% following Wynn’s endorsements, though it’s also faced volatility with a 30% drop in 24 hours and a 60% decline from its all-time high. Despite these fluctuations, the coin’s community-driven narrative and Wynn’s backing make it a compelling speculative play.
Wynn’s posts on X reveal his belief in $MOONPIG’s potential to be the “next SafeMoon” of this cycle, predicting a run to a billion-dollar market cap. He’s emphasized its appeal to retail investors, calling it “normie-friendly” and highlighting its strong community as a key driver. This narrative aligns with the meme coin mania that often propels tokens like CRYPTOCAP:DOGE or CRYPTOCAP:SHIB to explosive gains during bullish market phases.
Why I’m Bullish:
Wynn’s Influence as a Catalyst: Wynn’s fame amplifies $MOONPIG’s visibility. His posts on X, such as one claiming he transferred profits to the $MOONPIG reserves wallet, signal commitment and attract attention. When Wynn speaks, traders listen, and his endorsements have already driven significant price action, with one instance sparking an 80% surge.
Community Strength: Wynn has emphasized $MOONPIG’s community-driven ethos, stating it “doesn’t need KOLs or BS” and thrives on organic support. In the meme coin space, strong communities can sustain momentum, as seen with tokens like CRYPTOCAP:PEPE , which Wynn also supports.
Market Timing: With Bitcoin hitting new highs and retail interest flooding back into crypto, $MOONPIG is well-positioned to ride the wave. Wynn’s thesis that retail investors will soon pour into altcoins aligns with current market sentiment, making $MOONPIG a potential beneficiary.
Speculative Upside: Meme coins thrive on hype, and $MOONPIG’s low market cap relative to its potential—analysts like @KookCapitalLLC
speculate a $1 billion valuation—offers significant upside for early investors. Even after recent pullbacks, the coin’s volatility suggests opportunities for traders who can stomach the risk.

USDCHF Will Go Up From Support! Long!
Please, check our technical outlook for USDCHF.
Time Frame: 2h
Current Trend: Bullish
Sentiment: Oversold (based on 7-period RSI)
Forecast: Bullish
The market is approaching a key horizontal level 0.822.
Considering the today's price action, probabilities will be high to see a movement to 0.826.
P.S
Please, note that an oversold/overbought condition can last for a long time, and therefore being oversold/overbought doesn't mean a price rally will come soon, or at all.
Disclosure: I am part of Trade Nation's Influencer program and receive a monthly fee for using their TradingView charts in my analysis.
Like and subscribe and comment my ideas if you enjoy them!

BITCOIN BULLS WILL DOMINATE THE MARKET|LONG
BITCOIN SIGNAL
Trade Direction: long
Entry Level: 104,686.94
Target Level: 111,091.02
Stop Loss: 100,407.14
RISK PROFILE
Risk level: medium
Suggested risk: 1%
Timeframe: 9h
Disclosure: I am part of Trade Nation's Influencer program and receive a monthly fee for using their TradingView charts in my analysis.
✅LIKE AND COMMENT MY IDEAS✅

EURUSD – Ready to Break the Psychological CeilingOn the D1 chart, EURUSD is maintaining a stable uptrend structure with higher lows and a well-respected trendline. Buying pressure continues to emerge around the EMA 34 support zone, indicating that the bulls remain in control.
Currently, price is approaching the psychological resistance level at 1.16420 – an area that has rejected price multiple times in the past. However, a potential breakout pattern is forming: if the price can close decisively above this zone, the next target could extend to 1.17750.
While waiting for a breakout confirmation, traders can watch for minor pullbacks toward the trendline or EMA to find entries aligned with the trend. The overall momentum still favors the buyers, as long as the 1.13490 level holds.

XAUUSD – Sideway breakout loomsOn the daily timeframe (D1), gold is still stuck in a wide sideway range between 3,105 and 3,451, which has persisted since early April. However, recent price action suggests the structure is gradually tilting toward a bearish bias.
The rebounds from the current range bottom are weakening, with each successive peak failing to surpass the previous one. Moreover, the EMA 34 is being tested repeatedly — indicating that buyers are losing momentum.
If the price breaks below the support area around 3,258–3,260 (which aligns with the EMA 34), the next target could be the 3,105 zone. And if this level also fails to hold, a deeper drop toward 2,976 may be triggered.

XAUUSD – Facing headwinds from inflation expectationsHey everyone, we’ve got quite an interesting setup on gold today!
As shown on the chart, XAUUSD is still moving within a clearly defined descending channel. After bouncing from the lower support area around 3,262, price is now retesting the upper boundary of the channel. What’s more important is that this area overlaps with both the 34 and 89 EMAs – creating a strong confluence of resistance.
If price continues to be rejected here, there’s a high chance that gold will reverse and head back toward the bottom of the channel. A likely target could be around 3,232.
As for the news: Core PCE – the Fed’s preferred inflation gauge – is expected to rise. This has led the market to anticipate that the Fed might keep interest rates higher for longer. And when bond yields rise and the USD strengthens, gold – a non-yielding asset – tends to lose its appeal.

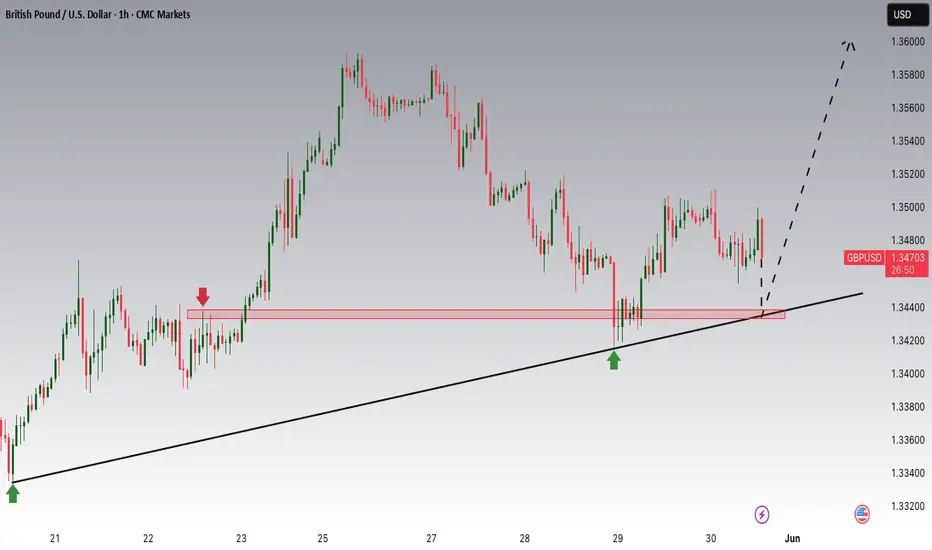
GBPUSD is Nearing an Important Support!!Hey Traders, in today's trading session we are monitoring GBPUSD for a buying opportunity around 1.34400 zone, GBPUSD is trading in an uptrend and currently is in a correction phase in which it is approaching the trend at 1.34400 support and resistance area.
Trade safe, Joe.
Gold Strong Pullbacks But Long Term Image Still Bullish!!!Hey Traders, in today's trading session we are monitoring XAUUSD for a buying opportunity around 3,200 zone, Gold is trading in an uptrend and currently is in a correction phase in which it is approaching the trend at 3,200 support and resistance area.
Trade safe, Joe.

GOLD Will Go Up! Long!
Take a look at our analysis for GOLD.
Time Frame: 15m
Current Trend: Bullish
Sentiment: Oversold (based on 7-period RSI)
Forecast: Bullish
The market is on a crucial zone of demand 3,295.78.
The oversold market condition in a combination with key structure gives us a relatively strong bullish signal with goal 3,310.58 level.
P.S
We determine oversold/overbought condition with RSI indicator.
When it drops below 30 - the market is considered to be oversold.
When it bounces above 70 - the market is considered to be overbought.
Disclosure: I am part of Trade Nation's Influencer program and receive a monthly fee for using their TradingView charts in my analysis.
Like and subscribe and comment my ideas if you enjoy them!

GBPJPY Is Very Bullish! Buy!
Take a look at our analysis for GBPJPY.
Time Frame: 4h
Current Trend: Bullish
Sentiment: Oversold (based on 7-period RSI)
Forecast: Bullish
The market is testing a major horizontal structure 193.933.
Taking into consideration the structure & trend analysis, I believe that the market will reach 195.006 level soon.
P.S
The term oversold refers to a condition where an asset has traded lower in price and has the potential for a price bounce.
Overbought refers to market scenarios where the instrument is traded considerably higher than its fair value. Overvaluation is caused by market sentiments when there is positive news.
Disclosure: I am part of Trade Nation's Influencer program and receive a monthly fee for using their TradingView charts in my analysis.
Like and subscribe and comment my ideas if you enjoy them!

NZD/CHF LONG FROM SUPPORT
Hello, Friends!
The BB lower band is nearby so NZD-CHF is in the oversold territory. Thus, despite the downtrend on the 1W timeframe I think that we will see a bullish reaction from the support line below and a move up towards the target at around 0.495.
Disclosure: I am part of Trade Nation's Influencer program and receive a monthly fee for using their TradingView charts in my analysis.
✅LIKE AND COMMENT MY IDEAS✅

USD/JPY BEST PLACE TO BUY FROM|LONG
USD/JPY SIGNAL
Trade Direction: long
Entry Level: 143.655
Target Level: 145.800
Stop Loss: 142.221
RISK PROFILE
Risk level: medium
Suggested risk: 1%
Timeframe: 3h
Disclosure: I am part of Trade Nation's Influencer program and receive a monthly fee for using their TradingView charts in my analysis.
✅LIKE AND COMMENT MY IDEAS✅

BUY GOLDIn todays session we are monitoring GOLD for buying position. Our entries are at 3295 and targets are above 3361. Our stops are below 3278. Use proper risk management. Good luck to you all.

USDJPY – Supportive news, price may break resistance soonUSDJPY is supported by positive U.S. economic data, as the PCE index remains elevated—reinforcing expectations that the Fed will keep interest rates higher for longer. This has boosted bond yields and the USD, driving USDJPY upward.
On the H3 technical chart, USDJPY has rebounded from the support zone around 143.680. Both the EMA 34 and EMA 89 lie below the price, reinforcing the recovery momentum. The pair is now expected to approach the 146.000 resistance area—where it intersects with the long-term descending trendline that has rejected price at least twice before.
If buying pressure holds and 146.000 is decisively broken, a short-term bullish trend will likely be confirmed. However, another rejection could lead to a retest of the previous support zone. Overall, the current trend slightly favors the buyers.

EURUSD – Bullish trend at risk amid PCE and technical pressureEURUSD has just reached the 1.13860 resistance zone – a confluence with the previous peak and former supply area. A weak rebound and a rounding top pattern are gradually forming, indicating weakening buying momentum. The 34 and 89 EMAs on the H4 chart add further pressure from a technical perspective.
If the price continues to be rejected at 1.13860, it may drop toward 1.12670 – which aligns with the ascending trendline support. A break below this level would confirm a clearer bearish trend.
The upcoming Core PCE data is forecasted to rise – indicating inflation remains elevated. This raises the likelihood that the Fed will maintain high interest rates for longer, supporting the USD and weighing on EURUSD.

GOLD NEXT TARGET XAUSDGOLD NEXT TARGET XAUSD as per trend and Gann value. market will reach 3850 target 2 before July 2025. Target will ready to achieve in a week seems. lets wait for market move.

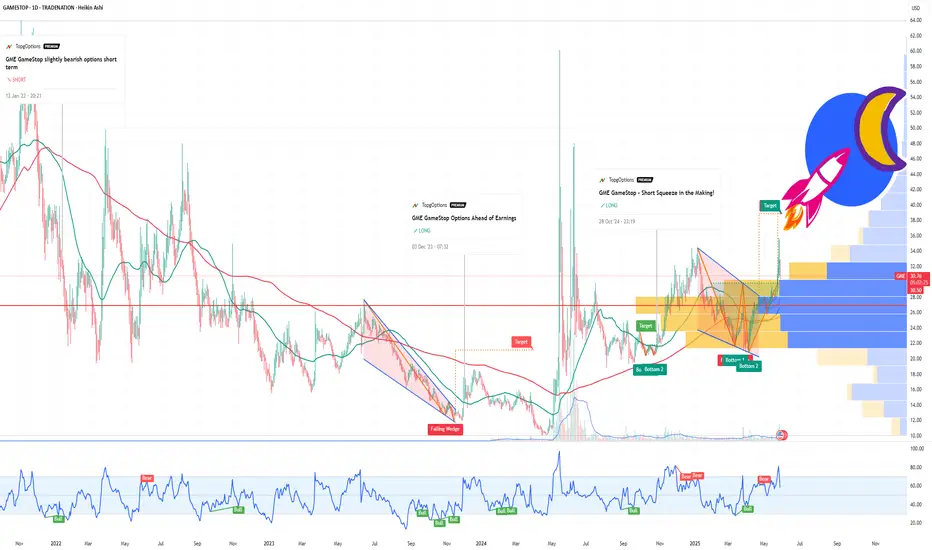
GameStop (GME) Is the New MSTR — And It Might Moon Harder ! If you haven`t bought the dip on GME:
Now You need to know that GameStop (GME) is the new MSTR MicroStrategy — But With Meme Power!
GME GameStop just made its boldest move yet: the company revealed it has purchased 4,710 Bitcoin, officially entering the crypto game in a serious way. While it hasn’t disclosed the total price paid, the intent is loud and clear — GameStop is transforming into a Bitcoin-holding company, just like MicroStrategy (MSTR) did back in 2020.
This isn’t just about hype. In March, GameStop raised $1.3 billion through a convertible note offering, specifically to help fund Bitcoin purchases. It also updated its investment policy to formally add Bitcoin as a reserve asset — the same exact strategy that led to MicroStrategy’s 10x stock explosion.
But here’s the twist: GameStop brings more than just Bitcoin exposure — it brings meme momentum. Unlike MicroStrategy, which had to win over the market, GME already has an army of loyal retail traders, massive online visibility, and a cultural legacy as the original meme stock. If MicroStrategy was the corporate face of Bitcoin adoption, GameStop is the internet’s version — louder, faster, and potentially more explosive.
Yes, the stock dipped on the announcement — typical for big moves like this — but long-term, the upside is undeniable. Bitcoin on the balance sheet gives GME new life, and volatility is GameStop’s comfort zone. With Bitcoin becoming a political and financial flashpoint — highlighted by major figures like JD Vance and Donald Trump Jr. attending the 2025 Bitcoin conference — GME’s move couldn’t be more timely.
This is more than a pivot. It’s a power play. GameStop is no longer just a nostalgia-fueled retailer — it’s a digital asset powerhouse in the making.
If you missed MicroStrategy’s rise, GameStop might just be your second chance — with even more firepower behind it.
Disclosure: I am part of Trade Nation's Influencer program and receive a monthly fee for using their TradingView charts in my analysis.
Ethereum is Approaching a Key Support!Hey Traders, in today's trading session we are monitoring ETH/USDT for a buying opportunity around 2,650 zone, Ethereum is trading in an uptrend and currently is in a correction phase in which it is approaching the trend at 2,650 support and resistance area.
Trade safe, Joe.

GOLD Is Going Up! Buy!
Take a look at our analysis for GOLD.
Time Frame: 1h
Current Trend: Bullish
Sentiment: Oversold (based on 7-period RSI)
Forecast: Bullish
The market is testing a major horizontal structure 3,301.19.
Taking into consideration the structure & trend analysis, I believe that the market will reach 3,325.39 level soon.
P.S
We determine oversold/overbought condition with RSI indicator.
When it drops below 30 - the market is considered to be oversold.
When it bounces above 70 - the market is considered to be overbought.
Disclosure: I am part of Trade Nation's Influencer program and receive a monthly fee for using their TradingView charts in my analysis.
Like and subscribe and comment my ideas if you enjoy them!
