U Unity Potential Buyout Soon?!If you missed my previous signal on U (Unity):
Now Unity Technologies (NYSE: U) just caught fire — surging 12.5% in a single day — on a massive uptick in volume that should have every sharp trader watching closely. With $39.1M in volume against a daily average of 9.4M shares, something is clearly brewing beneath the surface.
But this isn’t just about technicals — the options market is lighting up with unusual activity, and there’s fundamental buyout potential that’s getting harder to ignore.
🔍 Options Traders Are Making Bold Bets
Yesterday: Traders loaded up on January 16 $37 strike calls — deep out-of-the-money, high-risk, high-reward plays.
Today: A massive $3.5 million bet was placed on the $30 strike calls, also expiring January 16.
These aren’t casual bets. This is smart money positioning for a potential takeover or major catalyst, and the timeline is clear: January 2025.
📈 Why a Buyout Could Be Back on the Table
Let’s rewind. On August 9, 2022, AppLovin (APP) made an unsolicited offer to acquire Unity in an all-stock deal worth $17.5B, valuing Unity shares at $58.85 — an 18% premium at the time. Unity rejected the deal.
Fast forward to today:
AppLovin's market cap has exploded — now sitting at a jaw-dropping $127B, up 3,800% since late 2022.
Unity, meanwhile, is a shadow of its former self, trading far below its ATH of $201.12 (November 2021), with ongoing struggles in monetization and competition.
But this disparity creates a prime M&A setup:
AppLovin now has the firepower and strategic incentive to revisit the acquisition — with Unity’s depressed valuation, it’s arguably a bargain.
The AI + gaming narrative is red hot. Combining Unity’s engine with AppLovin’s ad and monetization capabilities could be the synergy Wall Street loves.
🎯 The Trade Setup
Unity just broke out with conviction on high volume — this could be the first leg of a larger move.
Options flow suggests bullish sentiment into early 2025.
A renewed takeover offer could easily push the stock back toward the $50–60 zone, if not higher.
🧠 Final Thoughts
Unity is no stranger to volatility, but when volume spikes, options explode, and a cash-rich suitor like AppLovin is thriving, traders should sit up and pay attention.
We may be watching the early stages of a buyout story 2.0 unfold — and Wall Street might be starting to price it in.
📌 Watch Unity (U) closely in the coming weeks. The market may be whispering — or shouting — "Takeover incoming."
Buy!!

Bitcoin is Nearing a Key Support Level!!!Hey Traders, in today's trading session we are monitoring BTCUSDT for a buying opportunity around 107,000 zone, Bitcoin is trading in an uptrend and currently is in a correction phase in which it is approaching the trend at 107,000 support and resistance area.
Trade safe, Joe.

GBPAUD Is Bullish! Buy!
Please, check our technical outlook for GBPAUD.
Time Frame: 1D
Current Trend: Bullish
Sentiment: Oversold (based on 7-period RSI)
Forecast: Bullish
The price is testing a key support 2.096.
Current market trend & oversold RSI makes me think that buyers will push the price. I will anticipate a bullish movement at least to 2.155 level.
P.S
Please, note that an oversold/overbought condition can last for a long time, and therefore being oversold/overbought doesn't mean a price rally will come soon, or at all.
Disclosure: I am part of Trade Nation's Influencer program and receive a monthly fee for using their TradingView charts in my analysis.
Like and subscribe and comment my ideas if you enjoy them!

GBPNZD Is Very Bullish! Long!
Here is our detailed technical review for GBPNZD.
Time Frame: 1D
Current Trend: Bullish
Sentiment: Oversold (based on 7-period RSI)
Forecast: Bullish
The market is trading around a solid horizontal structure 2.262.
The above observations make me that the market will inevitably achieve 2.298 level.
P.S
The term oversold refers to a condition where an asset has traded lower in price and has the potential for a price bounce.
Overbought refers to market scenarios where the instrument is traded considerably higher than its fair value. Overvaluation is caused by market sentiments when there is positive news.
Disclosure: I am part of Trade Nation's Influencer program and receive a monthly fee for using their TradingView charts in my analysis.
Like and subscribe and comment my ideas if you enjoy them!

INOX WIND BREAKOUT Target Levels
- Short-Term Target: 204–211.
- Medium-Term Target: 261–343
Stop-Loss Levels
- Short-Term Stop Loss: 184.2 near immediate support
- Medium-Term Stop Loss: 157.1–153.8 strong support zone
- Long-Term Stop Loss: 170.6 major trend support

EURUSD – Holding the uptrend, eyes on support reactionEURUSD continues to move steadily within a clearly defined rising channel. After touching the channel bottom around 1.1305 (which aligns with the 89 EMA), price is showing a slight rebound and has a chance to form the next upward leg.
Technical view: The bullish structure remains intact. As long as price holds this bottom area, there's a high probability of another push toward the resistance zone around 1.1428 – a level that was previously rejected.
News factor: Market sentiment is now focused on upcoming U.S. Core PCE inflation data, which could influence expectations of a Fed rate cut and, in turn, impact the strength of the USD.
Suggested strategy: Favor buying if price holds above 1.1305 – targeting 1.1428. If this level fails, the short-term uptrend may be challenged.

XAUUSD – Holding the channel, eyeing a bounceGold is still trading within a rising channel, recently touching the confluence support zone of the trendline, the 89 EMA, and the demand area around 3,287. This level has seen strong reactions in the past – and if price holds here again, a bounce toward the 3,382 zone is highly likely.
Supporting factor: Market sentiment remains cautious after Moody’s emphasized the risks surrounding U.S. public debt, putting pressure on the USD and boosting gold’s appeal. In addition, investors are closely watching the upcoming U.S. Core PCE data later this week – a key factor that could influence Fed rate cut expectations.
Suggested scenario: Favor buying if the price holds above 3,287, targeting 3,382 – the upper boundary of the channel. If this fails, selling pressure may return.

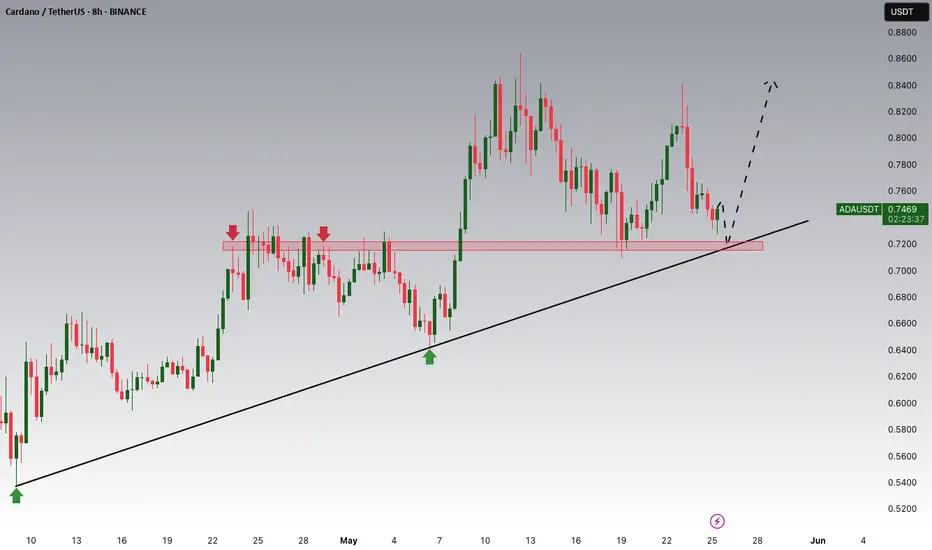
Cardano Potential UpsidesHey Traders, in today's trading session we are monitoring ADA/USDT for a buying opportunity around 0.7200 zone, Cardano is trading in an uptrend and currently is in a correction phase in which it is approaching the trend at 0.72000 support and resistance area.
Trade safe, Joe.
$MBLY is BREAKING OUT - 224% UpsideNASDAQ:MBLY is breaking out - 224% Upside! 🚀
🎯$18.09🎯$20.03🎯$24.66🎯$34.26🎯$49.20
- Bullish H5_L Indicator
- Volume Shelf with GAP
- Inverse H&S with a MM to $49.20 (Already broke out and retested)
- Rising WR%
- Undervalued and at the forefront of AV Tech

Round 2 on $FUBO! 92% UpsideEarlier this year we caught the MASSIVE 400% move on NYSE:FUBO 🚀
1st PT is $4.89 🎯
2nd PT and MM of Falling Wedge is $5.86 📏
We've come full circle and we are back in them for another MASSIVE move!

CADCHF Will Go Higher! Long!
Take a look at our analysis for CADCHF.
Time Frame: 9h
Current Trend: Bullish
Sentiment: Oversold (based on 7-period RSI)
Forecast: Bullish
The market is on a crucial zone of demand 0.599.
The oversold market condition in a combination with key structure gives us a relatively strong bullish signal with goal 0.605 level.
P.S
The term oversold refers to a condition where an asset has traded lower in price and has the potential for a price bounce.
Overbought refers to market scenarios where the instrument is traded considerably higher than its fair value. Overvaluation is caused by market sentiments when there is positive news.
Disclosure: I am part of Trade Nation's Influencer program and receive a monthly fee for using their TradingView charts in my analysis.
Like and subscribe and comment my ideas if you enjoy them!

AUD/CAD SENDS CLEAR BULLISH SIGNALS|LONG
Hello, Friends!
AUD-CAD downtrend evident from the last 1W red candle makes longs trades more risky, but the current set-up targeting 0.893 area still presents a good opportunity for us to buy the pair because the support line is nearby and the BB lower band is close which indicates the oversold state of the AUD/CAD pair.
Disclosure: I am part of Trade Nation's Influencer program and receive a monthly fee for using their TradingView charts in my analysis.
✅LIKE AND COMMENT MY IDEAS✅

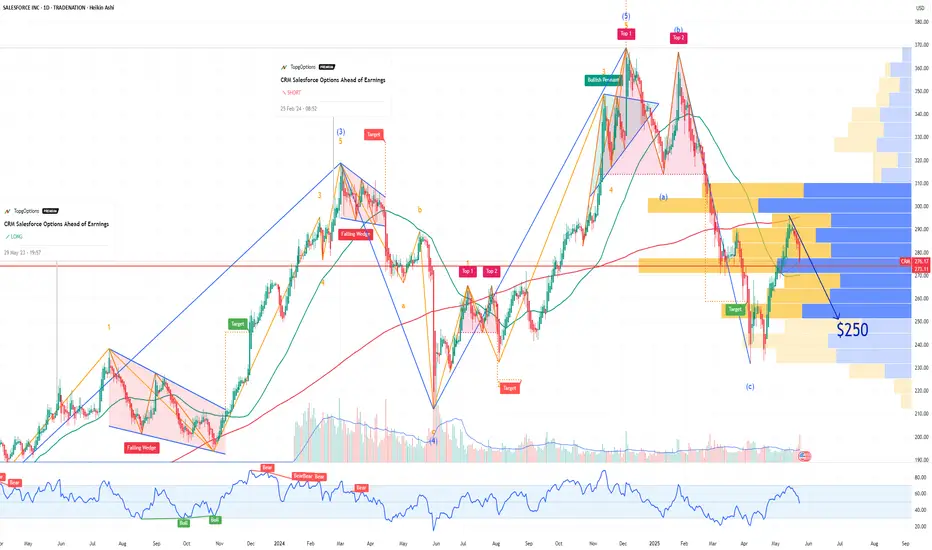
CRM Salesforce Options Ahead of EarningsIf you haven`t bought CRM before this rally:
nor sold this top:
Now analyzing the options chain and the chart patterns of CRM Salesforce prior to the earnings report this week,
I would consider purchasing the 250usd strike price Puts with
an expiration date of 2025-6-20,
for a premium of approximately $5.15.
If these options prove to be profitable prior to the earnings release, I would sell at least half of them.
Disclosure: I am part of Trade Nation's Influencer program and receive a monthly fee for using their TradingView charts in my analysis.
NTNX Nutanix Options Ahead of EarningsIf you haven`t bought NTNX before the recent rally:
Now analyzing the options chain and the chart patterns of NTNX Nutanix prior to the earnings report this week,
I would consider purchasing the 80usd strike price Puts with
an expiration date of 2025-6-20,
for a premium of approximately $5.20.
If these options prove to be profitable prior to the earnings release, I would sell at least half of them.

ELF Beauty Options Ahead of EarningsAnalyzing the options chain and the chart patterns of ELF Beauty prior to the earnings report this week,
I would consider purchasing the 85usd strike price Calls with
an expiration date of 2025-5-30,
for a premium of approximately $5.85.
If these options prove to be profitable prior to the earnings release, I would sell at least half of them.

DELL Technologies Options Ahead of EarningsIf you haven`t bought the recent dip:
Now analyzing the options chain and the chart patterns of DELL Technologies prior to the earnings report this week,
I would consider purchasing the 110usd strike price Puts with
an expiration date of 2025-9-19,
for a premium of approximately $8.90.
If these options prove to be profitable prior to the earnings release, I would sell at least half of them.
I`m bullish long term on DELL though.
Disclosure: I am part of Trade Nation's Influencer program and receive a monthly fee for using their TradingView charts in my analysis.

Downtrend Awaiting ConfirmationUSDJPY has just made a technical rebound from the support zone at 142.22 up to the resistance area around 144.60 — a confluence with both the EMA 34 and EMA 89. However, based on the chart, this zone has previously acted as a reversal point, and price is now retesting that same level of rejection.
The current price action suggests a high likelihood of a small double-top pattern forming around 144.60. If selling pressure re-emerges here, the market could reverse and head back down toward 142.22, aligning with the developing downtrend.
Moody’s recent warning on U.S. credit rating has placed pressure on the USD, while the JPY continues to hold its safe-haven appeal amid market uncertainty.

EURUSD – Bouncing on trendline amid EU optimismEURUSD continues to hold a strong upward momentum within a short-term ascending channel. After retesting the channel bottom around the 1.1360 zone, price is showing signs of rebounding, and a "small double bottom" pattern appears to be forming. If confirmed, EURUSD may rally toward the resistance area at 1.1447.
Factors supporting the bullish trend:
Trump temporarily postponed the 50% tariff on EU goods until July 9 → Trade tensions ease, supporting the euro.
Germany's Q1 GDP grew by 0.4% – above expectations → Boosts confidence in Eurozone recovery.
The ECB aims to elevate the euro’s global role (digital euro, cross-border payment improvements).
Potential scenario:
If the 1.1360 zone holds (channel bottom + EMA support), there is a high chance that price will retest and break above the 1.1447 resistance.

BULLISH GOLDIn todays session we are observing GOLD for buying opportunities. Our entries are at 3328.73, targets is 3402 and stops below 3310.5. Use proper risk management. Cheers gang

H&S should lead the breakout Very simple but the dip inside Head and shoulders or buy near the breakout formation.
Ethereum should finally tise and break Resistance #1 and reclaim 2585 then lastly to break above 2650 #2 Resistance

Trump Eases Tariff Pressure, Gold Awaits Fed SignalsOn May 26, U.S. President Donald Trump decided to extend the deadline for the 50% tariff on goods from the European Union until July 9. This move temporarily eased trade tensions and slightly reduced the demand for gold as a safe haven.
Gold is currently trading near a long-term descending trendline that has previously rejected three bullish attempts. After a strong recent rebound, the price is now pausing and risks retracing toward the support zone around 3,241.4 – a confluence area with both the EMA 34 and EMA 89.
If this support holds, gold may bounce back and attempt a breakout above the trendline, targeting the 3,439.5 level. However, if selling pressure continues to dominate, a deeper correction remains a real possibility.
This week, investors will closely watch the FOMC meeting minutes and the U.S. Consumer Confidence Index for May. These data releases are expected to shed light on the Federal Reserve’s outlook on inflation and interest rate policy, which could significantly impact the strength of the USD and gold prices.

COST Costco Wholesale Corporation Options Ahead of EarningsIf you haven`t bought COST before the rally:
Now analyzing the options chain of COST Costco prior to the earnings report this week,
I would consider purchasing the 800usd strike price Puts with
an expiration date of 2027-1-15,
for a premium of approximately $42
If these options prove to be profitable prior to the earnings release, I would sell at least half of them.

PSTG Pure Storage Options Ahead of EarningsAnalyzing the options chain and the chart patterns of PSTG Pure Storage prior to the earnings report this week,
I would consider purchasing the 60usd strike price Calls with
an expiration date of 2025-6-20,
for a premium of approximately $2.55.
If these options prove to be profitable prior to the earnings release, I would sell at least half of them.
