TSLA Tesla Options Ahead of EarningsIf you haven`t bought TSLA before the recent rally:
Now analyzing the options chain and the chart patterns of TSLA Tesla prior to the earnings report this week,
I would consider purchasing the 350usd strike price Calls with
an expiration date of 2025-8-15,
for a premium of approximately $14.90.
If these options prove to be profitable prior to the earnings release, I would sell at least half of them.
Disclosure: I am part of Trade Nation's Influencer program and receive a monthly fee for using their TradingView charts in my analysis.
Buy-sell

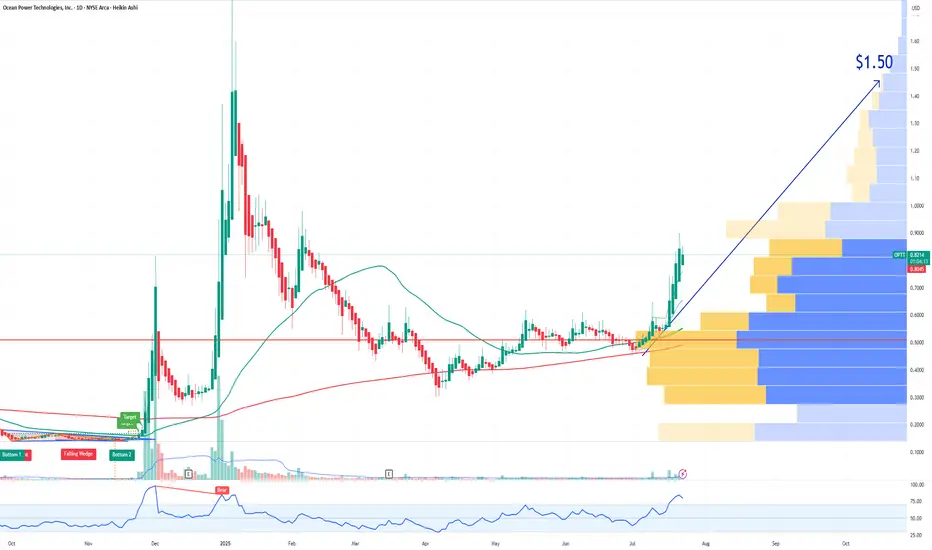
OPTT Ocean Power Technologies Options Ahead of EarningsAnalyzing the options chain and the chart patterns of OPTT Ocean Power Technologies prior to the earnings report this week,
I would consider purchasing the 1.50usd strike price Calls with
an expiration date of 2025-11-21,
for a premium of approximately $0.25.
If these options prove to be profitable prior to the earnings release, I would sell at least half of them.
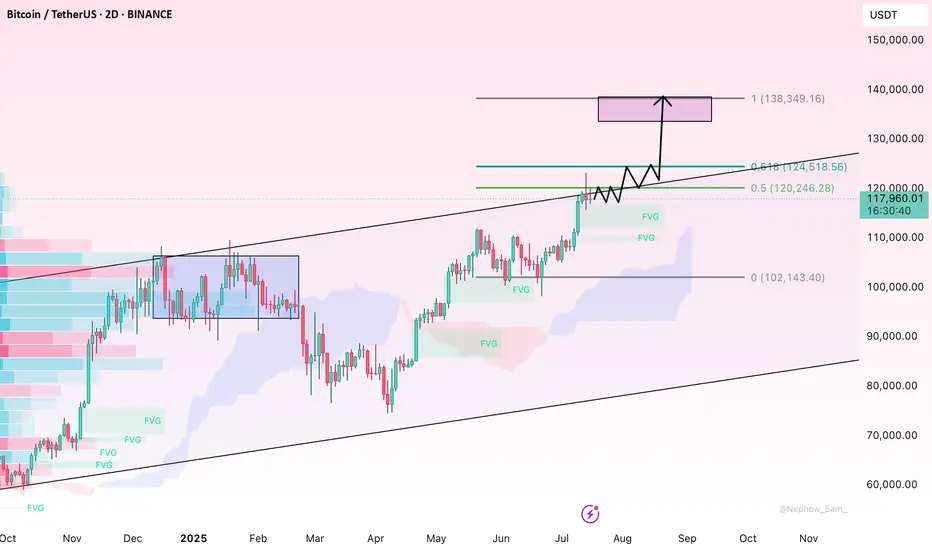
BTC Consolidates Below Key Resistance – Is a Breakout Imminent?Bitcoin is currently consolidating beneath the major psychological resistance near $120,000. The medium-term trend remains bullish, supported by a series of higher highs and higher lows. However, recent candlesticks with long upper wicks reflect hesitation among buyers at elevated levels, pointing to potential exhaustion in short-term momentum.
Despite this, there are no clear signs of bearish divergence or strong reversal patterns. The sideways range between $112,000–$120,000 likely represents a healthy consolidation phase after a strong rally. If the price maintains support around $113,000 and breaks above $120,000 with convincing volume, the next leg higher could follow swiftly.
For now, buyers remain in control, provided BTC holds key structural supports. A breakout confirmation is crucial for bullish continuation.

Gold’s Next Move: Bounce or Breakdown?Gold is pulling back after breaking the 3,360 USD resistance on the 6-hour chart. Price is currently testing the nearest fair value gap (3,370–3,380), but upside momentum is stalling, partly due to unfilled supply zones above.
A retest of the lower FVG near 3,340 will be key. Holding above this level could trigger renewed buying, while a break below may invalidate the bullish structure.
Traders should closely monitor whether downside gaps continue to fill and how price behaves near support zones. Lack of strong liquidity could lead to a false breakout.

IBM International Business Machines Options Ahead of EarningsIf you haven`t bought IBM before the rally:
Now analyzing the options chain and the chart patterns of IBM International Business Machines prior to the earnings report this week,
I would consider purchasing the 290usd strike price Puts with
an expiration date of 2025-9-19,
for a premium of approximately $17.30.
If these options prove to be profitable prior to the earnings release, I would sell at least half of them.
Disclosure: I am part of Trade Nation's Influencer program and receive a monthly fee for using their TradingView charts in my analysis.

TMUS T-Mobile US Options Ahead of EarningsIf you haven`t bought TMUS before the rally:
Now analyzing the options chain and the chart patterns of TMUS T-Mobile US prior to the earnings report this week,
I would consider purchasing the 227.5usd strike price Puts with
an expiration date of 2025-7-25,
for a premium of approximately $3.50.
If these options prove to be profitable prior to the earnings release, I would sell at least half of them.
Disclosure: I am part of Trade Nation's Influencer program and receive a monthly fee for using their TradingView charts in my analysis.

NOW ServiceNow Options Ahead of EarningsIf you haven`t bought NOW before the recent rally:
Analyzing the options chain and the chart patterns of NOW ServiceNow prior to the earnings report this week,
I would consider purchasing the 960usd strike price Calls with
an expiration date of 2025-12-19,
for a premium of approximately $97.60.
If these options prove to be profitable prior to the earnings release, I would sell at least half of them.
Disclosure: I am part of Trade Nation's Influencer program and receive a monthly fee for using their TradingView charts in my analysis.

LVS Las Vegas Sands Options Ahead of EarningsIf you haven`t bought LVS before the rally:
Now analyzing the options chain and the chart patterns of LVS Las Vegas Sands prior to the earnings report this week,
I would consider purchasing the 48.5usd strike price Puts with
an expiration date of 2025-7-25,
for a premium of approximately $1.22.
If these options prove to be profitable prior to the earnings release, I would sell at least half of them.
Disclosure: I am part of Trade Nation's Influencer program and receive a monthly fee for using their TradingView charts in my analysis.

DOW Options Ahead of EarningsAnalyzing the options chain and the chart patterns of DOW prior to the earnings report this week,
I would consider purchasing the 30usd strike price Calls with
an expiration date of 2025-9-19,
for a premium of approximately $2.36.
If these options prove to be profitable prior to the earnings release, I would sell at least half of them.
Disclosure: I am part of Trade Nation's Influencer program and receive a monthly fee for using their TradingView charts in my analysis.

GOOGL Alphabet Options Ahead of EarningsIf you haven`t bought GOOGL before the rally:
Now analyzing the options chain and the chart patterns of GOOGL Alphabet prior to the earnings report this week,
I would consider purchasing the 215usd strike price Calls with
an expiration date of 2026-1-16,
for a premium of approximately $8.20.
If these options prove to be profitable prior to the earnings release, I would sell at least half of them.
Disclosure: I am part of Trade Nation's Influencer program and receive a monthly fee for using their TradingView charts in my analysis.

XAUUSD 24-Hour Technical Analysis Forecast - UTC+4 Current Price: $3,350.095 (Close: Friday, July 18th, 2025) UTC+4
Analysis Period : Next 24 Hours (July 21-22, 2025) UTC+4
Market Status: Weekend - Preparing for Monday Open 02:00AM 21st July 2025
EXECUTIVE SUMMARY - 24H OUTLOOK
Primary Bias: Neutral to Bearish (Short-term)
Key Resistance: $3,375 - $3,390
Critical Support: $3,285 - $3,300
Expected Range: $3,300 - $3,380
Volatility Level: Moderate to High
CANDLESTICK PATTERN ANALYSIS
Friday's Close Formation
Pattern: Doji-like formation at resistance zone
Significance: Indecision after testing $3,350+ levels
Volume: Moderate - no strong conviction breakout
Context: Failed to close decisively above $3,375 resistance
Expected 24H Patterns
Monday Gap: Potential gap down to $3,320-3,330 area
Reversal Patterns: Watch for hammer/doji at support levels
Continuation Signals: Break below $3,300 could trigger bearish continuation
HARMONIC PATTERN ANALYSIS
Current Harmonic Setup
Primary Pattern: Potential Bearish Bat completing
X: $3,285 (previous low)
A: $3,390 (recent high)
B: $3,320 (61.8% retracement)
C: $3,375 (78.6% projection - current area)
D (Target): $3,300-3,285 (88.6% completion zone)
Fibonacci Levels (24H Focus)
Golden Ratio Resistance: $3,375 (current test area)
61.8% Support: $3,320
78.6% Support: $3,300
88.6% Critical Support: $3,285
Pattern Completion Probabilities
Bearish Bat Completion: 70% probability targeting $3,285-3,300
Bullish Cypher Setup: 30% if break above $3,390
ELLIOTT WAVE THEORY - 24H COUNT
Primary Wave Count
Macro Structure: Wave 5 of larger impulse possibly topping
Current Sub-wave: Wave (c) of corrective structure
Mini Count: 5-wave decline from $3,390 high in progress
24-Hour Wave Projection
Wave 1: $3,390 → $3,320 (Completed)
Wave 2: $3,320 → $3,360 (Completed - 50% retrace)
Wave 3: $3,360 → $3,285 (In Progress - Target Area)
Wave 4: $3,285 → $3,310 (Projected)
Wave 5: $3,310 → $3,260 (Extended target)
Critical Levels
Wave 3 = 1.618 × Wave 1: $3,285 (Primary target)
Invalidation: Above $3,390 (Wave 2 high)
WYCKOFF THEORY - 24H PHASE
Current Market Phase
Phase Assessment: Distribution Phase C (Testing Supply)
Composite Operator Action: Testing demand at $3,350 area
Volume Analysis: Declining volume on recent rallies (bearish)
Expected 24H Wyckoff Action
Phase Transition: Moving toward Phase D (Markdown begins)
Supply Test: Failed test at $3,375 confirms distribution
Target: Initial markdown to $3,285-3,300 area
Key Wyckoff Signals (24H)
No Demand: Expected at current levels
Selling Climax: Possible if break below $3,285 with high volume
Automatic Rally: Dead cat bounce to $3,320-3,330
W.D. GANN THEORY - 24H ANALYSIS
Square of Nine Analysis
Current Position: 3350° on Gann wheel
Next Cardinal Point: 3375° (90° angle - strong resistance)
Support Angles: 3300° (natural support), 3285° (critical angle)
Geometric Progression: $3,285 = perfect square root relationship
Time Theory - 24H Cycle
Natural Time Window: 24-hour cycle from Friday's high
Critical Time: 14:00-16:00 UTC Monday (historical turning point)
Lunar Influence: New moon phase approaching (bearish for commodities)
Angle Theory
45° Line: Currently at $3,320 (rising support)
63.75° Line: $3,285 (steep support angle)
26.25° Line: $3,375 (resistance angle)
Price Forecasting (Gann Methods)
Primary Target: $3,285 (Square root of 81²)
Secondary Target: $3,240 (Square root of 80²)
Resistance: $3,375 (Square root of 82.5²)
Time Forecasting
Turn Time 1: 06:00 UTC Monday (18 hours from Friday close)
Turn Time 2: 14:00 UTC Monday (26 hours from Friday close)
Major Turn: 22:00 UTC Monday (34 hours - Fibonacci time)
MULTI-TIMEFRAME INTRADAY ANALYSIS
5-Minute Chart Analysis
Trend: Bearish momentum building
Pattern: Lower highs, lower lows since Friday high
Key Levels:
Resistance: $3,360-3,365
Support: $3,330-3,335
RSI: Approaching oversold (35-40 range)
Volume: Increasing on down moves
15-Minute Chart Analysis
Structure: Bearish flag formation
Breakdown Level: Below $3,340
Target: $3,300-3,310 (flag pole projection)
Moving Averages: Price below EMA 20 ($3,358)
MACD: Bearish crossover confirmed
30-Minute Chart Analysis
Primary Trend: Corrective phase active
Chart Pattern: Descending triangle
Apex: Around $3,335-3,340
Breakout Direction: 65% probability downward
Volume Profile: Heavy selling at $3,350-3,375
1-Hour Chart Analysis
Major Structure: ABC correction in progress
Current Position: C-wave development
Fibonacci Target: $3,285 (127.2% extension)
Bollinger Bands: Price touching lower band
Stochastic: Oversold but no divergence yet
4-Hour Chart Analysis
Macro Trend: Still bullish above $3,200
Correction Depth: 23.6% retracement maximum expected
Support Zone: $3,280-3,300 (confluences)
Resistance Zone: $3,375-3,390 (proven strong)
Ichimoku: Price approaching cloud support
TECHNICAL INDICATORS MATRIX
Momentum Indicators
RSI (4H): 42 (Neutral-Bearish)
RSI (1H): 35 (Oversold approaching)
Stochastic: %K: 28, %D: 35 (Oversold)
Williams %R: -75 (Strong oversold)
Trend Indicators
MACD (4H): Bearish crossover pending
ADX: 28 (Moderate trend strength)
Parabolic SAR: $3,365 (Sell signal if broken)
Volume Indicators
OBV: Declining (distribution pattern)
Volume Rate of Change: Negative
Accumulation/Distribution: Slight distribution
KEY SUPPORT & RESISTANCE LEVELS (24H)
Immediate Resistance Levels
R1: $3,365 (Previous support turned resistance)
R2: $3,375 (Major psychological & Gann resistance)
R3: $3,390 (Recent swing high)
R4: $3,410 (Extended resistance)
Critical Support Levels
S1: $3,330 (Immediate support)
S2: $3,300 (Psychological & Fibonacci)
S3: $3,285 (Major harmonic & Gann target)
S4: $3,260 (Extended support)
24-HOUR TRADING SCENARIOS
Scenario 1: Bearish Breakdown (60% Probability)
Trigger: Break below $3,330 with volume
Target 1: $3,300-3,310
Target 2: $3,285-3,290
Extended Target: $3,260-3,270
Stop Loss (Shorts): Above $3,370
Scenario 2: Range-Bound Consolidation (25% Probability)
Range: $3,320-3,375
Strategy: Fade extremes
Buy Zone: $3,320-3,330
Sell Zone: $3,365-3,375
Breakout Confirmation: Volume spike
Scenario 3: Bullish Reversal (15% Probability)
Trigger: Break above $3,375 with volume
Target 1: $3,390-3,400
Target 2: $3,410-3,420
Invalidation: Below $3,285
RISK FACTORS & CATALYSTS (24H)
Bearish Catalysts
US Dollar strength continuation
Risk-off sentiment from geopolitical tensions
Profit-taking ahead of weekend
Technical breakdown confirmation
Bullish Catalysts
Safe-haven demand surge
US Dollar weakness
Central bank buying speculation
Technical oversold bounce
High-Impact Events (Next 24H)
Asian market opening sentiment
US Dollar Index movement
Cryptocurrency correlation effects
Weekend gap analysis
TRADING RECOMMENDATIONS (24H)
For Scalpers (5M-15M)
Strategy: Fade bounces to resistance
Entry: $3,355-3,365 area
Target: $3,335-3,340
Stop: $3,375
Risk/Reward: 1:2
For Swing Traders (1H-4H)
Primary Setup: Short on retracement
Entry Zone: $3,350-3,360
Target 1: $3,300
Target 2: $3,285
Stop Loss: $3,385
Conservative Approach
Wait for: Clear breakdown below $3,330
Entry: $3,325 (confirmation)
Target: $3,285-3,290
Stop: $3,345
CONFLUENCE FACTORS
Bearish Confluence at $3,285
Harmonic Bat pattern completion (88.6% level)
Gann Square of Nine critical angle
Elliott Wave 3 = 1.618 × Wave 1 target
Fibonacci 78.6% retracement level
Previous significant support area
Wyckoff markdown initial target
Resistance Confluence at $3,375
Gann 90-degree angle resistance
Harmonic pattern resistance
Elliott Wave corrective high
Previous breakout level
Psychological round number
FINAL 24H FORECAST SUMMARY
Expected Price Action: Controlled decline toward $3,285-3,300 support zone with potential for brief consolidation before further weakness.
Primary Targets (Downside):
First: $3,300-3,310
Second: $3,285-3,290
Extended: $3,260-3,270
Key Invalidation: Sustained break above $3,375 would shift bias bullish toward $3,390-3,410.
Risk Management: Position sizing should be conservative due to high volatility expectations and weekend gap risks.
Probability Assessment:
60% - Bearish scenario
25% - Sideways consolidation
15% - Bullish reversal
Disclaimer: This analysis is for educational purposes only. Gold trading involves substantial risk. Always use proper risk management and never risk more than you can afford to lose.
Volume profile resistance

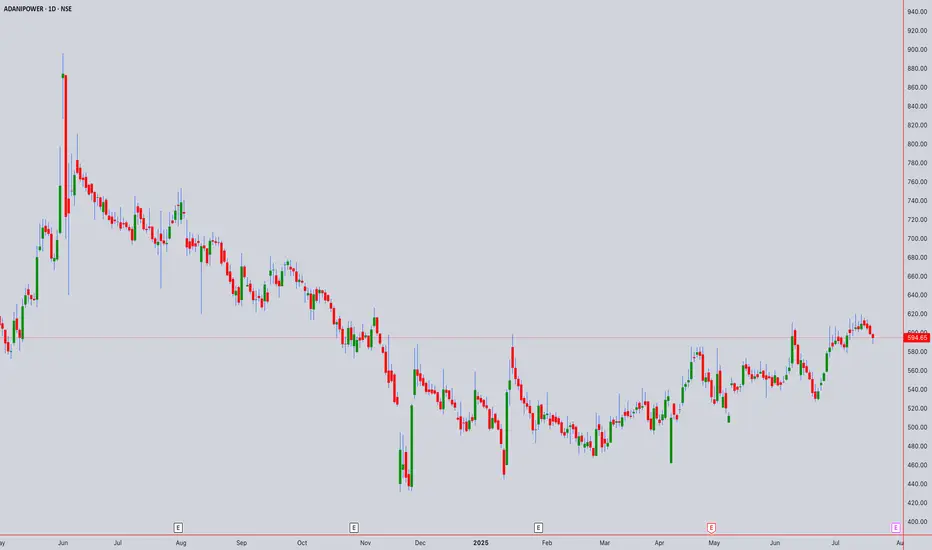
Adani Power (NSE:ADANIPOWER) Technical Analysis July 18th, 2025Current Price : ₹594.65 (as of July 18th, 2025, 02:00PM UTC+4)
Target Price: ₹633.67 (+6.56% upside potential)
Executive Summary
Adani Power is currently showing mixed signals across different timeframes. The stock has broken through key resistance levels but is facing overhead resistance. Multiple technical theories suggest a consolidation phase with potential for upward movement.
1. CANDLESTICK PATTERN ANALYSIS
Intraday Patterns (5M-1H)
Current Formation: Doji/Spinning top patterns indicating indecision
Key Pattern: Inside bar formations suggest consolidation
Volume Profile: Moderate volume with no significant breakout confirmation
Swing Patterns (4H-Weekly)
Primary Pattern: Rectangle/Channel formation identified
Support Zone: ₹513-520 (Strong support)
Resistance Zone: ₹588-600 (Current testing area)
2. HARMONIC PATTERN ANALYSIS
Potential Patterns
ABCD Pattern: Incomplete - monitoring for completion around ₹630-650 zone
Gartley Pattern: Potential bearish setup if rejection occurs at current levels
Fibonacci Levels:
Support: ₹450 (S1), ₹300 (S2), ₹200 (S3)
Resistance: ₹700 (R1), ₹850 (R2), ₹1,000 (R3)
3. ELLIOTT WAVE THEORY
Wave Count Analysis
Primary Wave: Currently in Wave 3 of a larger impulse structure
Sub-wave: Wave 4 correction potentially completing around ₹580-590
Target: Wave 5 projection towards ₹700-750 zone
Invalidation Level: Below ₹513 would negate current count
Time Cycles
Short-term: 5-8 day correction cycle
Medium-term: 21-34 day impulse cycle active
4. WYCKOFF THEORY ANALYSIS
Current Phase Assessment
Phase: Potential Mark-up Phase (Phase D-E transition)
Volume Analysis: Accumulation patterns visible on weekly charts
Smart Money: Institutional interest evident from volume profiles
Composite Operator: Testing supply around ₹600 levels
Key Levels
Spring Test: ₹513 level held as key support
Supply Line: ₹588-600 acting as resistance
Upthrust Potential: Break above ₹605 could trigger mark-up
5. W.D. GANN THEORY ANALYSIS
Square of Nine Analysis
Current Position: 594° on the wheel
Next Resistance: 625° (₹625) - significant Gann angle
Support Level: 576° (₹576) - 45-degree angle support
Cardinal Points: 600° represents a critical decision point
Time Theory
Natural Time Cycles: 90-day cycle completion expected by August 2025
Anniversary Dates: Historical significant dates align with current timeframe
Time Windows: July 25-30, 2025 represents important time cluster
Angle Theory
1x1 Angle: Currently trading above the 1x1 rising angle from ₹513 low
2x1 Angle: Resistance at ₹630 level (steep angle)
Price/Time Squares: Next square at ₹625 (25²)
Forecasting
Price Target: ₹625-650 based on geometric progressions
Time Target: 15-20 trading days for next significant move
Harmony Level: ₹594 is in harmony with previous swing levels
6. ICHIMOKU KINKO HYO ANALYSIS
Cloud (Kumo) Analysis
Current Position: Price trading above the cloud (bullish)
Cloud Thickness: Thin cloud ahead suggests easier breakout potential
Cloud Color: Green cloud in coming periods (bullish bias)
Line Analysis
Tenkan-sen (9): ₹587 - price above (bullish)
Kijun-sen (26): ₹571 - price above (strong bullish)
Chikou Span: Clear of price action (no interference)
Senkou Span A: ₹579 (support)
Senkou Span B: ₹562 (key support)
7. TECHNICAL INDICATORS
RSI Analysis
Current RSI: 58-62 range (neutral to slightly bullish)
Divergence: No major divergences detected
Overbought/Oversold: Not in extreme zones
Bollinger Bands
Position: Price in upper half of bands
Squeeze: Bands expanding, indicating increased volatility
Signal: Potential for continued upward movement
VWAP Analysis
Daily VWAP: ₹591 (price above - bullish)
Weekly VWAP: ₹584 (strong support)
Volume Profile: Heavy volume around ₹570-580 zone
Moving Averages
SMA 20: ₹583 (bullish crossover)
EMA 20: ₹586 (price above)
SMA 50: ₹567 (strong support)
EMA 50: ₹569 (upward sloping)
SMA 200: ₹524 (long-term bull market)
8. MULTI-TIMEFRAME ANALYSIS
Intraday Timeframes
5-Minute Chart
Trend: Sideways with bullish bias
Key Level: ₹592-596 range bound
Signal: Wait for breakout above ₹600
15-Minute Chart
Trend: Consolidating triangle pattern
Volume: Decreasing (typical in consolidation)
Target: ₹605-610 on upside breakout
30-Minute Chart
Trend: Higher highs and higher lows intact
Support: ₹590-592
Resistance: ₹598-602
1-Hour Chart
Trend: Bullish flag pattern forming
Breakout Level: Above ₹602
Target: ₹625-630
4-Hour Chart
Trend: Strong uptrend since ₹513 low
Pattern: Bull flag consolidation
Key Level: ₹588 as crucial support
Swing Timeframes
Daily Chart
Trend: Primary uptrend intact
Pattern: Rectangle between ₹513-588 broken upside
Target: Next resistance at ₹700 zone
Weekly Chart
Trend: Long-term bullish structure
Support: ₹450-500 major support zone
Resistance: ₹700-750 target area
Monthly Chart
Trend: Recovery from major lows
Long-term View: Potential for ₹850+ targets
Time Horizon: 6-12 months for major targets
9. FORECAST & OUTLOOK
Intraday Forecast (Next 1-5 Days)
Bias: Neutral to Bullish
Range: ₹585-610
Breakout Level: Above ₹605 for ₹625 target
Stop Loss: Below ₹582
Swing Forecast (Next 2-8 Weeks)
Primary Target: ₹633-650
Secondary Target: ₹700-720
Support Zone: ₹570-580
Risk Level: Medium (volatility expected)
Key Risk Factors
Overall market sentiment and Adani group developments
Earnings disappointment (recent -23.91% surprise noted)
Broader power sector dynamics
Regulatory changes in power sector
Trading Strategy Recommendations
For Intraday Traders
Buy: Above ₹602 with ₹610-615 target
Sell: Below ₹590 with ₹582-585 target
Risk Management: 1-2% position sizing
For Swing Traders
Accumulate: ₹580-590 zone
Target: ₹633-650 (first target)
Stop Loss: Below ₹570 (daily close basis)
Time Horizon: 4-8 weeks
Confluence Factors Supporting Bullish View
Multiple theories align for ₹625-650 targets
Strong volume accumulation patterns
Technical breakout from rectangle formation
Ichimoku cloud support
Gann squares and angles alignment
Warning Signals to Watch
Daily close below ₹580
RSI divergence formation
Volume decrease on any upward moves
Broader market weakness
Disclaimer: This analysis is for educational purposes only. Always consult with financial advisors and conduct your own research before making investment decisions. Past performance does not guarantee future results.
Gold prices fall in the short term – What's next?Hello everyone, what’s your take on gold?
Today, gold continues to attract short-term selling pressure as USD buying momentum returns and expectations for Fed rate cuts diminish. On the other hand, an overall positive risk sentiment is also seen as another factor weighing on the precious metal.
At the time of writing, gold is trading around the EMA 34 and 89 near 3,336 USD. With no major updates expected, the market is likely to remain steady throughout the day.
From a technical perspective, the bearish trend persists, with prices capped below the trendline. A series of lower highs and lower lows could push XAUUSD to retest deeper levels, potentially reaching the 3,300 USD mark. However, lingering trade uncertainties may limit losses for this safe-haven asset.
This is just my view on the market, not financial advice.

BTC Nears $120K – Pullback Risk or Breakout Launchpad?Bitcoin has rallied strongly after breaking its multi-week consolidation, now hovering just under the key psychological and historical resistance at $120K. The daily chart shows price floating above the 20EMA, with no signs of distribution—yet. However, the dense liquidity pocket between $110K–$114K remains a magnet in case of a technical pullback.
If bulls defend $118K and price cleanly breaks above $121K with strong volume, the next target lies in the $125K–$128K zone. Spot ETF inflows remain healthy, and any dovish pivot from the Fed could set off another crypto-wide bull wave.
UAL United Airlines Holdings Options Ahead of EarningsIf you haven`t exited UAL before the recent selloff:
Now analyzing the options chain and the chart patterns of UAL United Airlines Holdings prior to the earnings report this week,
I would consider purchasing the 92.5usd strike price Calls with
an expiration date of 2025-9-19,
for a premium of approximately $5.12.
If these options prove to be profitable prior to the earnings release, I would sell at least half of them.

Arbitrage Opportunity!I believe I’ve identified an arbitrage opportunity involving the DEFI cryptocurrency: it trades at $0.003200 on Bybit, compared to only $0.002390 on MEXC.
I recall encountering a similar situation with Shiba Inu, when the price gap between Binance and Coinbase was as high as 8X. Feel free to play the chart below to see the outcome:
I also remember the 2016–2017 period, when such arbitrage opportunities existed even with Bitcoin, due to price discrepancies between Asian exchanges and those available to European traders.

SCHW The Charles Schwab Corporation Options Ahead of EarningsIf you haven`t sold SCHW before the sell-off:
Now analyzing the options chain and the chart patterns of SCHW The Charles Schwab Corporation prior to the earnings report this week,
I would consider purchasing the 92.5usd strike price Calls with
an expiration date of 2026-1-16,
for a premium of approximately $7.15.
If these options prove to be profitable prior to the earnings release, I would sell at least half of them.
Disclosure: I am part of Trade Nation's Influencer program and receive a monthly fee for using their TradingView charts in my analysis.

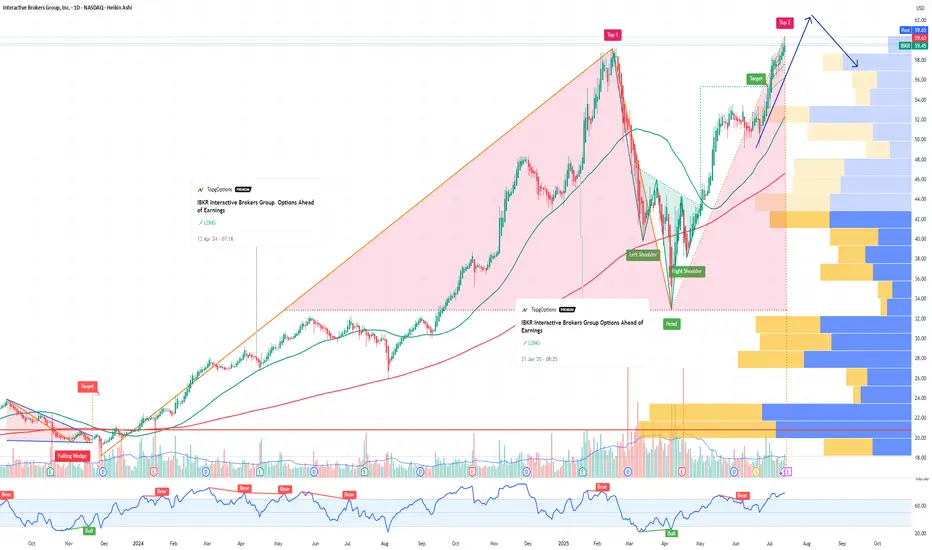
IBKR Interactive Brokers Group Options Ahead of EarningsIf you haven`t bought IBKR before the rally:
Now analyzing the options chain and the chart patterns of IBKR Interactive Brokers prior to the earnings report this week,
I would consider purchasing the 60usd strike price Calls with
an expiration date of 2025-9-19,
for a premium of approximately $3.90.
If these options prove to be profitable prior to the earnings release, I would sell at least half of them.
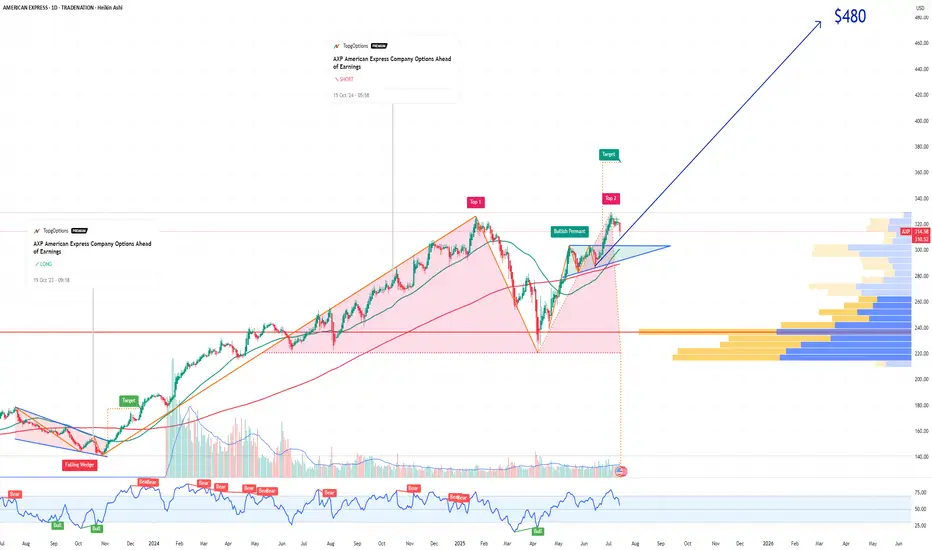
AXP American Express Company Options Ahead of EarningsIf you haven`t bought AXP before the rally:
Now analyzing the options chain and the chart patterns of AXP American Express Company prior to the earnings report this week,
I would consider purchasing the 480usd strike price Calls with
an expiration date of 2027-1-15,
for a premium of approximately $6.25.
If these options prove to be profitable prior to the earnings release, I would sell at least half of them.
Disclosure: I am part of Trade Nation's Influencer program and receive a monthly fee for using their TradingView charts in my analysis.
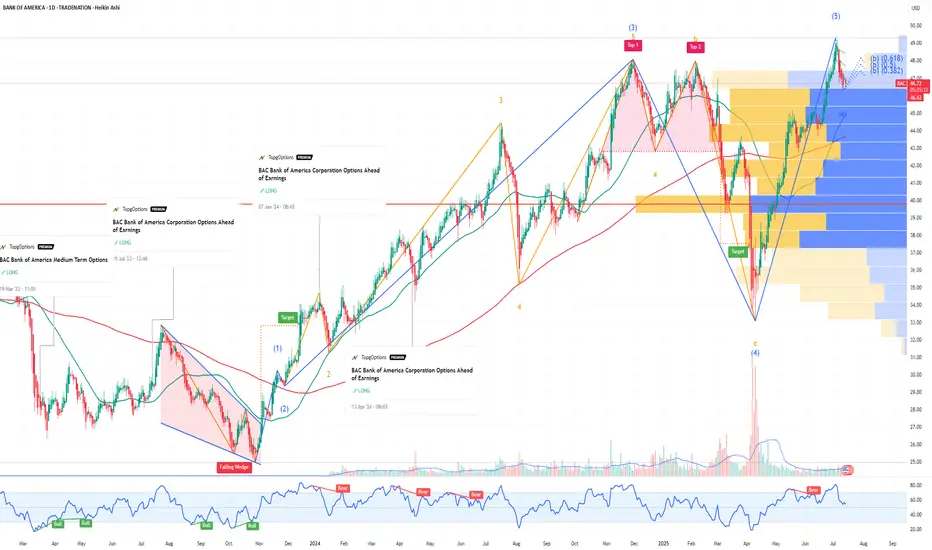
BAC Bank of America Corporation Options Ahead of EarningsIf you haven`t bought BAC before the rally:
Now analyzing the options chain and the chart patterns of BAC Bank of America Corporation prior to the earnings report this week,
I would consider purchasing the 48usd strike price Calls with
an expiration date of 2025-7-18,
for a premium of approximately $0.34.
If these options prove to be profitable prior to the earnings release, I would sell at least half of them.
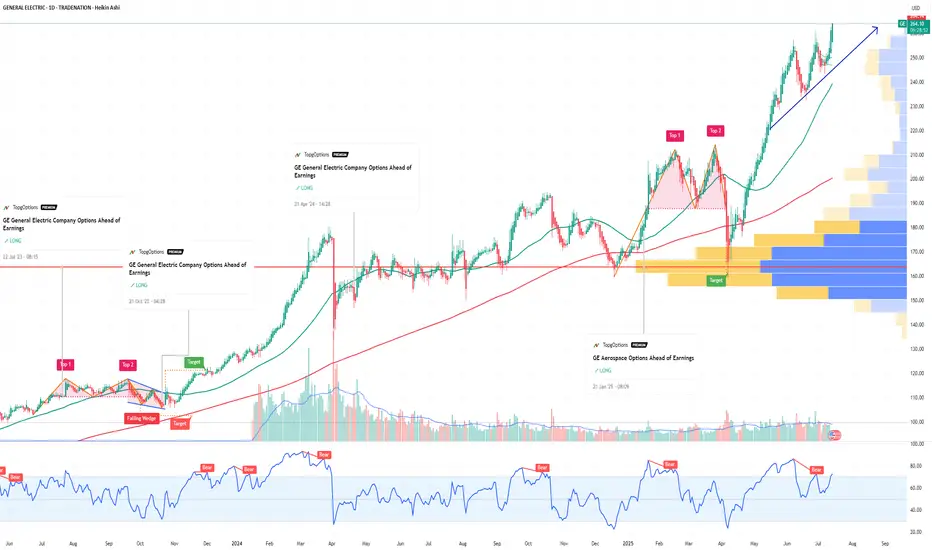
GE Aerospace Options Ahead of EarningsIf you haven`t bought GE before the rally:
Now analyzing the options chain and the chart patterns of GE Aerospace prior to the earnings report this week,
I would consider purchasing the 270usd strike price Calls with
an expiration date of 2025-8-15,
for a premium of approximately $8.60.
If these options prove to be profitable prior to the earnings release, I would sell at least half of them.
Disclosure: I am part of Trade Nation's Influencer program and receive a monthly fee for using their TradingView charts in my analysis.
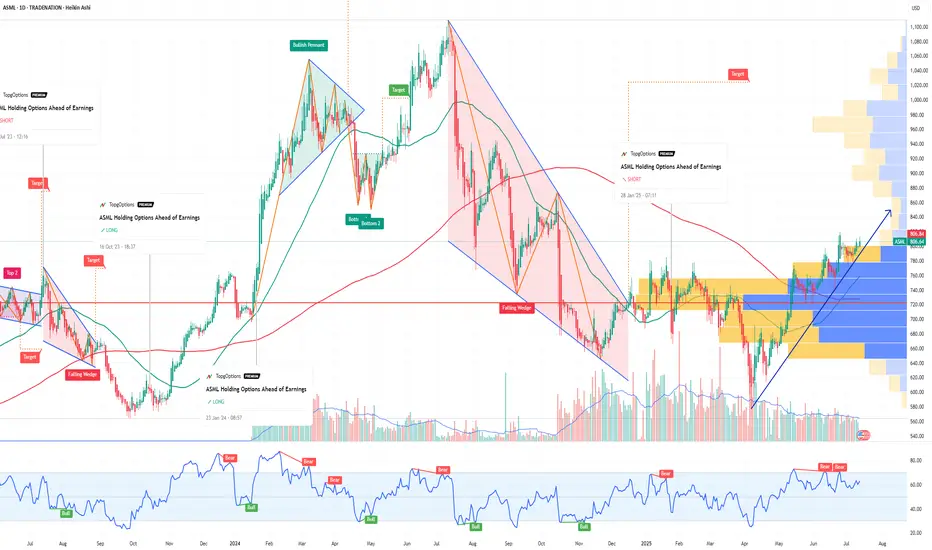
ASML Holding Options Ahead of EarningsIf you haven`t bought the dip on ASML:
Now analyzing the options chain and the chart patterns of ASML Holding prior to the earnings report this week,
I would consider purchasing the 800usd strike price Calls with
an expiration date of 2025-7-25,
for a premium of approximately $32.00.
If these options prove to be profitable prior to the earnings release, I would sell at least half of them.
Disclosure: I am part of Trade Nation's Influencer program and receive a monthly fee for using their TradingView charts in my analysis.
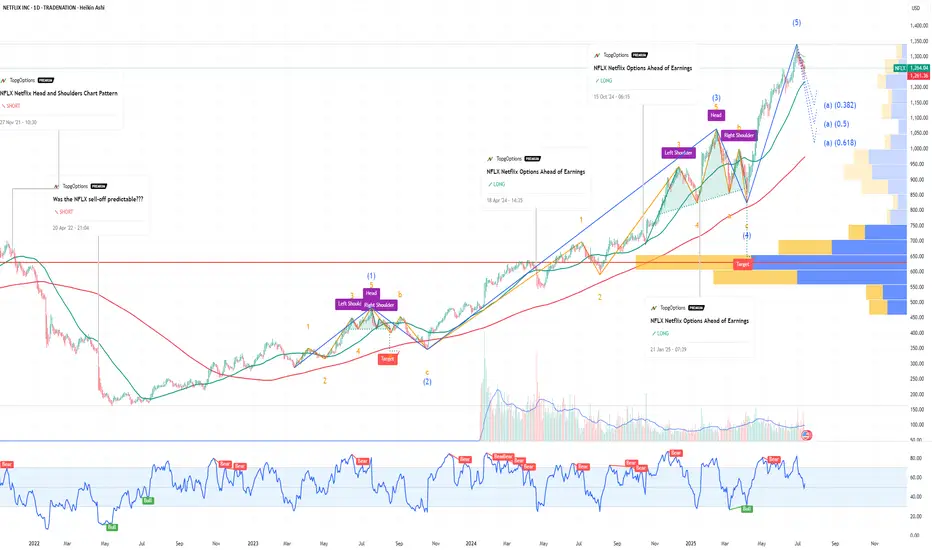
NFLX Netflix Options Ahead of EarningsIf you haven`t bought NFLX before the previous earnings:
Now analyzing the options chain and the chart patterns of NFLX Netflix prior to the earnings report this week,
I would consider purchasing the 1260usd strike price Puts with
an expiration date of 2025-9-19,
for a premium of approximately $71.10.
If these options prove to be profitable prior to the earnings release, I would sell at least half of them.
Disclosure: I am part of Trade Nation's Influencer program and receive a monthly fee for using their TradingView charts in my analysis.