Why IonQ (IONQ) Could Be the NVDA of Quantum ComputingIf you haven`t bought IONQ before the rally:
Now you need to know that IonQ isn’t just another speculative quantum stock — The company is building a robust ecosystem around its best‑in‑class trapped‑ion architecture and targeting fault‑tolerant, networked quantum systems. With record bookings, major acquisitions, and a strong balance sheet, IonQ could emerge as the NVIDIA equivalent for quantum infrastructure.
Key Bullish Arguments
1) Superior Quantum Tech – Trapped‑Ion Advantage
IonQ’s trapped-ion processors boast 99.9% two-qubit fidelity, demonstrating higher accuracy and scalability than superconducting alternatives
These systems also operate at room temperature, meaning simpler deployment and lower costs
2) Ecosystem Strategy & Acquisitions
The $1.08B acquisition of Oxford Ionics (expected close in 2025) expands IonQ’s qubit control tech, pushing toward planned 80,000 logical‑qubit systems by decade’s end
Combined with ID Quantique and Lightsynq, IonQ is building a full-stack quantum and networking offering
3) Strong Revenue Growth & Cash Runway
Revenue soared from $22M in 2023 to $43.1M in 2024, with bookings of $95.6M
. Q1 2025 saw $7.6M revenue and EPS –$0.14, beating expectations; cash reserves near $697M provide years of runway
4) Real Commercial Deployments
IonQ sold its Forte Enterprise quantum system to EPB ($22M deal) for hybrid compute and networking, marking real-world commercial applications
5) AI & Quantum Synergy
Involvement in NVIDIA’s Quantum Day and hybrid quantum‑classical AI demos (e.g., blood pump simulation with Ansys, ~12 % faster) indicates strategic synergy and positions IonQ as a critical piece in the future AI stack
Recent Catalysts:
Texas Quantum Initiative passes – positions IonQ at forefront of U.S. state-backed innovation
Oxford Ionics acquisition pending – major expansion in qubit scale & tech
Barron’s analyst buys – industry analysts see long-term potential; IonQ among top quantum picks
Broader quantum optimism – McKinsey & Morgan Stanley forecasts highlight synergy between quantum and AI, benefiting IonQ
Buy-sell-signals

XAUUSD Gold Trading Strategy July 3, 2025XAUUSD Gold Trading Strategy July 3, 2025:
Yesterday's trading session went in line with our prediction when the gold price approached the 332x support area and then bounced back strongly. However, at the beginning of today's Asian session, the price corrected sharply after peaking at 3365.
Fundamental analysis: The number of ADP jobs in the United States recorded a decrease of 33,000 in June, the lowest since March 2023, which shows that the labor market is clearly weakening, raising concerns about the slowdown of the US economy.
Technical analysis: After approaching the 332x support area, the gold price bounced back strongly, currently the gold price is still following the MA 20. We will wait at the support areas to be able to trade, however, today's reports and news can strongly influence, leading to unpredictable fluctuations in the gold price; In addition, we should also be careful before the short profit-taking phase that may occur today or tomorrow.
Important price zones today: 3322 - 3327, 3338 - 3343 and 3375 - 3380.
Today's trading trend: BUY (scalp).
Recommended orders:
Plan 1: BUY XAUUSD zone 3337 - 3339
SL 3334
TP 3342 - 3350 - 3360 - 3380.
Plan 2: BUY XAUUSD zone 3322 - 3324
SL 3319
TP 3327 - 3340 - 3360 - 3380.
Plan 3: SELL XAUUSD zone 3378 - 3380
SL 3383
TP 3375 - 3365 - 3355 - 3345 - Open (small vol).
Wish you a safe and profitable trading day.🌟🌟🌟🌟🌟

QQQ Nasdaq 100 Year-End Price Target and Technical Rebound SetupIf you haven`t bought the previous oversold area on QQQ:
Now the Nasdaq-100 ETF (QQQ), which tracks the performance of the largest non-financial companies in the Nasdaq, has recently entered oversold territory, suggesting that a technical rebound may be imminent. Similar to the Russell 2000, QQQ has experienced significant selling pressure, driving key technical indicators into oversold zones and creating favorable conditions for a bounce.
The Relative Strength Index (RSI) has dropped below 30, a level that typically signals oversold conditions and the potential for a reversal. Additionally, QQQ is trading near key support levels, with a large portion of its components underperforming their 50-day and 200-day moving averages — a classic setup for a mean reversion rally.
From a historical perspective, QQQ has shown a tendency to rebound strongly after similar oversold conditions, particularly when macroeconomic factors stabilize and buying pressure returns. Given the current technical setup, my price target for QQQ is $550 by the end of the year. This represents a recovery of approximately 8-10% from current levels, aligning with previous post-oversold rallies in the index.
While downside risks remain — including potential volatility around Federal Reserve policy and broader economic data — the technical backdrop suggests that QQQ is well-positioned for a recovery in the coming months.

GME GameStop - A Crypto Proxy with Surprise UpsideIf you haven`t bought GME before the previous rally:
Why GME Could Rally by Year-End 2025:
1. Hidden Bitcoin Exposure
GameStop recently revealed it holds a significant amount of Bitcoin on its balance sheet — quietly positioning itself as a crypto proxy in the equity markets.
While not a traditional miner or crypto company, GME gives exposure to BTC upside without being a pure-play crypto stock.
With Bitcoin aiming for new highs in 2025, any company with BTC on its books becomes more valuable — just as we saw with Tesla and MicroStrategy in prior cycles.
2. Retail Speculation and Meme Momentum
GME has always been a retail-fueled stock, and retail interest is surging again in crypto and meme trades.
As crypto enters a new speculative phase, GME could benefit from a reflexive feedback loop: BTC goes up → GME gains attention → more retail FOMO → GME rises.
Recent reappearance of figures like Roaring Kitty has reignited interest — and if crypto sentiment stays hot, GME could ride that wave.
3. Lean Balance Sheet and Optionality
After multiple share offerings, GameStop is flush with cash and minimal debt — giving it financial flexibility.
Holding BTC enhances its treasury strategy during inflationary or weak-dollar cycles.
This also gives it optionality to enter Web3, NFTs (again), or even blockchain gaming — areas where its brand could carry weight.
Technical Setup
GME is consolidating above key support in the $20–23 zone, forming a potential bull flag or base for another breakout.
Any breakout in Bitcoin or renewed meme-stock energy could push GME to test $35–40, or even $50+ if momentum returns.
Final Thoughts
GME may not be a traditional crypto stock, but it’s now quietly tied to Bitcoin performance. With crypto heating up and retail risk appetite returning, GameStop becomes a speculative bet on BTC, memes, and volatility — all in one ticker.
Disclosure: I am part of Trade Nation's Influencer program and receive a monthly fee for using their TradingView charts in my analysis.

Baidu ($BIDU): China’s Google Is Ready to Break OutIf you haven`t bought BIDU on the previous dip:
What you need to know now:
1. Baidu = The Google of China
Baidu dominates China’s search engine market, holding over 60% market share, making it the Google equivalent in the world's second-largest economy.
Its advertising business is deeply entrenched in Chinese internet infrastructure.
As digital ad spending rebounds in China, Baidu’s core business benefits directly.
2. AI and Autonomous Driving Moonshots
Baidu is China’s national AI champion, pouring billions into next-gen technologies:
Ernie Bot (Baidu’s ChatGPT competitor) is now integrated across its ecosystem and enterprise offerings.
Apollo Go, Baidu’s autonomous driving platform, already operates robo-taxis in multiple Chinese cities and has received licenses for fully driverless operations.
Baidu also provides AI cloud services, competing with Alibaba Cloud and Huawei.
With the Chinese government pushing AI self-sufficiency, Baidu is one of the biggest beneficiaries.
3. Cheap Valuation with High-Tech Exposure
Baidu trades at a forward P/E under 10 and price-to-sales under 2, despite being a major player in AI, cloud, and mobility.
That’s a fraction of what US tech firms with similar ambitions (like Alphabet or Tesla) are valued at.
Over $25 billion in cash and investments on the balance sheet adds a margin of safety.
4. Government Support & Stimulus Tailwinds
The Chinese government is pivoting back toward supporting tech innovation, especially in AI, after years of regulatory crackdowns.
Baidu is aligned with national AI and autonomous driving goals.
If the government ramps up fiscal stimulus, especially in infrastructure and technology, Baidu will likely benefit.
Disclosure: I am part of Trade Nation's Influencer program and receive a monthly fee for using their TradingView charts in my analysis.

MU Micron Technology Options Ahead of EarningsIf you haven`t bought MU before the rally:
Now analyzing the options chain and the chart patterns of MU Micron Technology prior to the earnings report this week,
I would consider purchasing the 128usd strike price Calls with
an expiration date of 2025-6-27,
for a premium of approximately $5.52.
If these options prove to be profitable prior to the earnings release, I would sell at least half of them.
Disclosure: I am part of Trade Nation's Influencer program and receive a monthly fee for using their TradingView charts in my analysis.

PTON Peloton Potential Buyout Interest from Amazon or NikeIf you haven`t bought the dip on PTON, before the rally:
Now Peloton Interactive PTON remains a compelling bullish candidate in 2025, supported not only by strategic buyout interest from major players like Amazon and Nike but also by significant unusual options activity signaling strong investor conviction in a near-term upside move. These factors combined create a powerful catalyst for a potential stock rally.
1. Confirmed Buyout Interest from Amazon and Nike
Since 2022, credible reports have indicated that Amazon and Nike are exploring acquisition opportunities for Peloton, recognizing its value as a leading connected fitness platform with over 2 million subscribers.
Amazon’s interest fits its broader health and smart home ambitions, while Nike sees Peloton as a strategic extension of its digital fitness ecosystem.
Such buyout interest implies a potential premium valuation, which could trigger a sharp upward re-rating of Peloton’s shares if a deal materializes or even if speculation intensifies.
2. Massive Unusual Call Option Activity for July 18, 2025 Expiry
A mystery trader recently purchased over 80,000 call options on Peloton with a $7 strike price expiring July 18, 2025, representing a $3.1 million bet on a price rise within the next few months.
On May 20, 2025, over 90,000 contracts of the $7 strike call expiring July 18, 2025 traded, equating to roughly 9 million underlying shares—well above Peloton’s average daily volume.
This unusually high call volume signals strong bullish sentiment and possible insider or institutional anticipation of a positive event, such as a buyout announcement or operational turnaround.
3. Strategic Fit and Synergies for Acquirers
Peloton’s subscription-based connected fitness platform offers Amazon and Nike a valuable recurring revenue stream and engaged user base.
Amazon could integrate Peloton’s offerings into its ecosystem of devices, health services, and e-commerce, while Nike could leverage Peloton’s content and hardware to deepen its digital fitness presence.
The potential for cross-selling, brand synergy, and data monetization enhances Peloton’s attractiveness as an acquisition target.
4. Attractive Valuation and Growth Potential
Peloton’s market cap has contracted significantly, making it an affordable target for large corporations with strategic interests in health and fitness.
Recent product launches, cost-cutting measures, and renewed marketing efforts aim to stabilize and grow Peloton’s subscriber base and revenue.
The connected fitness market continues to expand, driven by consumer demand for at-home and hybrid workout solutions.
5. Technical and Sentiment Indicators
The stock has shown signs of stabilizing after recent volatility, with support forming near $6–$6.50.
The surge in call options activity, especially at strikes above current prices, suggests growing investor confidence in a near-term breakout.
Historical patterns show Peloton’s stock reacts strongly to buyout rumors and unusual options volume, often resulting in rapid price appreciation.
Disclosure: I am part of Trade Nation's Influencer program and receive a monthly fee for using their TradingView charts in my analysis.

AAOI Applied Optoelectronics potential rally by EOYApplied Optoelectronics AAOI is well-positioned for a strong rally toward $24 per share by the end of 2025, supported by multiple operational and strategic catalysts. A key recent development—the warrant agreement with Amazon—adds a powerful endorsement and financial backing that enhances the bullish case.
1. Amazon’s Strategic Warrant Agreement: A Major Vote of Confidence
On March 13, 2025, AAOI issued a warrant to Amazon.com NV Investment Holdings LLC, granting Amazon the right to purchase up to approximately 7.95 million shares at an exercise price of $23.70 per share.
About 1.3 million shares vested immediately, with the remainder vesting based on Amazon’s discretionary purchases, potentially up to $4 billion in total purchases over time.
This agreement signals Amazon’s strong confidence in AAOI’s technology and its critical role as a supplier of high-speed optical transceivers for Amazon Web Services and AI data center infrastructure.
The warrant price near $24 effectively sets a floor and a valuation benchmark, supporting the thesis that AAOI’s stock could reach or exceed this level by year-end.
2. Major Data Center Wins and Hyperscale Customer Re-Engagement
AAOI recently resumed shipments to a major hyperscale customer, with volume shipments of high-speed data center transceivers expected to ramp significantly in the second half of 2025.
This re-engagement with a key customer aligns with the surging demand for AI-driven data center infrastructure, providing a strong revenue growth catalyst.
3. Robust Revenue Growth and Margin Expansion
Q1 2025 revenue doubled year-over-year to nearly $100 million, with gross margins expanding to over 30%, reflecting operational efficiencies and favorable product mix.
The company expects to sustain strong quarterly revenue ($100–$110 million) and ramp production capacity to over 100,000 units of 800G transceivers per month by year-end, with 40% manufactured in the U.S.
4. Manufacturing Expansion and Supply Chain Resilience
AAOI is scaling manufacturing in the U.S. and Taiwan, enhancing supply chain robustness and positioning itself to benefit from potential government incentives for domestic production.
Its automated, largely in-house manufacturing capabilities provide a competitive edge in meeting hyperscale and AI data center demand.
In conclusion:
Amazon’s warrant agreement at a $23.70 strike price not only provides a direct valuation anchor near $24 but also serves as a powerful strategic endorsement of AAOI’s technology and growth prospects. Combined with robust revenue growth, expanding manufacturing capacity, and key customer re-engagement, AAOI has a compelling case to reach or exceed $24 per share by the end of 2025.

MDB MongoDB Options Ahead of EarningsIf you haven`t exited MDB before the selloff:
Now analyzing the options chain and the chart patterns of MDB MongoDB prior to the earnings report this week,
I would consider purchasing the180usd strike price Puts with
an expiration date of 2025-6-6,
for a premium of approximately $4.95.
If these options prove to be profitable prior to the earnings release, I would sell at least half of them.

DOCU DocuSign Options Ahead of EarningsIf you haven`t bought DOCU before the previous earnings:
Now analyzing the options chain and the chart patterns of DOCU DocuSign prior to the earnings report this week,
I would consider purchasing the 93usd strike price Calls with
an expiration date of 2025-6-6,
for a premium of approximately $4.80.
If these options prove to be profitable prior to the earnings release, I would sell at least half of them.
Disclosure: I am part of Trade Nation's Influencer program and receive a monthly fee for using their TradingView charts in my analysis.

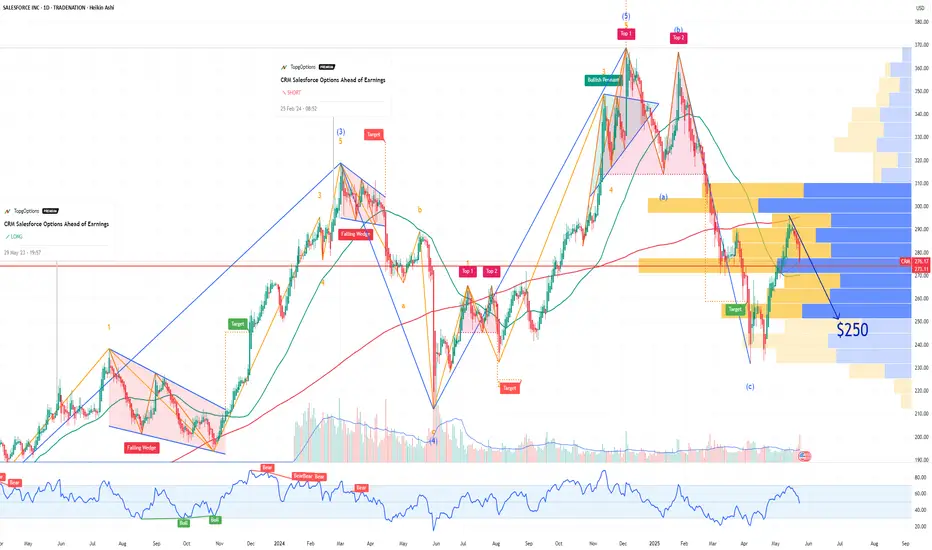
CRM Salesforce Options Ahead of EarningsIf you haven`t bought CRM before this rally:
nor sold this top:
Now analyzing the options chain and the chart patterns of CRM Salesforce prior to the earnings report this week,
I would consider purchasing the 250usd strike price Puts with
an expiration date of 2025-6-20,
for a premium of approximately $5.15.
If these options prove to be profitable prior to the earnings release, I would sell at least half of them.
Disclosure: I am part of Trade Nation's Influencer program and receive a monthly fee for using their TradingView charts in my analysis.
DELL Technologies Options Ahead of EarningsIf you haven`t bought the recent dip:
Now analyzing the options chain and the chart patterns of DELL Technologies prior to the earnings report this week,
I would consider purchasing the 110usd strike price Puts with
an expiration date of 2025-9-19,
for a premium of approximately $8.90.
If these options prove to be profitable prior to the earnings release, I would sell at least half of them.
I`m bullish long term on DELL though.
Disclosure: I am part of Trade Nation's Influencer program and receive a monthly fee for using their TradingView charts in my analysis.

COST Costco Wholesale Corporation Options Ahead of EarningsIf you haven`t bought COST before the rally:
Now analyzing the options chain of COST Costco prior to the earnings report this week,
I would consider purchasing the 800usd strike price Puts with
an expiration date of 2027-1-15,
for a premium of approximately $42
If these options prove to be profitable prior to the earnings release, I would sell at least half of them.

Gold Loses 3,220 – Will It Fall Further?Gold has just broken through the 3,220 support and closed the H4 candle at $3,213/ounce. The strong red candle with volume shows that the sellers are still in control. I saw the EMA34 cut down to the EMA89 early and maintained a negative slope – confirming a clear downtrend.
I am watching the 3,180 – 3,200 zone as the next target. If the price rebounds but does not surpass 3,240, I will continue to sell. The current situation is not suitable for buying against the trend, especially when the USD is still strong and the safe-haven sentiment is decreasing.

Gold breaks through 3,300 – Selling pressure has not stoppedGold price plummeted from 3,325 to 3,237 USD/ounce after the US and China reached a temporary agreement to reduce taxes. The stock market is up, the USD is strong, money flows out of gold. I see selling pressure clearly dominating.
On H1, the price is still below EMA34 and EMA89, recovering weakly around 3,260. H4 confirms the downtrend that has been formed before. If it does not surpass 3,270, I am inclined to believe that gold will continue to fall to 3,200 – 3,180.

Gold Breaks Support Level – The Downtrend May Not StopAfter peaking at $3,500/ounce in April, gold is in a clear correction phase. On the H4 chart, the price has broken through both the EMA34 and EMA89, indicating that a short-term downtrend has been established. The most recent session closed at $3,223, losing nearly $130 in just a few sessions.
The sharp decline appeared after a long rally and the peak was rejected many times. The break through the EMA89 support has triggered technical selling pressure, reflecting the psychology of profit-taking after failing to surpass the old peak.

Gold falls after FED news, cautious buying powerWorld gold prices retreated to $3,370/ounce, down more than $25 from last night's peak. The H4 chart shows a sharp decline that broke through the EMA34, currently testing the EMA89 - a signal that profit-taking pressure is increasing after the previous strong bounce.
The FED kept interest rates unchanged in the 4.25% - 4.5% range, as expected. However, Chairman Jerome Powell's "wait and see" statement made investors pause buying gold due to concerns that prolonged high interest rates will continue to put pressure on non-yielding assets like gold. In addition, the rise in international stocks and China's money pumping policy have reduced the attractiveness of this safe haven.

COIN Coinbase Global Options Ahead of EarningsIf you haven`t bought COIN before the recent rally:
Now analyzing the options chain and the chart patterns of COIN Coinbase Global prior to the earnings report this week,
I would consider purchasing the 220usd strike price Calls with
an expiration date of 2025-8-15,
for a premium of approximately $18.90.
If these options prove to be profitable prior to the earnings release, I would sell at least half of them.
Disclosure: I am part of Trade Nation's Influencer program and receive a monthly fee for using their TradingView charts in my analysis.

MARA Holdings Options Ahead of EarningsIf you haven`t bought MARA before the recent rally:
Now analyzing the options chain and the chart patterns of MARA Holdings prior to the earnings report this week,
I would consider purchasing the 13usd strike price Calls with
an expiration date of 2025-5-30,
for a premium of approximately $1.38.
If these options prove to be profitable prior to the earnings release, I would sell at least half of them.

TTD The Trade Desk Options Ahead of EarningsIf you haven`t bought TTD before the recent rally:
Now analyzing the options chain and the chart patterns of TTD The Trade Desk prior to the earnings report this week,
I would consider purchasing the 55usd strike price Calls with
an expiration date of 2025-6-20,
for a premium of approximately $6.70.
If these options prove to be profitable prior to the earnings release, I would sell at least half of them.

QURE uniQure Options Ahead of EarningsAnalyzing the options chain and the chart patterns of QURE uniQure prior to the earnings report this week,
I would consider purchasing the 15usd strike price Calls with
an expiration date of 2026-1-16,
for a premium of approximately $2.32.
If these options prove to be profitable prior to the earnings release, I would sell at least half of them.

Gold surges thanks to China buying goods, waiting for FED waveInternational gold prices jumped to 3,332 USD/ounce, up more than 72 USD compared to the bottom of last night's session. The main driving force came from the wave of gold buying in China, when concerns about the weakening economy caused people to massively turn to gold as a safe haven. The H4 chart shows a strong increase, EMA34 has crossed EMA89, establishing a clear short-term uptrend. If gold surpasses 3,340 USD, it is likely to head towards the old peak around 3,420–3,500 USD.
Crude oil prices are still fluctuating strongly around 57.2 USD/barrel, creating an unstable foundation for the commodity market. The FED will announce its policy in the early morning of May 8. Although it is expected to not change interest rates, any statement can move the market. This will be the next big catalyst for gold.

Gold price suddenly accelerates, approaching the 3,300 USD/ounceAfter two consecutive weeks of decline, the world gold price is showing strong signs of recovery when it skyrocketed to 3,266 USD/ounce - an increase of 25 USD in just one session. Although still quite far from the peak of 3,500 USD/ounce, the increase this morning shows that investor sentiment has begun to change direction.
The increase occurred at the beginning of the session despite previous negative forecasts, reflecting the sensitivity of gold to geopolitical and economic information such as US-China trade negotiations or the strength of the USD. The daily chart shows that gold has bounced strongly from the EMA34 support zone and returned to the resistance zone around 3,320–3,340 USD, opening up an opportunity to retest the 3,400 USD mark if the current increase is maintained.
