Buy-signal

$INS Insolar Binance Buy Signal Pump Alert ReversalMany investors sold because of confusion of the token swap. All you need to do is go all in and buy $INS because this investment will 3X!
Easy Profits!

GBPJPY Daily analisysDaily timeframe is giving us signs of a possible new bullish momentum where right nice we can see how price failed to break right below the previous bearish structure that lines up with the monthly PRZ,EMA,ascendign daily TL and daily support going back to the 143.00 area after 4 tries to break below it so if daily close above the mentioned level and keep holdin above the 61% fib we might see a push atleast to the 146.00 area

Possible BUY signal on WAVES/BTCPossible Buy signal on Waves/BTC
After trend change on mid Dec 2019 we have a nice pullback between the 79SMA and 89EMA
Stop loss to set below the lowest SMA
Take profit split by two steps, first on around 0.0001275, the last on 0.00015 just below previous highs
Hope this will help
Good luck and good trading

$APPC Appcoins AT Binance Pump Alert Buy Signal ReversalAppcoins Reversal From Near Alltime lows About to 2X To 3X

THE STRONGEST MOVEMENT IN """ BTCUSD """ will happen Now "UP"Bitcoin will let all crypto market move strong up , this moment wee wit it long time 6 month until yesterday we record the lowest price $7115 and now start very strong trend up and BTCUSD will break $9400 fast and will touch the $14000 and break it and we will go to break $20000
and than in 90 days we will may touch $76000
i Had study the market this movement and wit it more than 9 months agao and the time for it is come , so keep watch it and dont forget to keep from time to time to watch my post
we will have first strong movement than after 10 dayes we will have some waves down than we will back strongly up
i hop the best for every oe , and i feel great to share that with you

Bitcoin Strong Strong UP UP UP, the Best analysis 2020 Bitcoin will let all Crypto market move strong up , this moment wee wit it long time 6 month until yesterday we record the lowest price $7115 and now start very strong trend up and BTCUSD will break $9400 fast and will touch the $14000 and break it and we will go to break $20000
and than in 90 days we will may touch $76000
i Had study the market this movement and wit it more than 9 months agao and the time for it is come , so keep watch it and dont forget to keep from time to time to watch my post
we will have first strong movement than after 10 dayes we will have some waves down than we will back strongly up
Will Break * $10590 * than * $14072 * than * $18369 * than * $25322 * than * $32275 * than * $36571 *
i hop the best for every one , and i feel great to share that with you
some people will ask how you know that i tell them work hard 13 years working is not easy and only who will help you and guide you is GOD not us or our learning
Regarding
Your lovely friend

EURGBP LONGWe need to see the correct bullish signs at 0.85000 for longs. Also think we can touch the ascending trendline for the third time which is in correlation with a 4 hr key level. good risk to reward of 1 to 4.

USDCHF Trade IdeaHello Traders,
BUY SIGNAL
USDCHF 4H CHART
Price of Entry: 0.98205
SL: 0.97638
TP: 0.98917
Estimated time to complete:
14 days (Use Low Risk)

CADJPY POTENTIAL SELLnice potential head and shoulders forming off daily resistance. If we get a nice rejection off the right shoulder and .500 key level we could see CADJPY fall out the sky. We also have a brilliant counter trendline break. brilliant risk to reward. big cad news on Monday but apart from that we should see a relatively slow week coming into christmas


USD CHF LONGUSD CHF, Been hitting this resistance line for the last weeks..
Huge buy potential here, with 30 pips SL risk!


$APPC REVERSAL BUY SIGNAL PUMP ALERT I first believed this project was a shitcoin. However many supporters of the project informed me of its development, strategy And team...
On the guetto TA, while btc has dramatically fallen appcoins remained somewhat stable in a wedged pattern.
The volume is low, it’s near alltime lows, and almost a small enough socail media following you wouldnt notice.
Do your own research, this is a sleeper about to awaken.

AUDCHF SELLAll time frames we are bearish. if we see rejection in the red highlighted region we will look to sell for a reward of 200+pips.
Could possibly form a head and shoulders pattern and see a nice downfall for this pair.

NEO on a BULL RUNYet another confirmation that NEO is going to skyrocket. Next couple of months there should be a strong bull run!

ONT/BTC 3 Months of uptrendAccording to fibonacci cycles, ONT/BTC is likely to enter a bull cycle soon. It should last till the end of the year.

Long theories for BITCOIN (Where ends wave "E" of correction?)as the chart is shown, there are two situations for the uptrend.
*** the PURPLE or the BLACK one? ***** ;)

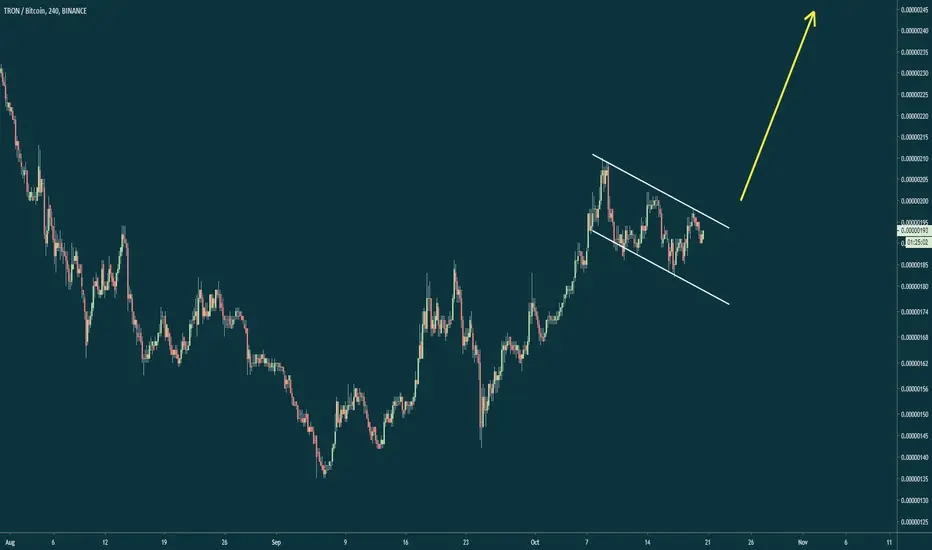
Tron / BTC Bull flag - rally is about to beginTron showing very positive tendency against the bitcoin. I'd expect the rally to continue very very soon.
XAUUSD Gold -- Long -- 4 Hour ChartLong XAUUSD GOLD on pullback to support zone & 38% fib
Entry -- 1486.285
Take Profit -- 1511.632
Stop Loss -- 1480.357
RR 4-1
For a RR of 3.1 move stop loss -- 1478.109

Bitcoin: Two Weeks And Second Buy Signal Appears?We have been long Bitcoin for just over two weeks, and today it has generated a second buy signal in terms of our swing trade strategy. Since price action has been very random and indecisive, we will not add to our swing trade long, because there is no need to increase our risk. In this article I will point out what has changed since the short squeeze off of the 7600 support, and why WAITING has allowed us to weather the randomness successfully.
It all begins with knowing where you are on the roadmap and what is reasonable to expect at such a location. Evaluating larger time frames and using proven frameworks such as Elliott Wave help to paint a realistic picture. Since the 14K area high established months ago, Bitcoin has been in a corrective consolidation, NOT A TREND. This is a key piece of information since it shapes our tactics and expectations as the market unfolds.
Here are the technical points that we are considering in light of the current price structure:
1. The 9K range support break WAS bearish BUT Bitcoin weakness has FAILED to follow though. Moves like this lure lots of small time frame shorts and stimulate lots of over exaggerated price projections. These are the participants who further contribute to the buying pressure that culminates into a dramatic short squeeze once they all realize bearish order flow has been absorbed. Although 5K is technically possible, the probability is relatively LOW.
2. There is a CLEAR double bottom formation established around the 7600 to 7700 area which provides evidence that buyers are present.
3. There is a higher low established at 8220. This shows buyers are not only present, but NOW in control. It is too early to call this a trend in terms of the bigger picture, BUT typically higher lows are followed by HIGHER HIGHS.
4. As far as Elliott Wave, the broad price structure (14K high to 7600 low) fits the rules of a Wave 2 correction. IF the 7600 area is NOT compromised, the next bullish leg can be the initial wave of a broad Wave 3 (which can lead price to test 14K over the next couple of months). Keep in mind, IF the 7600 support is compromised instead, it increases the chances of price testing the next support zone of 7275 or lower. In theory Wave 2 can retrace 100% of Wave 1 (3150) and still be in a position to rally.
5. The next nearest resistance level is the 9700 to 10250 zone (once 8500 is cleared). This area continues to be our target profit taking zone. Besides being a proportional inflection point (.618 of 11K high to 7700 low), it also overlaps the 10K psychological level which can also have an effect. We are interested in proportional targets NOT unrealistic or improbable targets relative to the time horizon of our SWING TRADE strategy.
Market timing is NOT about making "predictions". The financial entertainment outlets and online communities love to "predict" things. The word implies an absolute outcome and NO financial market behaves this way. It is ALL ABOUT "IF THIS, THEN THAT". Evaluating price action, gauging probabilities and risk, and then ANTICIPATING a RANGE of scenarios to take action upon IF they appear.
WAITING is a key aspect of successful market timing. In this day and age, NO ONE likes to wait. Taking action or making things happen may work at your 9 to 5 job, but it will have an adverse effect in a highly random and uncertain environment like a financial market.
We have been in a swing trade long for two weeks which triggered at 8425, and today has met our criteria for the same trade AGAIN. We made no adjustments and sat through the adverse price action that had everyone selling into the high 7Ks. NO ACTION on our part has lead to no account erosion and no string of losing trades like so many had to face in recent weeks.
WAITING is part of the defensive mindset that is built into our swing and position trade strategies. It is the most definitive element behind our consistently profitable track record. Like I have written many times, WAITING is a very EASY concept for anyone to understand, but by far the MOST DIFFICULT to practice.
Which sheds light on a very valuable lesson that most new investors and traders completely miss: it does NOT matter how well you can read a chart or financial statement, what matters is how well you are in CONTROL of your emotional state. Greed and fear (emotions) drive short term price action, do you capitalize (anticipate) or succumb (react)? Your answer will correlate to your performance.

BTCUSDTThere is a divergence in RSI And MACD.
The chart says it all.
If you like the idea, please, hit the Like button and subscribe to the profile in order not to miss our updates.
The information given is never financial advice. Always do your own research.
