Byteball Rolling UpBytebal slowly but steadily rising and after each correction producing a new high. After reaching the recent high at $1188 price declined back to the 8/1 Gann Fan trendline, which was successfully rejected.
At this point, the uptrend is likely to continue and GBYTE/USD could test $1500-1600 area, where are two Fibonacci retracement levels applied to the last two corrective waves down. It should be kept in mind that the key support remains at $355 and only break and close above it could invalidate bullish outlook. At the same time, break above the upside target would confirm a further uptrend, while rejection should result in a short to medium term change in trend.
Buy-signal

Wings DAO vs Bitcoin - Support RejectedWings hit the low and found the support at 3k satoshi. The uptrend followed breaking above the 200 Moving Average as well as the descending channel reaching the 16k satoshi high. Throughout the rise, price rejected the 200 Moving Average and now on the corrective move down, it has been rejected once again two times, suggesting the continuation of the uptrend.
The probability of WINGS/BTC going up remains very high, where the potential upside wave up could reach 361.8% Fibonacci retracement at 22k satoshi, that corresponds with the extended trendline of the descending channel. On a downside, break below the 6670 satoshi support could invalidate bullish outlook.

Ubiq Is Likely To Rise And Form Double TopUbiq still looks strong in the short term analysis as it continues to produce higher highs and higher lows, while failing to go lower the previous low at $2. After reaching a new all-time high at $7.4, UBQ/USD fell down substantially, losing over 60% to USD.
Although this seems to be only a corrective move down rather than a trend reversal as the drop was stopped at the previous high, that is $2.85, where 4/1 Gann Fan trendline was rejected.
Of course, the market had to take a break after the rally throughout most cryptocurrencies, but now consolidation period seems to be coming to an end and the uptrend should continue shortly, including the Ubiq. The nearest upside target is seen at 327.2% Fibonacci retracement, that is $7.8, and it yet to be seen the reaction of the market at that price. Rejection could trigger a long-term consolidation and drop back quite a lot, while a break above should confirm the uptrend continuation.

Bancor Has 150% Short Term Potential Bancor producing higher highs and higher lows thus, confirming the validity of the uptrend. All markets move in waves and Bancor is no exception. After reaching $10.8 all-time high price corrected won to $5 support level, where it was stopped by the 61.8% Fibonacci retracement levels.
At the same price, the uptrend trendline and the 200 Moving Average were rejected and price spiked up to $9.5. Now BNT/USD might continue range for a little while, but the uptrend is there and it is valid. It is a matter of time when Bancor will go higher and as the upside targets, the $15 resistance area could play a key role in the medium term. Only a break and close below the $2.8 support could invalidate bullish outlook.

Ethereum Could Jump Up To $2000Ethereum remains one of the most stable coins out there and very consistently continues to rise. Since July 2017, when consolidation has ended price went from $139 up until $1430 in just 6 months, gaining nearly 1000%.
While the price went as high as $1430, it broke and closed above the $1370 resistance, that is 427.2% Fibonacci retracement level, suggesting that the uptrend is far from over. Although price corrected won sharply and was stopped at the strong support area between $765 and $792. The support is confirmed by two Fibonacci retracement levels and the clear bounce of one of them can be witnessed. At the same time, ETH/USD rejected the 200 Moving Average and the 2/1 Gann Fan trendline adding extra confirmation of the uptrend validity.
The price could continue ranging for some time but overall it should reach the next Fibonacci retracement level at $1950 and potentially it might test the strong psychological level at $2k.

CapriCoin Broke Above The ResistanceFollowing the previous idea on CapriCoin , price broke above the strong resistance, indicating the validity of the uptrend. After the breakout price reached 18k satoshi high and then corrected back to 12k satoshi, where it is currently trading.
CPC/BTC is right in the support area, that is between 12 and 13k satoshi. At the same time it is right at the 2/1 Gann Fann trendline and from this point onwards uptrend could continue. The first strong resistance is at 20k satoshi, that is 227.2% Fibonacci retracement applied to the corrective wave after the 200 Moving Average breakout. Second resistance is 88.6% Fibs, that is 25k satoshi.
Nevertheless consolidation period is also possible prior to the uptrend continuation. In this case CapriCoin could go back to the major support area at 7k satoshi, but only break and close below that level could invalidate bullish outlook.

Factom VS Bitcoin Still An UptrendFactom is clearly trending upwards although currently, it has entered the stage of a short to medium term consolidation. Since 1st of January, FCT/BTC continue to range between btc 0.005 and 0.0035. At the same time price broke above the downtrend trendline and for the second time it returned to the point of breakout, that is btc 0.004.
Today Factom rejected the 200 Moving Average and the 2/1 Gann Fan trendline. This could suggest the uptrend continuation from this point onwards, nevertheless, consolidation could extend a little further.
The upside target is seen at 127.2% Fibonacci retracement that is btc 0.006, this price level should act as a key resistance showing further intentions of the Factom.

Qtum Trading UpQtum found the support near $10 psychological round number and started to move higher. QTUM/USD begun to produce higher highs and higher lows indicating on the valid uptrend that is likely to continue.
After reaching $75 resistance on the 19th of December, price corrected down to $30 support where 61.8% Fibonacci retracement level was rejected, and thereafter price produced a new all-time high, hitting $82 mark.
The final upside target is seen at $144 where two Fibonacci retracement levels are inline, 727.2% and 1127.2%. However, prior to that, there are few minor resistance that should be watched, first $120 and second $132. Only break and close below the $20 could invalidate bullish outlook.

Steem VS Bitcoin Could Blast AnytimeAfter finding the bottom at 8825 satoshi, Steem immediately started to rise breaking above the 200 Moving Average. After the correction and rejection of the 200 MA, STEEM/BTC continued going higher breaking above the descending channel and reaching 57k satoshi high on the 3rd of January.
The corrective wave down followed, where Steem went down exactly to the price where the descending channel was broken and there 23.6% Fibonacci retracement level was rejected. This price action could suggest the continuation of the uptrend sending Steem up to the very strong resistance at 90k satoshi, where it could form a double top together with the high established back in June 2017. Only break and close below the 200 MA could invalidate bullish outlook.

ReddCoin Is So CheapReddCoin is one of those new coins that is still very cheap. Technical analysis can help to determine whether the value will rise or not. And looking and ReddCoin it certainly has a strong growth potential considering the current price action.
First of all, it has started producing higher highs and higher lows. Then, on a corrective wave down it rejected the uptrend trendline and moved higher again, rejecting the second uptrend trendline. Currently, RDD/USD is trading just above the support area that is near $0.02. Price could go higher to test one of the Fibonacci retracement levels applied to the previous corrective wave down. Strongest resistance is seen around $0.07, but break above could send it even higher. Only a break and close below the $0.008 could invalidate bullish outlook.

Shift Rally Hasn't StoppedFollowing the previous idea on Shift , it has reached the upside target at $9.34, that is 327.2% Fibonacci retracement applied to the previous all-time high. The $9.34 level was not only reached but clearly penetrated and price continued to rise, reaching $13.
Corrective wave down followed and was stopped right at the 261.8% Fibonacci support level that is $7.57. As the 427.2% resistance is broken and 261.8% support is rejected it is very likely that the rally will continue where price could reach $20. Although prior to that $14.78 and $17.45 resistance levels must be broken and should be watched closely. Only a break and close below the 200 Moving Average could invalidate bullish outlook.

Ionomy VS Bitcoin Support RejectedIonomy started to show some strength against the Bitcoin after breaking above the 200 Moving Average and descending channel. Price went up from 9k satoshi up to 30k but then corrected down.
The correctional wave was stopped at 16k satoshi, where it rejected the upper trendline of the descending channel and 4/1 trendline of the Gann Fan. Although price could consolidate for a little longer the beginning of the larger correctional wave up is likely to take place.
The first upside target and key resistance is at 61.8% Fibonacci retracement level that is 43k satoshi. If ION/BTC manages to break above, this could mean the beginning of the uptrend. On the downside, only break below the 10k support could invalidate bullish outlook.

GameCredits VS Bitcoin Might Grow Exponentially?GameCredits found the support at 10k satoshi and slowly but consistently started to move up, producing higher highs and higher lows. Price broke above the 200 Moving Average and then above the descending channel.
Currently, upper trendline of the descending channel is acting as a support and GAME/BTC could start an exponential growth from this point. The first upside target is seen at 50% Fibonacci retracement level, that is BTC 0.0010 psychological round number. It also corresponds to the previous resistance during July-August 2017. Only break and close below 10k satoshi support could invalidate bullish outlook.

Buy signalsENGLISH:
We have several bullish signals.
To begin with, the EMA200 resistance has been broken, so bitcoincash is once again in an uptrend.
At this precise moment it is in a dynamic triangle that has already played 3 times with 2 other approaches. Now we have the dynamic support EMA200, so the break of the triangle is closer.
We can also think that it will break the triangle to the upside because the RSI comes from giving an upward signal when crossing the line of the value 40 and because there has been the crossing of lines upwards of the MACD.
In the graph we can not appreciate it, but the PARABOLIC SAR indicator also shows an upward trend.
Another detail to keep in mind, is that a dynamic triangle has been broken in the Bitcoincash chart against Tether USD in the time interval of a day, at this time you can see a pullback, which will take the currency upwards.
After analyzing all these factors, I can almost assure that Bitcoin Cash is about to give a good raise.
- First objective: 0.184
- Second objective: 0.24
- Third objective (medium term): 0.33
Pay attention to the large number of sales orders that are in 0.25, this can delay the arrival of the third objective and stop the rise momentarily.
----------------------------------------------------------------------------------------------------------------------------------------------------------------------------------------
ESPAÑOL:
Tenemos varias señales alcistas.
Para empezar, se ha roto la resistencia EMA200, por lo cual, bitcoincash vuelve a estar en tendencia alcista.
En este preciso momento está en un triángulo dinámico que ya a tocado 3 veces con otras 2 aproximaciones. Ahora tenemos el soporte dinámico EMA200, por lo cual, la rotura del triángulo está más cerca.
También podemos pensar que romperá el triángulo al alza porque el RSI viene de dar una señal al alza al atravezar la linea del valor 40 y porque se ha dado el cruce de lineas al alza del MACD.
En la gráfica no podemos apreciarlo, pero el indicador PARABOLIC SAR también nos muestra una tendencia alcista.
Otro detalle a tener en cuenta, es que se ha roto un triángulo dinámico en la gráfica de Bitcoincash contra Tether USD en el intervalo de tiempo de un día, en este momento se puede apreciar un pullback, lo cual llevará a la moneda al alza.
Después de analizar todas estos factores, puedo casi asegurar que Bitcoin Cash está por dar una buena subida.
- Primer objetivo: 0.184
- Segundo objetivo: 0.24
- Tercer objetivo (mediano plazo): 0.33
Prestar atención a la gran cantidad de órdenes de venta que hay en 0.25, esto puede retrasar la llegada del tercer objetivo y detener la subida momentáneamente.

Pivx VS Bitcoin Support RejectionFollowing the previous idea on Pivx vs Bitcoin , price corrected down but was stopped at 50% Fibonacci retracement level, that is 61k satoshi. Price failed to close below that level although it attempted to go lower, at the same time, the 200 Moving Average was rejected.
Therefore, after breaking above the triangle and the 200MA price corrected down and rejected the support. Such price action could suggest the beginning of the uptrend, sending the price up to the 166k satoshi resistance, confirmed by two Fibonacci retracement levels, 261.8% and 327.2%. This is the first strong obstacle to the potential PIVX/BTC rise and it is yet to be seen whether price breaks above or will reject it.

Ark VS Bitcoin RisingArk found the support at 18k satoshi and started to moving higher while breaking above the 200 Moving Average as well as the descending channel. After the breakout price corrected back and first rejected the Moving Average and then the upper trendline of the descending channel, both of which this time acted as a support.
With such price action, the uptrend scenario becomes more and more likely where ARK/BTC could rise up to 100k satoshi psychological resistance levels. This level is also confirmed by technical analysis, where two Fibonacci retracement levels are inline with each other. the 76.4% and 327.2% levels. Only a break and close below the Moving Average could invalidate bullish outlook.

Stratis VS Bitcoin Still Strong?After breaking above the previous resistance at 88k satoshi and the 200 Moving Average, suddenly Stratis is looking strong against the Bitcoin. Following the break above the resistance, STRAT/BTC went down and re-tested the 88k satoshi support, which in fact has been rejected.
The potential of the Stratis is definitely there and its quite likely that it will continue rising. The nearest resistance is at 125k satoshi, where 61.8% Fibonacci retracement is located. Then 144k and finally 160k resistance. Break above 160k satoshi could establish a longer-term uptrend although it is yet to see how price will react on each of the resistance. Break below the 200 Moving Average should invalidate bullish outlook.


Edgeless Token Should Outperform BitcoinEdgeless token found the support at 5600 satoshi and started to move higher, breaking above the 200 Moving Average and the very strong resistance formed at 13k satoshi. Higher highs and higher lows pattern started to emerge suggesting that EDG/BTC could be planning to continue rising.
After breaking the 13k satoshi resistance, the price went back and this time rejected this level, which is now acting as a support. The upside momentum is there and it is very likely that price will move higher towards previously formed high near 40k satoshi. To be precise, there is a very strong resistance at 37k satoshi confirmed by two Fibonacci retracement levels. First is 88.6% and second is 227.2%, applied to the last corrective wave down.
While the upside potential is there, Edgeless might take some time before moving higher and could even test the uptrend trendline and/or the 200 Moving Average once again. In any case, the buying opportunity is there and only break below the 5600 satoshi support could invalidate bullish outlook.

Memetic / PepeCoin Higher Highs Memetic does look pretty awesome from the technical perspective, it has been bouncing off the 200 Moving Average for an extended period of time after which it broke above the $0.4 resistance and now there is clearly a higher highs, higher lows pattern.
After breaking above the $0.4 resistance price retraced back and rejected the uptrend trendline. Currently, it seems that MEME/USD is ready to continue the uptrend and a new all-time high should be just around the corner. The first target is seen at $2.5 where 161.8% Fibonacci retracement, applied to the latest corrective wave down. On a downside note, only break and close below the 200 Moving Average would invalidate bullish outlook.

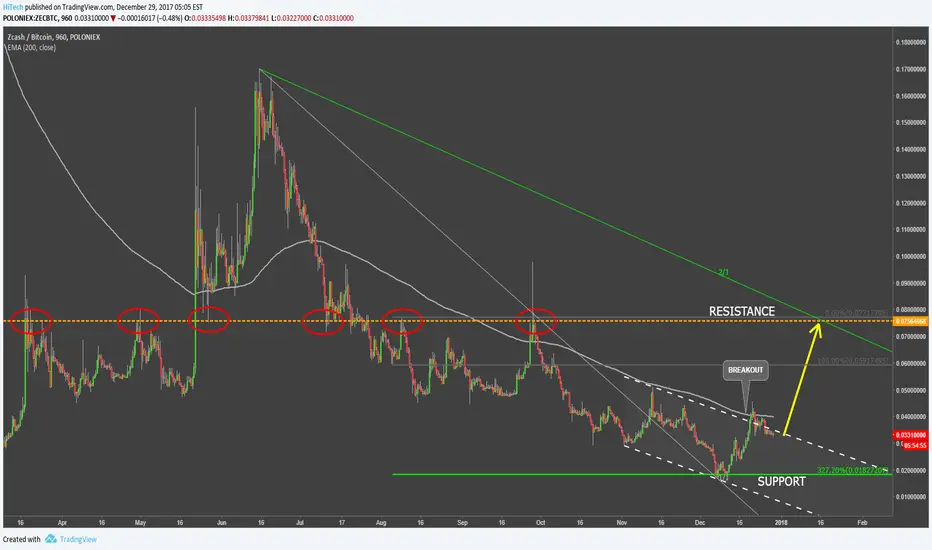
ZCash VS Bitcion Could Go Over 100% UPZCash found the support at 327.2% Fibonacci retracement, applied to the corrective wave up, after breaking the btc 0.75 support. After bouncing off the btc 0.02 psychological level, ZEC/BTC went higher and broke above the descending channel as well as 200 Moving Average.
This could indicate that price is ready to go higher, although it is too early to say it is reversing. The key resistance is at btc 0.075, which is the first upside target for the potential upcoming wave up. This is a key price for ZCash as it could indicate on the future trend. Only a break and close below the btc 0.018 could invalidate bullish outlook.
GBPJPY Potential Long SetupFX:GBPJPY
Buy Limit @150,800
sl: 150,200 (60pips)
tp: 152,600 (180pips)
1:3 risk:reward

Bitcoin: BTCUSD Next Buy Point: Folllow the ChartBitcoin Update Next Buy Point Follow the Chart
A reverse head and shoulders is forming with neckline at the
upper parallel. Next buy point comes only when neckline is crossed
on upside with stop 50 points lower - upside measurement implied
target is 8390 on any sustained break. The whole thing fails if
7717 - 7660 range also fails, for fall back to 7530, which must
hold today at all costs for bull case to stay good in near term.
So far this battle for the new high ground continues, the bulls
trying to grind down the bears at high altitude, and so far
they're....winning. The way this pattern develops determines
the day from here. It will likely take a while to play out yet -
we don't even need to second guess it here, really. It's tough
up here - that selling out of London first thing...was that
heavy weiight Goldman clients closing out longs from lower
down at the exact spot Jafari tagged at 8000 as the next high?
It was a big bad red candle, first for a long while...it's tough
up here.. .so we ait and simply react to the next signal. If it's
a break above the neckline we buy, as above. If it's a break
below 7660 we get stopped out for 130 points profit before
spreads. Not great, but...it's tough up here. If 7660 breaks it
means a test of 7530 - and if that should break it means the
damn thing has flipped right out of the freeezer again and
we're going to have to strart the chase all over again. Please no.
But it's Bitcoin. Anything can happen. (And If it does, we switch
back to shorting rallies back up the blue lines. Please no.
Like in Alien (new theme) we're watching a new life-form develop
on our screens in front of us. Intersting stuff, no? Please comment ffs!
Let the chart decide for us. And let the force be with you,
guide you, Luke. Trust the force!
