EURCHF Is Going Up! Long!
Please, check our technical outlook for EURCHF.
Time Frame: 15m
Current Trend: Bullish
Sentiment: Oversold (based on 7-period RSI)
Forecast: Bullish
The price is testing a key support 0.934.
Current market trend & oversold RSI makes me think that buyers will push the price. I will anticipate a bullish movement at least to 0.936 level.
P.S
Overbought describes a period of time where there has been a significant and consistent upward move in price over a period of time without much pullback.
Disclosure: I am part of Trade Nation's Influencer program and receive a monthly fee for using their TradingView charts in my analysis.
Like and subscribe and comment my ideas if you enjoy them!
Buy

GBP/NZD BULLISH BIAS RIGHT NOW| LONG
Hello, Friends!
Previous week’s red candle means that for us the GBP/NZD pair is in the downtrend. And the current movement leg was also down but the support line will be hit soon and lower BB band proximity will signal an oversold condition so we will go for a counter-trend long trade with the target being at 2.259.
Disclosure: I am part of Trade Nation's Influencer program and receive a monthly fee for using their TradingView charts in my analysis.
✅LIKE AND COMMENT MY IDEAS✅

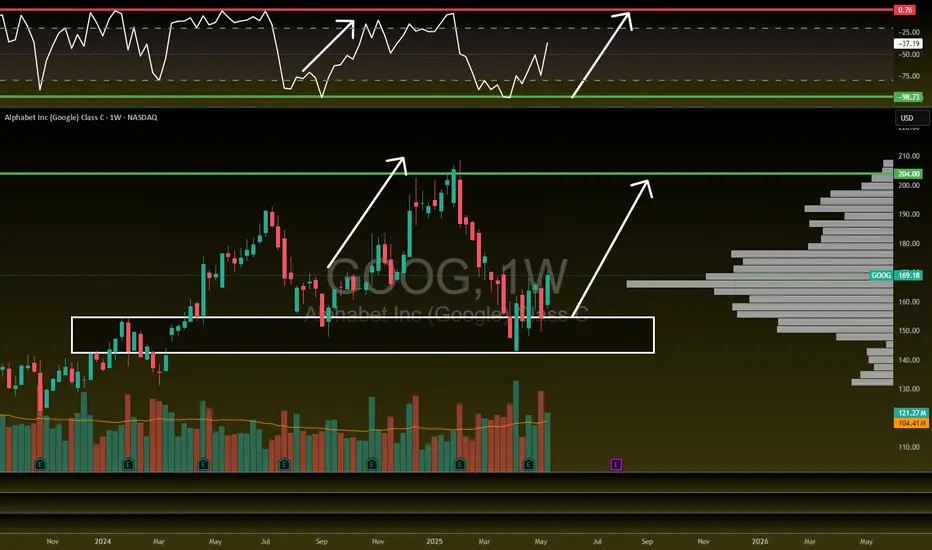
Google to $200!NASDAQ:GOOG NASDAQ:GOOGL
We are uptrending back to ATHs on Google here after they have lagged this whole rally and are the CHEAPEST MAG 7 STOCK!
- Volume shelf launch
- Rising Wr%
- Bouncing off key S/R zone
- H5 Indicator is about to flip to green and make a bullish cross
- Volume is climbing
- Bullish engulfing candle
- Daily looks great as well
Target is $200
GOLD Will Grow! Buy!
Here is our detailed technical review for GOLD.
Time Frame: 2h
Current Trend: Bullish
Sentiment: Oversold (based on 7-period RSI)
Forecast: Bullish
The market is trading around a solid horizontal structure 3,202.52.
The above observations make me that the market will inevitably achieve 3,258.41 level.
P.S
Please, note that an oversold/overbought condition can last for a long time, and therefore being oversold/overbought doesn't mean a price rally will come soon, or at all.
Disclosure: I am part of Trade Nation's Influencer program and receive a monthly fee for using their TradingView charts in my analysis.
Like and subscribe and comment my ideas if you enjoy them!

AUDJPY Will Go Up From Support! Long!
Please, check our technical outlook for AUDJPY.
Time Frame: 12h
Current Trend: Bullish
Sentiment: Oversold (based on 7-period RSI)
Forecast: Bullish
The market is approaching a key horizontal level 93.383.
Considering the today's price action, probabilities will be high to see a movement to 96.039.
P.S
We determine oversold/overbought condition with RSI indicator.
When it drops below 30 - the market is considered to be oversold.
When it bounces above 70 - the market is considered to be overbought.
Disclosure: I am part of Trade Nation's Influencer program and receive a monthly fee for using their TradingView charts in my analysis.
Like and subscribe and comment my ideas if you enjoy them!

AUDCHF Will Go Higher! Buy!
Here is our detailed technical review for AUDCHF.
Time Frame: 12h
Current Trend: Bullish
Sentiment: Oversold (based on 7-period RSI)
Forecast: Bullish
The market is approaching a significant support area 0.536.
The underlined horizontal cluster clearly indicates a highly probable bullish movement with target 0.548 level.
P.S
Overbought describes a period of time where there has been a significant and consistent upward move in price over a period of time without much pullback.
Disclosure: I am part of Trade Nation's Influencer program and receive a monthly fee for using their TradingView charts in my analysis.
Like and subscribe and comment my ideas if you enjoy them!

DXY Bullish Rebound Expected! Buy!
Hello,Traders!
DXY is making a local
Bearish correction towards
The horizontal support level
Around 100.200 but we are
Locally bullish biased so
After the retest we will be
Expecting a local bullish rebound
Buy!
Comment and subscribe to help us grow!
Check out other forecasts below too!
Disclosure: I am part of Trade Nation's Influencer program and receive a monthly fee for using their TradingView charts in my analysis.

Gold Loses 3,220 – Will It Fall Further?Gold has just broken through the 3,220 support and closed the H4 candle at $3,213/ounce. The strong red candle with volume shows that the sellers are still in control. I saw the EMA34 cut down to the EMA89 early and maintained a negative slope – confirming a clear downtrend.
I am watching the 3,180 – 3,200 zone as the next target. If the price rebounds but does not surpass 3,240, I will continue to sell. The current situation is not suitable for buying against the trend, especially when the USD is still strong and the safe-haven sentiment is decreasing.

USDCAD Is Bullish! Long!
Here is our detailed technical review for USDCAD.
Time Frame: 1h
Current Trend: Bullish
Sentiment: Oversold (based on 7-period RSI)
Forecast: Bullish
The market is trading around a solid horizontal structure 1.398.
The above observations make me that the market will inevitably achieve 1.401 level.
P.S
We determine oversold/overbought condition with RSI indicator.
When it drops below 30 - the market is considered to be oversold.
When it bounces above 70 - the market is considered to be overbought.
Disclosure: I am part of Trade Nation's Influencer program and receive a monthly fee for using their TradingView charts in my analysis.
Like and subscribe and comment my ideas if you enjoy them!

AUDUSD Is Very Bullish! Buy!
Take a look at our analysis for AUDUSD.
Time Frame: 1D
Current Trend: Bullish
Sentiment: Oversold (based on 7-period RSI)
Forecast: Bullish
The market is testing a major horizontal structure 0.641.
Taking into consideration the structure & trend analysis, I believe that the market will reach 0.655 level soon.
P.S
Overbought describes a period of time where there has been a significant and consistent upward move in price over a period of time without much pullback.
Disclosure: I am part of Trade Nation's Influencer program and receive a monthly fee for using their TradingView charts in my analysis.
Like and subscribe and comment my ideas if you enjoy them!

GOLD BULLS ARE STRONG HERE|LONG
GOLD SIGNAL
Trade Direction: long
Entry Level: 3,174.39
Target Level: 3,383.26
Stop Loss: 3,035.14
RISK PROFILE
Risk level: medium
Suggested risk: 1%
Timeframe: 1D
Disclosure: I am part of Trade Nation's Influencer program and receive a monthly fee for using their TradingView charts in my analysis.
✅LIKE AND COMMENT MY IDEAS✅

American Airlines Group Inc.Key arguments in support of the idea.
International routes continue to show strong demand. While the U.S. domestic market is facing challenges—especially in the low-cost carrier (LCC) segment—the company is capitalizing on inbound foreign tourism. However, it's worth noting that the U.S. Travel Association (USTA) reports the opposite trend: domestic tourism demand from U.S. citizens remains strong. We expect conditions in domestic flights to improve by summer 2025. During the reporting period, American Airlines highlighted that its premium offerings continue to drive revenue growth, and demand from American travelers for international flights remains steady.
AAL continues to rebuild its indirect sales channels, which is helping to expand its flight schedule in the short term. Following an acknowledgment of operational missteps in summer 2024, this recovery is not only helping to sustain current sales levels but also enabling the airline to better monetize its loyalty program.
Progress in tariff negotiations has given the stock a strong boost. Currently, AAL shares are trading with an RSI near overbought territory. However, if political progress continues, this momentum could very well be sustained. The recent formation of a technical "double bottom" pattern supports this possibility.
The 2-month target price for AAL is $14.9. We recommend setting a stop loss at $10.4.

EUR/CHF BULLS WILL DOMINATE THE MARKET|LONG
Hello, Friends!
EUR/CHF pair is in the downtrend because previous week’s candle is red, while the price is obviously falling on the 1H timeframe. And after the retest of the support line below I believe we will see a move up towards the target above at 0.942 because the pair oversold due to its proximity to the lower BB band and a bullish correction is likely.
Disclosure: I am part of Trade Nation's Influencer program and receive a monthly fee for using their TradingView charts in my analysis.
✅LIKE AND COMMENT MY IDEAS✅

AVAX Potential UpsidesAVAX/USDT is currently trading within a broader uptrend and is in a corrective phase. The price is approaching the 24.60 level, a key support and resistance area that aligns with the prevailing trend structure. This zone may offer insight into potential market reaction and the strength of the ongoing trend.

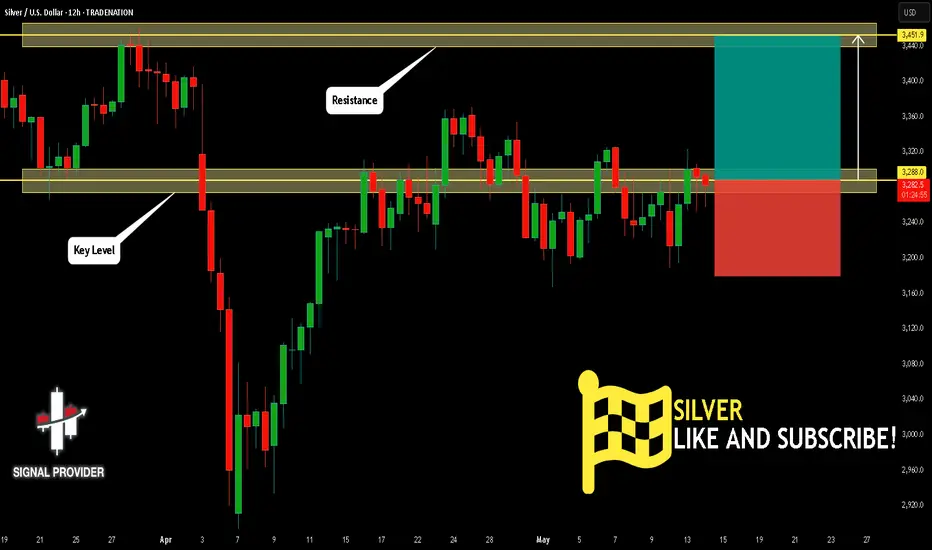
SILVER Is Going Up! Long!
Please, check our technical outlook for SILVER.
Time Frame: 12h
Current Trend: Bullish
Sentiment: Oversold (based on 7-period RSI)
Forecast: Bullish
The market is approaching a key horizontal level 3,288.0.
Considering the today's price action, probabilities will be high to see a movement to 3,451.9.
P.S
Please, note that an oversold/overbought condition can last for a long time, and therefore being oversold/overbought doesn't mean a price rally will come soon, or at all.
Disclosure: I am part of Trade Nation's Influencer program and receive a monthly fee for using their TradingView charts in my analysis.
Like and subscribe and comment my ideas if you enjoy them!
EUR/AUD BUYERS WILL DOMINATE THE MARKET|LONG
EUR/AUD SIGNAL
Trade Direction: long
Entry Level: 1.729
Target Level: 1.801
Stop Loss: 1.681
RISK PROFILE
Risk level: medium
Suggested risk: 1%
Timeframe: 1D
Disclosure: I am part of Trade Nation's Influencer program and receive a monthly fee for using their TradingView charts in my analysis.
✅LIKE AND COMMENT MY IDEAS✅

EUR/GBP BEST PLACE TO BUY FROM|LONG
Hello, Friends!
We are now examining the EUR/GBP pair and we can see that the pair is going down locally while also being in a downtrend on the 1W TF. But there is also a powerful signal from the BB lower band being nearby indicating that the pair is oversold so we can go long from the support line below and a target at 0.854 level.
Disclosure: I am part of Trade Nation's Influencer program and receive a monthly fee for using their TradingView charts in my analysis.
✅LIKE AND COMMENT MY IDEAS✅

GOLD Will Go Up! Buy!
Here is our detailed technical review for GOLD.
Time Frame: 12h
Current Trend: Bullish
Sentiment: Oversold (based on 7-period RSI)
Forecast: Bullish
The market is trading around a solid horizontal structure 3,242.49.
The above observations make me that the market will inevitably achieve 3,415.14 level.
P.S
Please, note that an oversold/overbought condition can last for a long time, and therefore being oversold/overbought doesn't mean a price rally will come soon, or at all.
Disclosure: I am part of Trade Nation's Influencer program and receive a monthly fee for using their TradingView charts in my analysis.
Like and subscribe and comment my ideas if you enjoy them!

AUDCAD Is Very Bullish! Buy!
Here is our detailed technical review for AUDCAD.
Time Frame: 1D
Current Trend: Bullish
Sentiment: Oversold (based on 7-period RSI)
Forecast: Bullish
The market is approaching a significant support area 0.898.
The underlined horizontal cluster clearly indicates a highly probable bullish movement with target 0.913 level.
P.S
Overbought describes a period of time where there has been a significant and consistent upward move in price over a period of time without much pullback.
Disclosure: I am part of Trade Nation's Influencer program and receive a monthly fee for using their TradingView charts in my analysis.
Like and subscribe and comment my ideas if you enjoy them!

BNB/USDT Potential UpsidesHey Traders, in today's trading session we are monitoring BNBUSDT for a buying opportunity around 630 zone, BNBUSDT is trading in an uptrend and currently is in a correction phase in which it is approaching the trend at 630 support and resistance area.
Trade safe, Joe.

Ripple is Nearing an Important Support!!! Hey Traders, in today's trading session we are monitoring XRPUSDT for a buying opportunity around 2.17 zone, Ripple is trading in an uptrend and currently is in a correction phase in which it is approaching the trend at 2.17 support and resistance area.
Trade safe, Joe.

Gold breaks through 3,300 – Selling pressure has not stoppedGold price plummeted from 3,325 to 3,237 USD/ounce after the US and China reached a temporary agreement to reduce taxes. The stock market is up, the USD is strong, money flows out of gold. I see selling pressure clearly dominating.
On H1, the price is still below EMA34 and EMA89, recovering weakly around 3,260. H4 confirms the downtrend that has been formed before. If it does not surpass 3,270, I am inclined to believe that gold will continue to fall to 3,200 – 3,180.

[XAUUSD] Daily Analaysis 12 - 13 May 2025Continuing my mapping in the previous post, H4 GOLD turned out to be stronger and brought GOLD down to support 3195 - 3238. Of course, today's large decline will be followed by a fairly high correction as well. Anticipate GOLD which will correct to the previous low at 3282.
With the confirmed downtrend pattern, the SELL Area 3262 - 3290 is worthy of our SELL position again.
