Gold Breaks Support Level – The Downtrend May Not StopAfter peaking at $3,500/ounce in April, gold is in a clear correction phase. On the H4 chart, the price has broken through both the EMA34 and EMA89, indicating that a short-term downtrend has been established. The most recent session closed at $3,223, losing nearly $130 in just a few sessions.
The sharp decline appeared after a long rally and the peak was rejected many times. The break through the EMA89 support has triggered technical selling pressure, reflecting the psychology of profit-taking after failing to surpass the old peak.
Buy

Gold falls after FED news, cautious buying powerWorld gold prices retreated to $3,370/ounce, down more than $25 from last night's peak. The H4 chart shows a sharp decline that broke through the EMA34, currently testing the EMA89 - a signal that profit-taking pressure is increasing after the previous strong bounce.
The FED kept interest rates unchanged in the 4.25% - 4.5% range, as expected. However, Chairman Jerome Powell's "wait and see" statement made investors pause buying gold due to concerns that prolonged high interest rates will continue to put pressure on non-yielding assets like gold. In addition, the rise in international stocks and China's money pumping policy have reduced the attractiveness of this safe haven.

GOLD BULLS ARE GAINING STRENGTH|LONG
GOLD SIGNAL
Trade Direction: long
Entry Level: 3,211.87
Target Level: 3,375.85
Stop Loss: 3,102.01
RISK PROFILE
Risk level: medium
Suggested risk: 1%
Timeframe: 12h
Disclosure: I am part of Trade Nation's Influencer program and receive a monthly fee for using their TradingView charts in my analysis.
✅LIKE AND COMMENT MY IDEAS✅

Gold / Xauusd needs a upward CorrectionMarket already makes agap in the morning. profile shape p is occuring. So there is buy build up. BUt market makes a failed auction in the morning. This creates a little bit confusions. market hope so it's just a short squeeze. Find buy at the poc level.
No Confirmation no trade

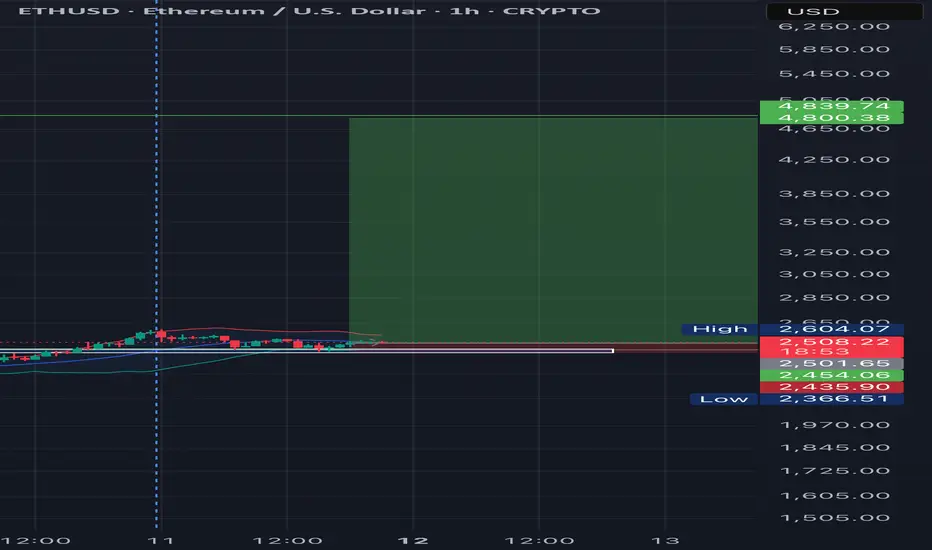
Moonshot opportunities The article strategies showed about Moonshot can breakout and go over 3000. I am expecting this bullish opportunity.
The chess between bears and bulls.. bulls will bring up the end game checkmate. It needs to break way above 2590 and thru 2900. The bulls take control; it takes it very well.
After the breakout it will mission back to recent high and then 2021 ATH which is at 4800 area; once that happens then 5000 will happen.
Im not financial advisor; be sure to use proper risk management and be cautious of the spike.
Watch any reversal
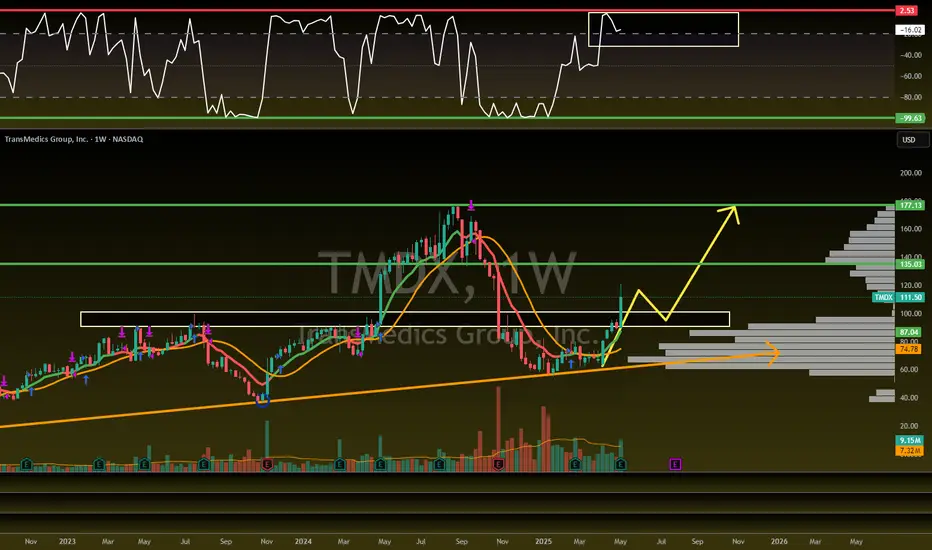
$TMDX Trade Setup: 80%+ Upside!NASDAQ:TMDX Trade Setup
Looking for a retest of the $90-100 breakout area to flip previous resistance into support.
Followed by a move to these targets...
🎯$135🎯$177
- Volume shelf launch with GAP
- Bullish WCB forming
- Green H5 Indicator
- Great earnings recently
Not financial advice
XLMUSDT Potential UpsidesHey Traders, in today's trading session we are monitoring XLMUSDT for a buying opportunity around 0.3000 zone, XLMUSDT is trading in an uptrend and currently is in a correction phase in which it is approaching the trend at 0.3000 support and resistance area.
Trade safe, Joe.

DXY Will Go Higher! Long!
Please, check our technical outlook for DXY.
Time Frame: 9h
Current Trend: Bullish
Sentiment: Oversold (based on 7-period RSI)
Forecast: Bullish
The market is approaching a key horizontal level 100.428.
Considering the today's price action, probabilities will be high to see a movement to 102.304.
P.S
Please, note that an oversold/overbought condition can last for a long time, and therefore being oversold/overbought doesn't mean a price rally will come soon, or at all.
Disclosure: I am part of Trade Nation's Influencer program and receive a monthly fee for using their TradingView charts in my analysis.
Like and subscribe and comment my ideas if you enjoy them!

#MEME #MEMEUSDT #MEMECOIN #LONG #SWING #Eddy#MEME #MEMEUSDT #MEMECOIN #LONG #SWING #Eddy
MEMEUSDT.P SWING Long Setup
Important areas of the upper time frame for swing are identified and named.
This setup is based on a combination of different styles, including the volume style with the ict style.
Based on your strategy and style, get the necessary confirmations for this Swing Setup to enter the trade.
Don't forget risk and capital management.
The entry point, take profit point, and stop loss point are indicated on the chart along with their amounts.
The responsibility for the transaction is yours and I have no responsibility for not observing your risk and capital management.
By scratching the price and time bar, you can see the big picture of targets.
Buy Position "LONG" Spot & Future Details :
Entry : 0.002662
Stop : 0.002616 (( 1.73% ))
Target 1 : 50% Spot
Target 2 : 100% Spot
Target 3 : 500% Spot
Target 4 : 1000% Spot
Target 5 : 1500% Spot
Target 6 : 2000% Spot
Be successful and profitable.

BITCOIN Will Move Higher! Buy!
Take a look at our analysis for BITCOIN.
Time Frame: 4h
Current Trend: Bullish
Sentiment: Oversold (based on 7-period RSI)
Forecast: Bullish
The market is on a crucial zone of demand 103,231.18.
The oversold market condition in a combination with key structure gives us a relatively strong bullish signal with goal 107,552.18 level.
P.S
We determine oversold/overbought condition with RSI indicator.
When it drops below 30 - the market is considered to be oversold.
When it bounces above 70 - the market is considered to be overbought.
Disclosure: I am part of Trade Nation's Influencer program and receive a monthly fee for using their TradingView charts in my analysis.
Like and subscribe and comment my ideas if you enjoy them!

USDJPY Will Move Higher! Buy!
Please, check our technical outlook for USDJPY.
Time Frame: 4h
Current Trend: Bullish
Sentiment: Oversold (based on 7-period RSI)
Forecast: Bullish
The market is approaching a key horizontal level 142.756.
Considering the today's price action, probabilities will be high to see a movement to 144.697.
P.S
We determine oversold/overbought condition with RSI indicator.
When it drops below 30 - the market is considered to be oversold.
When it bounces above 70 - the market is considered to be overbought.
Disclosure: I am part of Trade Nation's Influencer program and receive a monthly fee for using their TradingView charts in my analysis.
Like and subscribe and comment my ideas if you enjoy them!

DOGE - 1$ NextDoge is getting ready for the next wave. Based on the previous trend we are looking at the next target around 1.1$.
Doge can break 1$ easily based on the current trend and overall interested in DOGE.
Entry: 0.1766
TP1: 0.22086
TP2: 0.30439
TP3: 0.40104
TP4: 0.53436
TP5: 1.13587
Stop Loss: 0.1143
Follow us for more such ideas.
Cheers
GreenCrypto

CRYPTO ALT COIN GEM HUNTING!I hope you guys enjoyed the video! Feel free to comment down below other Alt coins that you are buying!

TONUSDT Built a Fresh Up Trend!!!Hey Traders, in today's trading session we are monitoring TONUSDT for a buying opportunity around 3.20 zone, TONUSDT is trading in an uptrend and currently is in a correction phase in which it is approaching the trend at 3.20 support and resistance area.
Trade safe, Joe.

$OKTA is ready to RIP! 58% UpsideNASDAQ:OKTA was a big name I was talking about end of last year before we took a big dip in the markets...well we are back at the CupnHandle breakout level now and this trade looks ready to RIP!
Warning earnings on May 27th!
- Looking for a close on Friday above the breakout level for an entry here
- Green H5_L inidcator
- CupnHandle breakout
- Volume shelf launch
- Bullish Wr%
$139 First target
Measured Move is $186 for the cupnhandle
Not financial advice

GOLD BEST PLACE TO BUY FROM|LONG
GOLD SIGNAL
Trade Direction: long
Entry Level: 3,341.45
Target Level: 3,414.79
Stop Loss: 3,292.55
RISK PROFILE
Risk level: medium
Suggested risk: 1%
Timeframe: 2h
Disclosure: I am part of Trade Nation's Influencer program and receive a monthly fee for using their TradingView charts in my analysis.
✅LIKE AND COMMENT MY IDEAS✅

EUR/JPY LONG FROM SUPPORT
Hello, Friends!
EUR/JPY is making a bearish pullback on the 3H TF and is nearing the support line below while we are generally bullish biased on the pair due to our previous 1W candle analysis, thus making a trend-following long a good option for us with the target being the 163.264 level.
Disclosure: I am part of Trade Nation's Influencer program and receive a monthly fee for using their TradingView charts in my analysis.
✅LIKE AND COMMENT MY IDEAS✅

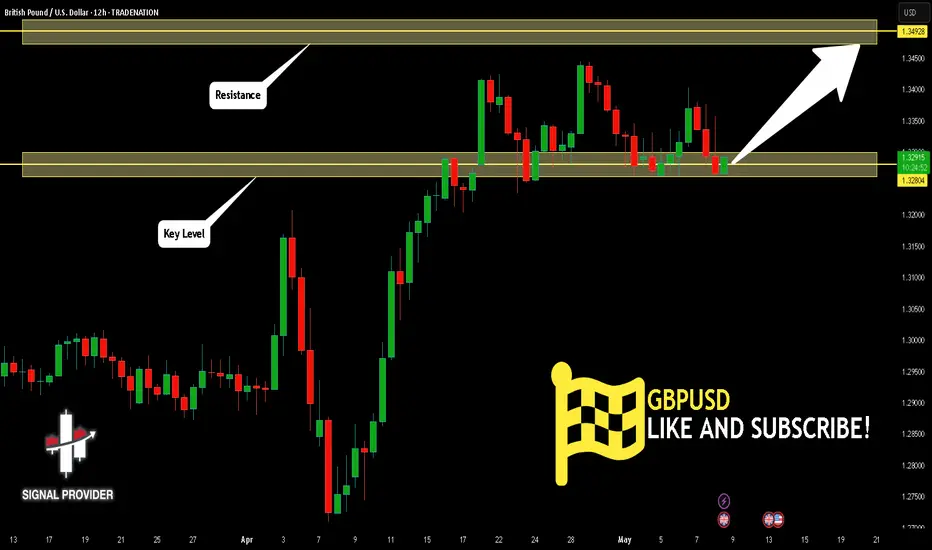
GBPUSD Is Bullish! Long!
Take a look at our analysis for GBPUSD.
Time Frame: 12h
Current Trend: Bullish
Sentiment: Oversold (based on 7-period RSI)
Forecast: Bullish
The market is testing a major horizontal structure 1.328.
Taking into consideration the structure & trend analysis, I believe that the market will reach 1.349 level soon.
P.S
Overbought describes a period of time where there has been a significant and consistent upward move in price over a period of time without much pullback.
Disclosure: I am part of Trade Nation's Influencer program and receive a monthly fee for using their TradingView charts in my analysis.
Like and subscribe and comment my ideas if you enjoy them!
COIN Coinbase Global Options Ahead of EarningsIf you haven`t bought COIN before the recent rally:
Now analyzing the options chain and the chart patterns of COIN Coinbase Global prior to the earnings report this week,
I would consider purchasing the 220usd strike price Calls with
an expiration date of 2025-8-15,
for a premium of approximately $18.90.
If these options prove to be profitable prior to the earnings release, I would sell at least half of them.
Disclosure: I am part of Trade Nation's Influencer program and receive a monthly fee for using their TradingView charts in my analysis.

MARA Holdings Options Ahead of EarningsIf you haven`t bought MARA before the recent rally:
Now analyzing the options chain and the chart patterns of MARA Holdings prior to the earnings report this week,
I would consider purchasing the 13usd strike price Calls with
an expiration date of 2025-5-30,
for a premium of approximately $1.38.
If these options prove to be profitable prior to the earnings release, I would sell at least half of them.

KODK Eastman Kodak Company Options Ahead of EarningsIf you haven`t bought KODK before the previous earnings:
Now analyzing the options chain and the chart patterns of KODK Eastman Kodak prior to the earnings report this week,
I would consider purchasing the 7.5usd strike price Calls with
an expiration date of 2026-1-16,
for a premium of approximately $0.92.
If these options prove to be profitable prior to the earnings release, I would sell at least half of them.

RKT Rocket Companies Options Ahead of EarningsIf you haven`t bought RKT before the previous earnings:
Now analyzing the options chain and the chart patterns of RKT Rocket Companies prior to the earnings report this week,
I would consider purchasing the 13usd strike price Calls with
an expiration date of 2026-1-16,
for a premium of approximately $1.37.
If these options prove to be profitable prior to the earnings release, I would sell at least half of them.

TTD The Trade Desk Options Ahead of EarningsIf you haven`t bought TTD before the recent rally:
Now analyzing the options chain and the chart patterns of TTD The Trade Desk prior to the earnings report this week,
I would consider purchasing the 55usd strike price Calls with
an expiration date of 2025-6-20,
for a premium of approximately $6.70.
If these options prove to be profitable prior to the earnings release, I would sell at least half of them.
