FLOKI on Fire! Bullish Summer for FLOKIUSDTDuring the two-month period from July to August, it's unclear what the specific catalyst might be, but Floki appears poised for a price surge between 75% to 133%. The June low at 0.00005923 seems to mark a solid bottom, and from here, I anticipate a bullish trend in Floki’s price.
Buy

EUR/USD Keeps Climbing – Dollar on the Back FootEUR/USD is still pushing higher today, trading around 1.171 and showing no signs of slowing down. The pair’s strength is backed by both technical momentum and the current market backdrop.
What’s fueling the move? Simple: the US dollar is under pressure again. Fresh concerns about the Federal Reserve’s independence — especially with talks around replacing Powell — are shaking investor confidence. That’s giving the euro the upper hand and helping this pair hover near its highest level in four years.
Looks like the bulls aren’t done yet. You riding this trend?

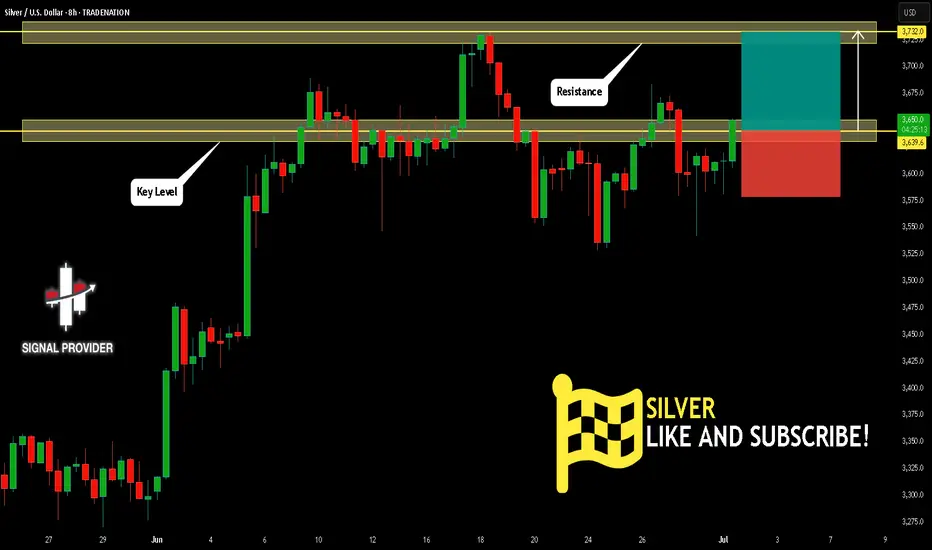
SILVER Will Move Higher! Long!
Please, check our technical outlook for SILVER.
Time Frame: 8h
Current Trend: Bullish
Sentiment: Oversold (based on 7-period RSI)
Forecast: Bullish
The price is testing a key support 3,639.6.
Current market trend & oversold RSI makes me think that buyers will push the price. I will anticipate a bullish movement at least to 3,732.0 level.
P.S
The term oversold refers to a condition where an asset has traded lower in price and has the potential for a price bounce.
Overbought refers to market scenarios where the instrument is traded considerably higher than its fair value. Overvaluation is caused by market sentiments when there is positive news.
Disclosure: I am part of Trade Nation's Influencer program and receive a monthly fee for using their TradingView charts in my analysis.
Like and subscribe and comment my ideas if you enjoy them!
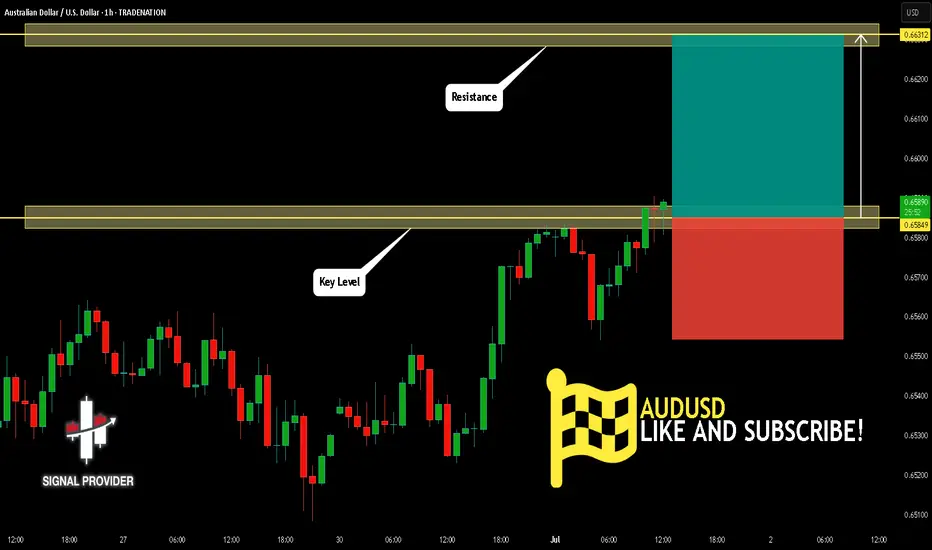
AUDUSD Is Bullish! Buy!
Here is our detailed technical review for AUDUSD.
Time Frame: 1h
Current Trend: Bullish
Sentiment: Oversold (based on 7-period RSI)
Forecast: Bullish
The market is trading around a solid horizontal structure 0.658.
The above observations make me that the market will inevitably achieve 0.663 level.
P.S
We determine oversold/overbought condition with RSI indicator.
When it drops below 30 - the market is considered to be oversold.
When it bounces above 70 - the market is considered to be overbought.
Disclosure: I am part of Trade Nation's Influencer program and receive a monthly fee for using their TradingView charts in my analysis.
Like and subscribe and comment my ideas if you enjoy them!
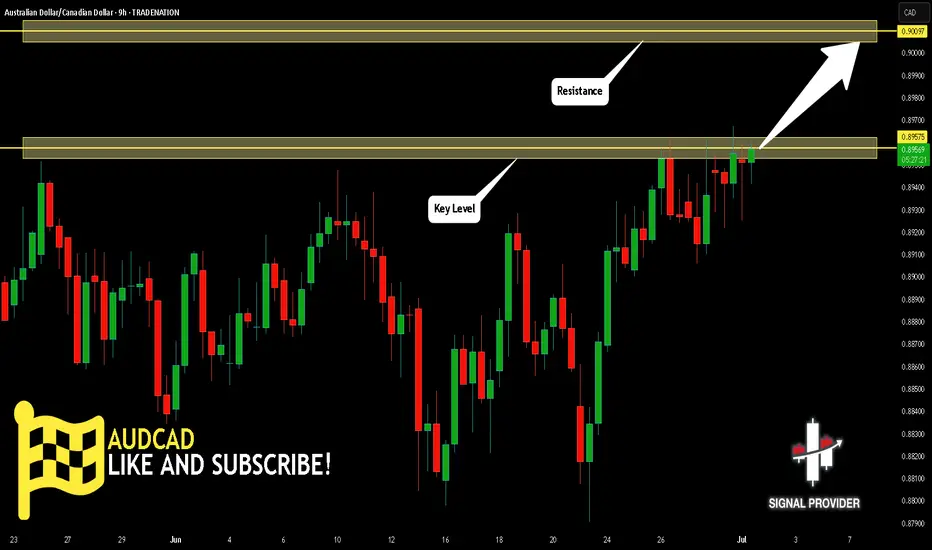
AUDCAD Is Going Up! Long!
Please, check our technical outlook for AUDCAD.
Time Frame: 9h
Current Trend: Bullish
Sentiment: Oversold (based on 7-period RSI)
Forecast: Bullish
The market is approaching a key horizontal level 0.895.
Considering the today's price action, probabilities will be high to see a movement to 0.900.
P.S
Please, note that an oversold/overbought condition can last for a long time, and therefore being oversold/overbought doesn't mean a price rally will come soon, or at all.
Disclosure: I am part of Trade Nation's Influencer program and receive a monthly fee for using their TradingView charts in my analysis.
Like and subscribe and comment my ideas if you enjoy them!
GBP/NZD BEST PLACE TO BUY FROM|LONG
Hello, Friends!
Bullish trend on GBP/NZD, defined by the green colour of the last week candle combined with the fact the pair is oversold based on the BB lower band proximity, makes me expect a bullish rebound from the support line below and a retest of the local target above at 2.267.
Disclosure: I am part of Trade Nation's Influencer program and receive a monthly fee for using their TradingView charts in my analysis.
✅LIKE AND COMMENT MY IDEAS✅

Buy IOC short term target 155, 165 & Medium Term tgt 185, 250 Indian Oil Corporation does business in the entire hydrocarbon value chain - from Refining, Pipeline transportation and marketing of Petroleum products to R&D, Exploration & production, marketing of natural gas and petrochemicals. It has the leadership position in the Oil refining & petroleum marketing sector of India.
The company aims to strengthen EV mobility infrastructure by setting up charging points and battery-swapping facilities at its fuel stations. It has also signed a binding term sheet with Panasonic Group to form a JV for manufacturing cells in India.
The company’s R&D is focused on emerging fields such as nanotechnology, Solar, Bioenergy, Hydrogen, etc. It has an effective patent portfolio of 1636. It spent Rs 946 Cr in FY24 on R&D.
The company’s R&D is focused on emerging fields such as nanotechnology, Solar, Bioenergy, Hydrogen, etc. It has an effective patent portfolio of 1636. It spent Rs 946 Cr in FY24 on R&D.
Market Cap ₹ 2,07,370 Cr.
Annual Sales - ₹ 758,106 Cr
Dividend Yield - 8.20 %
Stock P/E - 17.0
Industry PE - 29.2
Debt to equity - 0.82
ROCE - 7.37 %
EPS - ₹ 9.63
Fundamentally, this big company is trading at a very low valuation. The Crude Oil price is expected this year to be on lowest, so we can expect good profit margin and this company is into green energy business so it should have PE multiple of that business as well. We Expect growth in EPS by 30% to 12.5 And re-rating of PE multiple to 20 so that give the share price to ₹ 250 which gives return of 70.88% from current price level of 146.30.
Technically, this is very bullish on weekly, daily timeframe. Price is trading above all short term, medium term averages. It has formed a bullish candlestick pattern on daily and weekly chart, so we expect immediate strong upside to 155, 165 and eventually 185 level and investment target of 250 levels.

XAUUSD – Technical pullback before a breakout?On the 4H chart, gold is consolidating just below the descending trendline after a correction from $3,389 to the support zone at $3,252. The current price structure suggests continued range-bound movement between $3,252 and $3,318 before a potential breakout. If price breaks above the trendline, the next target could be the resistance zone at $3,389.
From a news perspective, the easing of Iran–Israel tensions has slightly reduced safe-haven demand, putting short-term pressure on gold. However, the US dollar remains at a 3-year low, and concerns over the US government’s $3.3–3.9 trillion tax reform package are fueling fears of a widening deficit—both of which support a bullish outlook for gold.
In summary, watch how price reacts to the trendline. A confirmed breakout could send gold surging toward the $3,389 zone.

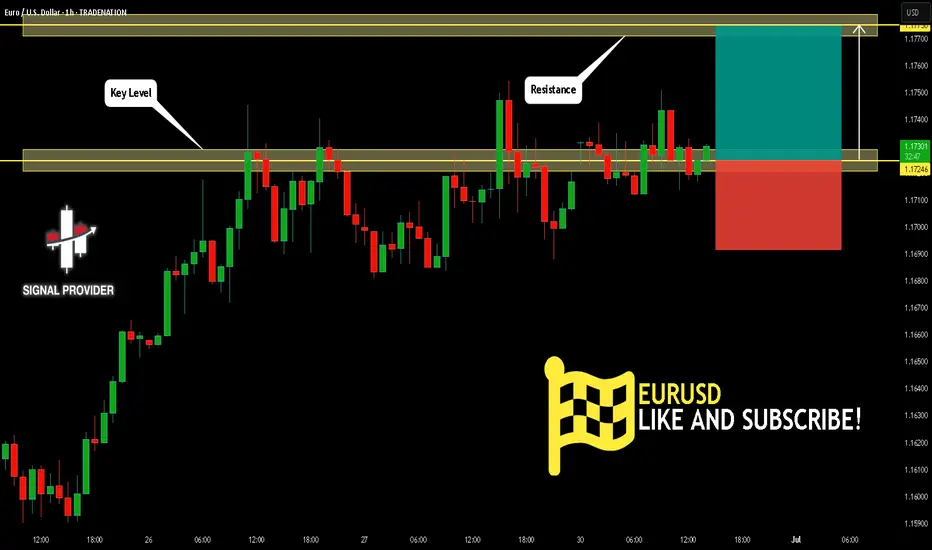
EURUSD Will Go Higher From Support! Long!
Take a look at our analysis for EURUSD.
Time Frame: 1h
Current Trend: Bullish
Sentiment: Oversold (based on 7-period RSI)
Forecast: Bullish
The market is on a crucial zone of demand 1.172.
The oversold market condition in a combination with key structure gives us a relatively strong bullish signal with goal 1.177 level.
P.S
We determine oversold/overbought condition with RSI indicator.
When it drops below 30 - the market is considered to be oversold.
When it bounces above 70 - the market is considered to be overbought.
Disclosure: I am part of Trade Nation's Influencer program and receive a monthly fee for using their TradingView charts in my analysis.
Like and subscribe and comment my ideas if you enjoy them!
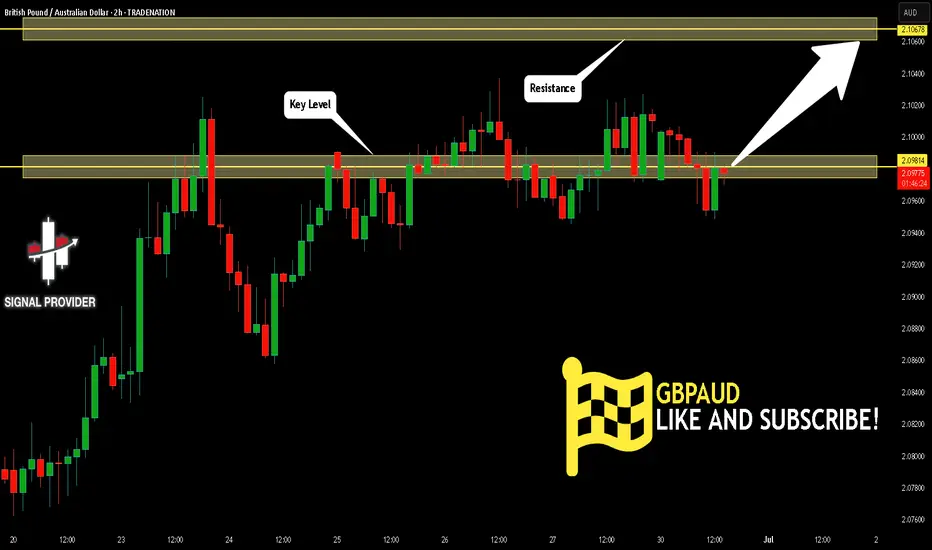
GBPAUD Will Go Higher! Buy!
Here is our detailed technical review for GBPAUD.
Time Frame: 2h
Current Trend: Bullish
Sentiment: Oversold (based on 7-period RSI)
Forecast: Bullish
The market is trading around a solid horizontal structure 2.098.
The above observations make me that the market will inevitably achieve 2.106 level.
P.S
Please, note that an oversold/overbought condition can last for a long time, and therefore being oversold/overbought doesn't mean a price rally will come soon, or at all.
Disclosure: I am part of Trade Nation's Influencer program and receive a monthly fee for using their TradingView charts in my analysis.
Like and subscribe and comment my ideas if you enjoy them!
AUD/CAD BEST PLACE TO BUY FROM|LONG
Hello, Friends!
AUD-CAD downtrend evident from the last 1W red candle makes longs trades more risky, but the current set-up targeting 0.886 area still presents a good opportunity for us to buy the pair because the support line is nearby and the BB lower band is close which indicates the oversold state of the AUD/CAD pair.
Disclosure: I am part of Trade Nation's Influencer program and receive a monthly fee for using their TradingView charts in my analysis.
✅LIKE AND COMMENT MY IDEAS✅

QNT FOR THE WIN!Looking at QNT if youve been following me on another platform under the same name. Youll see we have timed these perfectly. we entered QNT at around $75 sold at $123 the flase breakout/ war and had the rejection right back down to the .618 fib retracement. Once we held beautiful support at the downward trendline, around $90 we had an immediete push up. We wait to see what bitcoin does. If it consolidates or pushed upward we could see QNT push back up to $123 and beyond (currently at the .618 fib retracement).
If bitcoin gets rejected, we may see a small pullback but i cant imagine back down past $90 again. NOT FINANCIAL ADVICE.
Goodluck and have fun with it.

US500 Will Go Up! Long!
Take a look at our analysis for US500.
Time Frame: 1D
Current Trend: Bullish
Sentiment: Oversold (based on 7-period RSI)
Forecast: Bullish
The market is testing a major horizontal structure 6,165.52.
Taking into consideration the structure & trend analysis, I believe that the market will reach 6,451.04 level soon.
P.S
The term oversold refers to a condition where an asset has traded lower in price and has the potential for a price bounce.
Overbought refers to market scenarios where the instrument is traded considerably higher than its fair value. Overvaluation is caused by market sentiments when there is positive news.
Disclosure: I am part of Trade Nation's Influencer program and receive a monthly fee for using their TradingView charts in my analysis.
Like and subscribe and comment my ideas if you enjoy them!

Gold Extends Decline Amid Easing Safe-Haven DemandGold continues its downward trajectory as safe-haven sentiment weakens. Geopolitical tensions between Iran and Israel appear to be easing following a ceasefire agreement, reducing the perceived need for defensive assets such as gold.
At the same time, the market is reassessing its expectations regarding U.S. monetary policy. With the Federal Reserve unlikely to cut interest rates in the near term—and concerns about inflation resurfacing due to potential tax policy changes under former President Donald Trump—gold is facing a dual source of short-term pressure.
Investor sentiment is currently shifting toward riskier assets, as capital flows increasingly favor equities over gold. This risk-on environment has further eroded demand for traditional safe havens.
From a technical perspective, gold failed to break above the $3,350 level, signaling waning bullish momentum. This may indicate the onset of a short-term corrective phase.
On the political front, recent remarks by Donald Trump—including the possibility of a long-term diplomatic solution with Iran and discussions around replacing Fed Chair Jerome Powell—have introduced additional volatility into global financial markets.
Furthermore, according to market data I have reviewed, gold sales in the second quarter have shown signs of slowing. Buyers are becoming more cautious amid elevated price levels, while many investors are choosing to take profits, contributing to an increasingly two-sided market dynamic.
Despite this, I maintain a positive medium- to long-term outlook for gold. The U.S. dollar is currently at its weakest point in three and a half years, offering significant support. Notably, central banks managing over $5 trillion in assets are planning to increase their gold reserves within the next one to two years—a strong structural driver for gold’s long-term growth.
In summary, I believe gold is currently experiencing short-term corrective pressure due to a combination of geopolitical developments, interest rate expectations, and shifting investor sentiment. However, its long-term outlook remains solid, supported by a weaker dollar, global macroeconomic risks, and continued central bank accumulation.

Elliott Wave Analysis for EUR/USD - Bullish OutlookPEPPERSTONE:EURUSD
This analysis is based on the application of Elliott Wave principles for the EUR/USD market on a weekly timeframe.
💡 Wave Identification:
Corrective Cycle (ABC): After a peak marked by wave B, the market completed a 5-wave downward structure (waves 1 to 5), forming wave C, signaling a possible end of the correction.
Potential Reversal Zone (2/B): The current point is a strategic level where a bullish rebound is anticipated.
📊 Projection:
A bullish impulse is expected from point C. The initial target lies in the 1.1140 - 1.1217 zone, corresponding to key resistance levels and Fibonacci projections.
🧠 Conclusion:
A breakout above 1.0440 could confirm a significant bullish impulse, suggesting buyers are regaining control.
⚠️ Disclaimer : This analysis is not financial advice. Always conduct your own research before investing.

GBPJPY Potential UpsidesHey Traders, in the coming week we are monitoring GBPJPY for a buying opportunity around 198.100 zone, GBPJPY is trading in an uptrend and currently is in a correction phase in which it is approaching the trend at 198.100 support and resistance area.
Trade safe, Joe.

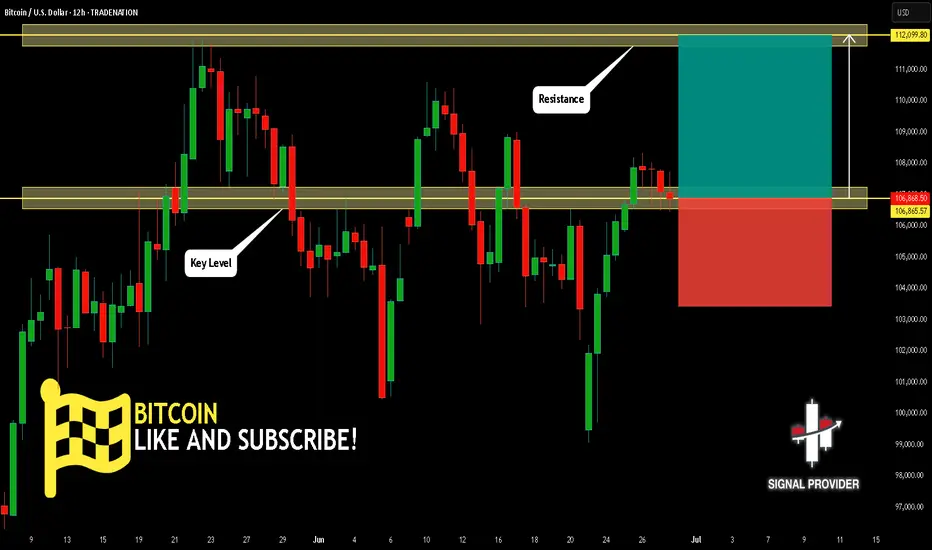
BITCOIN Is Bullish! Buy!
Here is our detailed technical review for BITCOIN.
Time Frame: 12h
Current Trend: Bullish
Sentiment: Oversold (based on 7-period RSI)
Forecast: Bullish
The market is approaching a significant support area 106,865.57.
The underlined horizontal cluster clearly indicates a highly probable bullish movement with target 112,099.80 level.
P.S
Overbought describes a period of time where there has been a significant and consistent upward move in price over a period of time without much pullback.
Disclosure: I am part of Trade Nation's Influencer program and receive a monthly fee for using their TradingView charts in my analysis.
Like and subscribe and comment my ideas if you enjoy them!
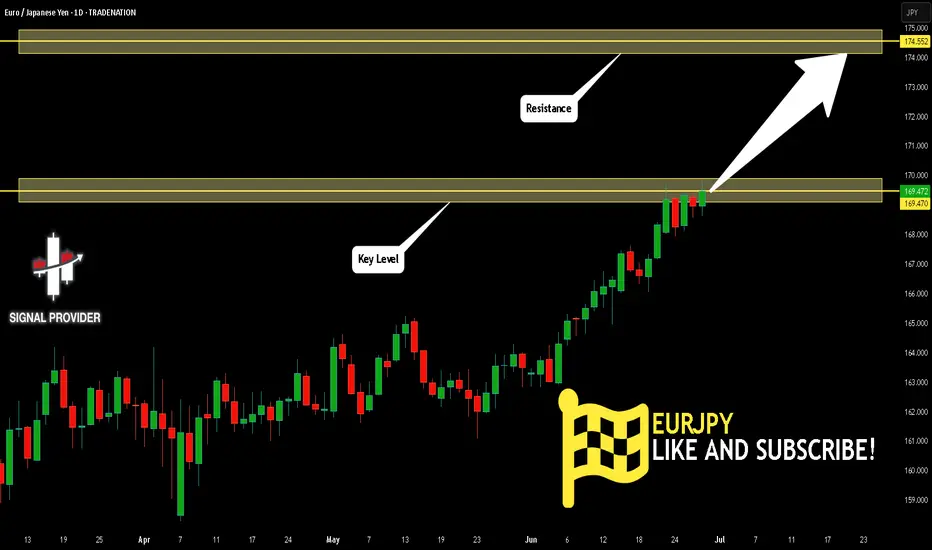
EURJPY Is Very Bullish! Long!
Take a look at our analysis for EURJPY.
Time Frame: 1D
Current Trend: Bullish
Sentiment: Oversold (based on 7-period RSI)
Forecast: Bullish
The market is on a crucial zone of demand 169.470.
The oversold market condition in a combination with key structure gives us a relatively strong bullish signal with goal 174.552 level.
P.S
Please, note that an oversold/overbought condition can last for a long time, and therefore being oversold/overbought doesn't mean a price rally will come soon, or at all.
Disclosure: I am part of Trade Nation's Influencer program and receive a monthly fee for using their TradingView charts in my analysis.
Like and subscribe and comment my ideas if you enjoy them!
GBPCHF Is Going Up! Buy!
Please, check our technical outlook for GBPCHF.
Time Frame: 2h
Current Trend: Bullish
Sentiment: Oversold (based on 7-period RSI)
Forecast: Bullish
The price is testing a key support 1.095.
Current market trend & oversold RSI makes me think that buyers will push the price. I will anticipate a bullish movement at least to 1.098 level.
P.S
The term oversold refers to a condition where an asset has traded lower in price and has the potential for a price bounce.
Overbought refers to market scenarios where the instrument is traded considerably higher than its fair value. Overvaluation is caused by market sentiments when there is positive news.
Disclosure: I am part of Trade Nation's Influencer program and receive a monthly fee for using their TradingView charts in my analysis.
Like and subscribe and comment my ideas if you enjoy them!

XAUUSD – Bearish Trend Continues After Channel BreakoutGold is currently moving within a clearly defined descending channel, with successive lower highs confirmed at each retest of the dynamic resistance line. Following news of a temporary ceasefire between Iran and Israel, gold's safe-haven appeal weakened, triggering strong selling pressure that drove prices sharply lower, breaking below the key $3,260 support.
A rounded top pattern and a clean breakout beneath the channel indicate that sellers are in control. The next downside target lies around the $3,218 confluence zone, where a temporary bullish reaction may occur. The nearest resistance on a pullback is around $3,349 – aligned with the broken upper channel boundary and a dense FVG zone.
If the price fails to quickly reclaim the broken channel, the bearish trend is likely to persist in the short term. Traders should closely monitor price action near the $3,218 zone for potential entries or reversals.

AUDUSD Potential UpsidesHey Traders, in today's trading session we are monitoring AUDUSD for a buying opportunity around 0.65300 zone, AUDUSD is trading in an uptrend and currently is in a correction phase in which it is approaching the trend at 0.65300 support and resistance area.
Trade safe, Joe.

GOLD Will Grow! Long!
Here is our detailed technical review for GOLD.
Time Frame: 1h
Current Trend: Bullish
Sentiment: Oversold (based on 7-period RSI)
Forecast: Bullish
The market is trading around a solid horizontal structure 3,290.38.
The above observations make me that the market will inevitably achieve 3,315.54 level.
P.S
We determine oversold/overbought condition with RSI indicator.
When it drops below 30 - the market is considered to be oversold.
When it bounces above 70 - the market is considered to be overbought.
Disclosure: I am part of Trade Nation's Influencer program and receive a monthly fee for using their TradingView charts in my analysis.
Like and subscribe and comment my ideas if you enjoy them!

EURGBP Will Go Higher! Long!
Here is our detailed technical review for EURGBP.
Time Frame: 9h
Current Trend: Bullish
Sentiment: Oversold (based on 7-period RSI)
Forecast: Bullish
The market is approaching a significant support area 0.852.
The underlined horizontal cluster clearly indicates a highly probable bullish movement with target 0.856 level.
P.S
The term oversold refers to a condition where an asset has traded lower in price and has the potential for a price bounce.
Overbought refers to market scenarios where the instrument is traded considerably higher than its fair value. Overvaluation is caused by market sentiments when there is positive news.
Disclosure: I am part of Trade Nation's Influencer program and receive a monthly fee for using their TradingView charts in my analysis.
Like and subscribe and comment my ideas if you enjoy them!
