Elliott Wave Analysis for EUR/USD - Bullish OutlookPEPPERSTONE:EURUSD
This analysis is based on the application of Elliott Wave principles for the EUR/USD market on a weekly timeframe.
💡 Wave Identification:
Corrective Cycle (ABC): After a peak marked by wave B, the market completed a 5-wave downward structure (waves 1 to 5), forming wave C, signaling a possible end of the correction.
Potential Reversal Zone (2/B): The current point is a strategic level where a bullish rebound is anticipated.
📊 Projection:
A bullish impulse is expected from point C. The initial target lies in the 1.1140 - 1.1217 zone, corresponding to key resistance levels and Fibonacci projections.
🧠 Conclusion:
A breakout above 1.0440 could confirm a significant bullish impulse, suggesting buyers are regaining control.
⚠️ Disclaimer : This analysis is not financial advice. Always conduct your own research before investing.
Buy

GBPJPY Potential UpsidesHey Traders, in the coming week we are monitoring GBPJPY for a buying opportunity around 198.100 zone, GBPJPY is trading in an uptrend and currently is in a correction phase in which it is approaching the trend at 198.100 support and resistance area.
Trade safe, Joe.

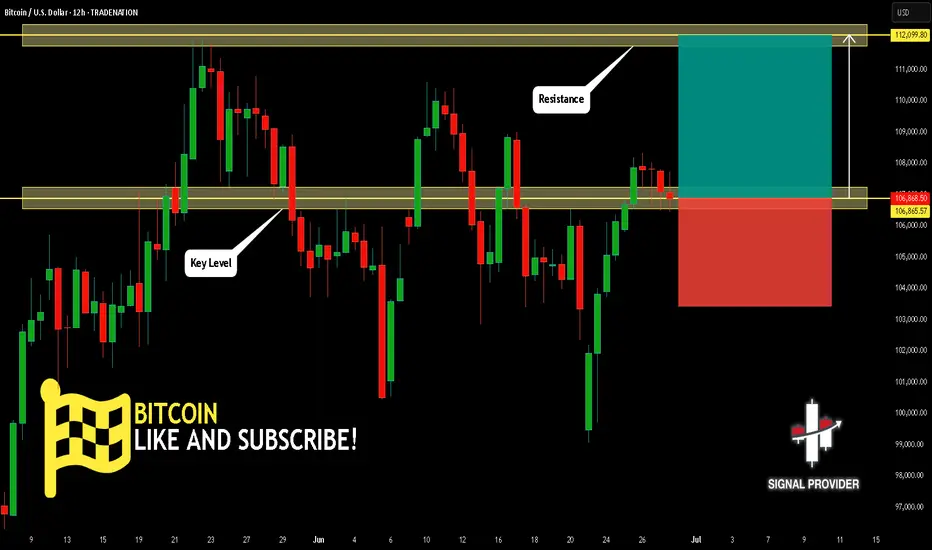
BITCOIN Is Bullish! Buy!
Here is our detailed technical review for BITCOIN.
Time Frame: 12h
Current Trend: Bullish
Sentiment: Oversold (based on 7-period RSI)
Forecast: Bullish
The market is approaching a significant support area 106,865.57.
The underlined horizontal cluster clearly indicates a highly probable bullish movement with target 112,099.80 level.
P.S
Overbought describes a period of time where there has been a significant and consistent upward move in price over a period of time without much pullback.
Disclosure: I am part of Trade Nation's Influencer program and receive a monthly fee for using their TradingView charts in my analysis.
Like and subscribe and comment my ideas if you enjoy them!
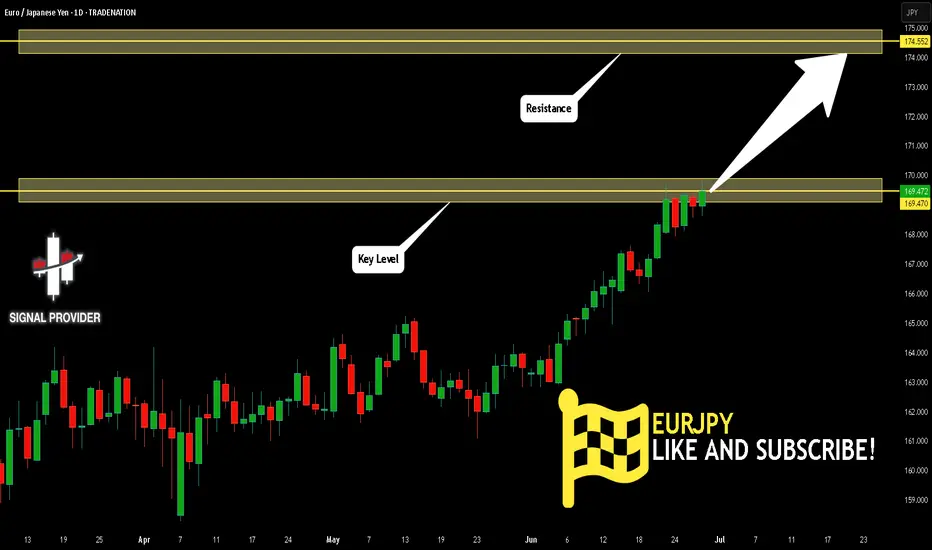
EURJPY Is Very Bullish! Long!
Take a look at our analysis for EURJPY.
Time Frame: 1D
Current Trend: Bullish
Sentiment: Oversold (based on 7-period RSI)
Forecast: Bullish
The market is on a crucial zone of demand 169.470.
The oversold market condition in a combination with key structure gives us a relatively strong bullish signal with goal 174.552 level.
P.S
Please, note that an oversold/overbought condition can last for a long time, and therefore being oversold/overbought doesn't mean a price rally will come soon, or at all.
Disclosure: I am part of Trade Nation's Influencer program and receive a monthly fee for using their TradingView charts in my analysis.
Like and subscribe and comment my ideas if you enjoy them!
GBPCHF Is Going Up! Buy!
Please, check our technical outlook for GBPCHF.
Time Frame: 2h
Current Trend: Bullish
Sentiment: Oversold (based on 7-period RSI)
Forecast: Bullish
The price is testing a key support 1.095.
Current market trend & oversold RSI makes me think that buyers will push the price. I will anticipate a bullish movement at least to 1.098 level.
P.S
The term oversold refers to a condition where an asset has traded lower in price and has the potential for a price bounce.
Overbought refers to market scenarios where the instrument is traded considerably higher than its fair value. Overvaluation is caused by market sentiments when there is positive news.
Disclosure: I am part of Trade Nation's Influencer program and receive a monthly fee for using their TradingView charts in my analysis.
Like and subscribe and comment my ideas if you enjoy them!

XAUUSD – Bearish Trend Continues After Channel BreakoutGold is currently moving within a clearly defined descending channel, with successive lower highs confirmed at each retest of the dynamic resistance line. Following news of a temporary ceasefire between Iran and Israel, gold's safe-haven appeal weakened, triggering strong selling pressure that drove prices sharply lower, breaking below the key $3,260 support.
A rounded top pattern and a clean breakout beneath the channel indicate that sellers are in control. The next downside target lies around the $3,218 confluence zone, where a temporary bullish reaction may occur. The nearest resistance on a pullback is around $3,349 – aligned with the broken upper channel boundary and a dense FVG zone.
If the price fails to quickly reclaim the broken channel, the bearish trend is likely to persist in the short term. Traders should closely monitor price action near the $3,218 zone for potential entries or reversals.

AUDUSD Potential UpsidesHey Traders, in today's trading session we are monitoring AUDUSD for a buying opportunity around 0.65300 zone, AUDUSD is trading in an uptrend and currently is in a correction phase in which it is approaching the trend at 0.65300 support and resistance area.
Trade safe, Joe.

GOLD Will Grow! Long!
Here is our detailed technical review for GOLD.
Time Frame: 1h
Current Trend: Bullish
Sentiment: Oversold (based on 7-period RSI)
Forecast: Bullish
The market is trading around a solid horizontal structure 3,290.38.
The above observations make me that the market will inevitably achieve 3,315.54 level.
P.S
We determine oversold/overbought condition with RSI indicator.
When it drops below 30 - the market is considered to be oversold.
When it bounces above 70 - the market is considered to be overbought.
Disclosure: I am part of Trade Nation's Influencer program and receive a monthly fee for using their TradingView charts in my analysis.
Like and subscribe and comment my ideas if you enjoy them!

EURGBP Will Go Higher! Long!
Here is our detailed technical review for EURGBP.
Time Frame: 9h
Current Trend: Bullish
Sentiment: Oversold (based on 7-period RSI)
Forecast: Bullish
The market is approaching a significant support area 0.852.
The underlined horizontal cluster clearly indicates a highly probable bullish movement with target 0.856 level.
P.S
The term oversold refers to a condition where an asset has traded lower in price and has the potential for a price bounce.
Overbought refers to market scenarios where the instrument is traded considerably higher than its fair value. Overvaluation is caused by market sentiments when there is positive news.
Disclosure: I am part of Trade Nation's Influencer program and receive a monthly fee for using their TradingView charts in my analysis.
Like and subscribe and comment my ideas if you enjoy them!

USD/CHF SENDS CLEAR BULLISH SIGNALS|LONG
Hello, Friends!
The BB lower band is nearby so USD-CHF is in the oversold territory. Thus, despite the downtrend on the 1W timeframe I think that we will see a bullish reaction from the support line below and a move up towards the target at around 0.801.
Disclosure: I am part of Trade Nation's Influencer program and receive a monthly fee for using their TradingView charts in my analysis.
LIKE AND COMMENT MY IDEAS

Gold Caught Between Bulls and Bears as Uncertainty BuildsGold prices continued to edge lower today, hovering around $3,320 per ounce, showing little change from the previous session. Interestingly, even as the US dollar dropped to its lowest level since February 2022 and Treasury yields fell, gold’s rebound remains limited — weighed down by a string of upbeat US economic data.
The US Dollar Index (DXY) slipped nearly 0.6% to 97.13, while the 10-year Treasury yield eased to 4.259% — both typically bullish signals for gold. However, optimism around the US economy is tempering safe-haven demand.
Adding to the uncertainty, reports suggest former President Donald Trump may announce a replacement for Fed Chair Jerome Powell as early as September or October, sparking speculation over future monetary policy direction.
Meanwhile, Fed officials such as Susan Collins and Thomas Barkin have reiterated that there is no strong case for rate cuts in July, warning that inflation could reaccelerate — especially under the pressure of renewed tariffs.
🔎 Technical view:
Gold remains supported near the 50-day moving average at $3,322, but RSI indicates growing bearish momentum. A breakout above $3,400 could reignite upside movement. However, if the price breaks below $3,300, the next key supports lie at $3,245, and deeper at $3,200.

Gold Slips Deeper – Bears in Full ControlGold extended its losing streak to a sixth straight day, sliding closer to the critical $3,300 level as a rebounding US dollar and Powell’s cautious tone dampen market sentiment.
Technically, the breakdown below the short-term ascending channel has validated a bearish structure. Daily chart indicators are turning decisively negative, suggesting the path of least resistance is still to the downside.
Unless a fresh risk event triggers safe-haven demand, any bounce from here may simply offer sellers a better price to re-enter. The downtrend is in motion — and it’s gaining steam.

Gold to $3,600? Hey traders! Gold ( OANDA:XAUUSD ) is back in the spotlight — not just for its shine, but because macro and technical signals are starting to align again.
Why gold still matters?
The US Dollar is weakening as markets expect the Fed to cut rates later this year.
Geopolitical tensions (like Iran–Israel) are still lurking despite temporary ceasefires.
Central banks are buying gold heavily — a clear long-term signal.
📈 Technically speaking:
Gold remains in a long-term uptrend.
Weekly EMAs are pointing upward.
Strong support sits around $3,260–$3,300.
A break above $3,440 could push prices toward $3,600 in the coming months.
💡 My take & strategy:
As a gold trader for 7 years, I always allocate part of my portfolio to long-term gold exposure.
“You don’t need to dig for gold — just wait for the market to sleep, then strike.” 😄
📌 Trade plan:
Buy on dips near $3,280–$3,300
Target: $3,480 – $3,600
What’s your take? Is gold still worth holding — or is it time to chase other trades? Let’s discuss below! 👇

MOONPIG - Solana Meme Coin Ready to Rocket in the Next Bull RunTechnical Analysis: Bullish Signals Flashing Bright:
The MOONPIG/USDT chart is painting a bullish picture. After a sharp retracement from its all-time high near a $125M market cap, the token has found solid support around $0.0045 and is now trading at $0.0052, showing signs of a reversal. Here’s what the charts tell us:
Breakout Momentum: On the 6-hour chart, $MOONPIG recently broke above a key downtrend line, signaling a shift from bearish to bullish momentum. A potential double bottom pattern suggests a continuation toward $0.008 or higher.
Support and Resistance: The $0.0045 level has held as strong support, with resistance looming near $0.0075 (a recent high). A clean break above $0.0075 could open the door to $0.01 or beyond, aligning with the 1.618 Fibonacci extension from the recent swing low.
With Bitcoin rallying and altcoins showing signs of life, $MOONPIG’s technical setup screams opportunity for traders eyeing a breakout.
Fundamentals:
Community Power: With over 18,000 holders as of early June 2025, $MOONPIG boasts a fiercely loyal community. Unlike many meme coins reliant on paid shills, its growth is organic, driven by retail investors who love its “normie-friendly” branding. Posts on X highlight strong morale, with users like JamesWynnReal calling it a “raging bull flag” poised for a $50M–$100M market cap.
Exchange Listings: Recent listings on HTX Global, MEXC, and LBank have boosted liquidity and visibility, with more exchanges reportedly in talks. These listings are a catalyst for retail FOMO, as seen in the $7M+ on-chain trading volume.
Solana’s Hot Streak: Solana’s fast, low-cost blockchain is the perfect home for meme coins like $MOONPIG. With Solana’s ecosystem thriving and retail interest in tokens like $POPCAT and SEED_WANDERIN_JIMZIP900:WIF soaring, $MOONPIG is well-positioned to ride the wave of altseason capital inflows.
Market Timing: As Bitcoin nears new highs and market sentiment turns bullish, low-cap meme coins historically see explosive gains.

Gold Potential UpsidesHey Traders, in today's trading session we are monitoring XAUUSD for a buying opportunity around 3,300 zone, Gold is trading in an uptrend and currently is in a correction phase in which it is approaching the trend at 3,300 support and resistance area.
Trade safe, Joe.

GBPUSD Potential UpsidesHey Traders, in today's trading session we are monitoring GBPUSD for a buying opportunity around 1.37000 zone, GBPUSD is trading in an uptrend and currently is in a correction phase in which it is approaching the trend at 1.37000 support and resistance area.
Trade safe, Joe.

USDJPY – Uptrend Still Intact, But Waiting for a BounceUSDJPY is currently pulling back toward the key support zone at 142.244 after being rejected from the 148.000 resistance area. This recent drop reflects strong selling pressure from the dense FVG zones near Resistance 2.
However, the overall structure remains bullish, with a series of higher highs and higher lows still intact. The current support zone is crucial—if it holds, USDJPY could rebound toward 145.800 and potentially retest the 148.000 level.
On the news front:
– A fragile ceasefire between Iran and Israel has improved global risk sentiment, reducing demand for USD as a safe haven.
– The Bank of Japan kept interest rates unchanged and signaled caution in reducing bond purchases—supporting the yen, but not enough to reverse the dollar's edge.
– The wide interest rate differential still favors the USD.
Strategy: Watch for bullish confirmation at 142.244. If buyers step in clearly, it may present a long opportunity in line with the dominant uptrend.

EURUSD – Short-Term Top Signal, Sellers Getting ReadyEURUSD has reached the upper boundary of the ascending channel around 1.17190 and immediately faced selling pressure. This zone previously acted as a strong reversal area, and with a rejection candlestick and a forming FVG, the risk of a downward correction is increasing.
Currently, the price is moving sideways just below the high, forming lower highs — suggesting a possible distribution pattern before breaking the bullish structure. If price breaks below the FVG zone near 1.165–1.166, the move could extend toward the technical target at 1.15900 — aligning with the channel bottom and a historical liquidity area.
Recent fundamental drivers:
U.S. economic data remains strong (Jobless Claims, Core PCE) → supports USD strength
The ECB remains cautious and hasn’t committed to further rate hikes → slightly weakens the euro

Is Gold Setting a Trap for Traders?Gold is currently retesting the FVG zone around 3,392 after breaking below a key trendline — a classic sell-trigger area if price gets rejected.
Bearish momentum is supported by:
U.S. jobless claims: 244K < 245K forecast → Stronger USD
Iran–Israel ceasefire → Reduced demand for safe-haven assets
If price fails to break above 3,392, the next downside target is the 3,299 support zone.
Trade idea: Watch for a rejection around 3,390–3,392 to consider short positions.
Bearish bias remains valid as long as price stays below 3,392.

US30 - Long 43,150Still looking for that 43,150 lets get a test of FVG then on bullish PA above we can plan trade. Stops would go below the order block.

SILVER Will Go Up! Buy!
Take a look at our analysis for SILVER.
Time Frame: 9h
Current Trend: Bullish
Sentiment: Oversold (based on 7-period RSI)
Forecast: Bullish
The market is on a crucial zone of demand 3,655.5.
The oversold market condition in a combination with key structure gives us a relatively strong bullish signal with goal 3,780.6 level.
P.S
We determine oversold/overbought condition with RSI indicator.
When it drops below 30 - the market is considered to be oversold.
When it bounces above 70 - the market is considered to be overbought.
Disclosure: I am part of Trade Nation's Influencer program and receive a monthly fee for using their TradingView charts in my analysis.
Like and subscribe and comment my ideas if you enjoy them!

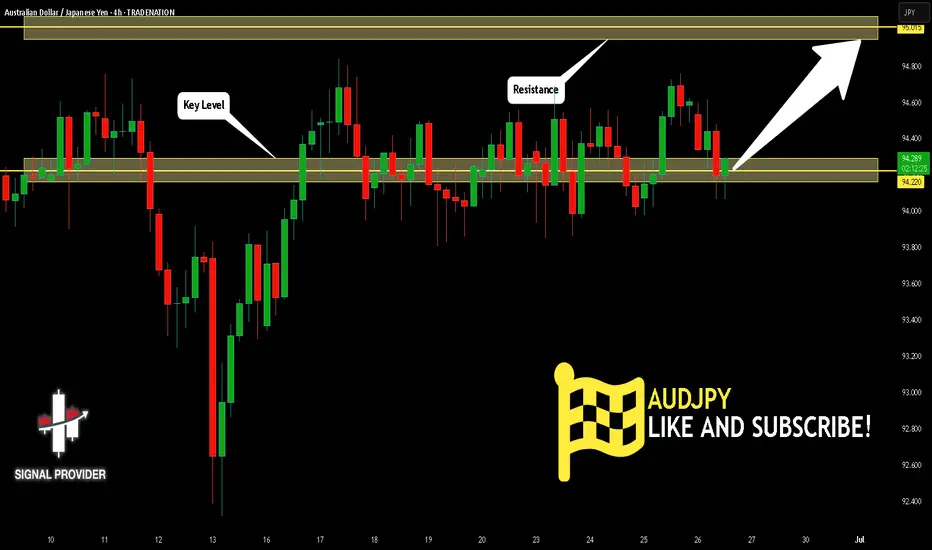
AUDJPY Is Bullish! Long!
Here is our detailed technical review for AUDJPY.
Time Frame: 4h
Current Trend: Bullish
Sentiment: Oversold (based on 7-period RSI)
Forecast: Bullish
The market is trading around a solid horizontal structure 94.220.
The above observations make me that the market will inevitably achieve 95.015 level.
P.S
Please, note that an oversold/overbought condition can last for a long time, and therefore being oversold/overbought doesn't mean a price rally will come soon, or at all.
Disclosure: I am part of Trade Nation's Influencer program and receive a monthly fee for using their TradingView charts in my analysis.
Like and subscribe and comment my ideas if you enjoy them!
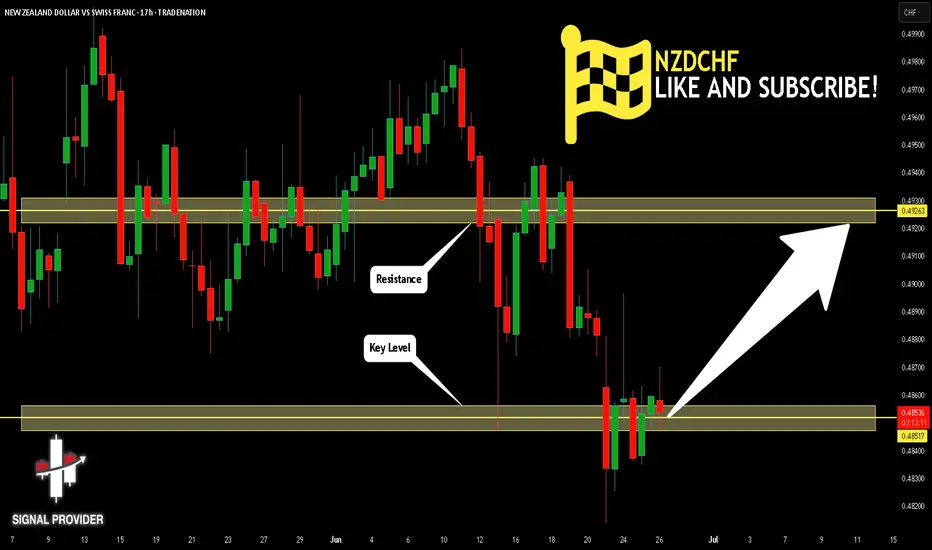
NZDCHF Is Very Bullish! Buy!
Take a look at our analysis for NZDCF
Time Frame: 17h
Current Trend: Bullish
Sentiment: Oversold (based on 7-period RSI)
Forecast: Bullish
The market is testing a major horizontal structure 0.485.
Taking into consideration the structure & trend analysis, I believe that the market will reach 0.492 level soon.
P.S
The term oversold refers to a condition where an asset has traded lower in price and has the potential for a price bounce.
Overbought refers to market scenarios where the instrument is traded considerably higher than its fair value. Overvaluation is caused by market sentiments when there is positive news.
Disclosure: I am part of Trade Nation's Influencer program and receive a monthly fee for using their TradingView charts in my analysis.
Like and subscribe and comment my ideas if you enjoy them!