GBPCHF Will Grow! Long!
Here is our detailed technical review for GBPCHF.
Time Frame: 12h
Current Trend: Bullish
Sentiment: Oversold (based on 7-period RSI)
Forecast: Bullish
The market is trading around a solid horizontal structure 1.142.
The above observations make me that the market will inevitably achieve 1.150 level.
P.S
We determine oversold/overbought condition with RSI indicator.
When it drops below 30 - the market is considered to be oversold.
When it bounces above 70 - the market is considered to be overbought.
Disclosure: I am part of Trade Nation's Influencer program and receive a monthly fee for using their TradingView charts in my analysis.
Like and subscribe and comment my ideas if you enjoy them!
Buy
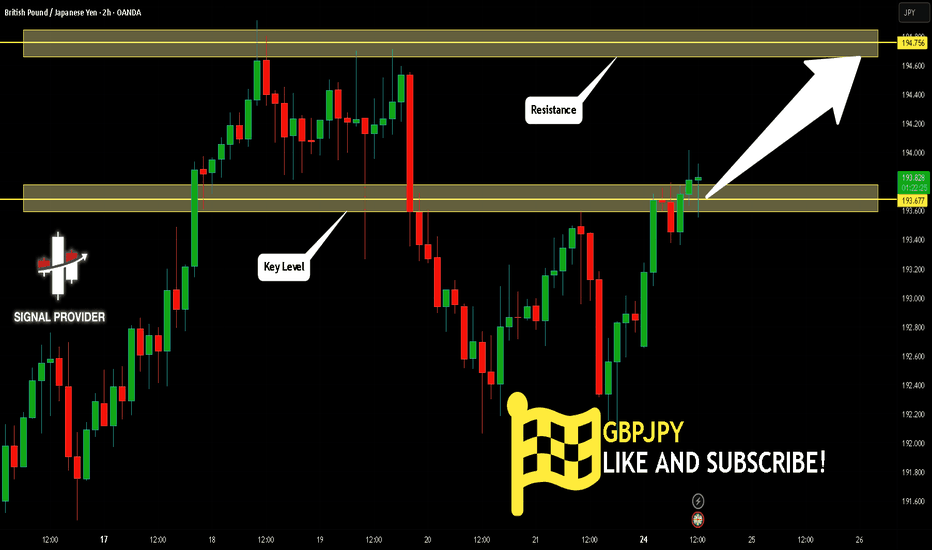
GBPJPY Will Go Higher! Buy!
Here is our detailed technical review for GBPJPY.
Time Frame: 2h
Current Trend: Bullish
Sentiment: Oversold (based on 7-period RSI)
Forecast: Bullish
The market is approaching a significant support area 193.677.
The underlined horizontal cluster clearly indicates a highly probable bullish movement with target 194.756 level.
P.S
The term oversold refers to a condition where an asset has traded lower in price and has the potential for a price bounce.
Overbought refers to market scenarios where the instrument is traded considerably higher than its fair value. Overvaluation is caused by market sentiments when there is positive news.
Disclosure: I am part of Trade Nation's Influencer program and receive a monthly fee for using their TradingView charts in my analysis.
Like and subscribe and comment my ideas if you enjoy them!
USD/JPY(20250325)Today's AnalysisToday's buying and selling boundaries:
150.25
Support and resistance levels:
151.62
151.11
150.78
149.73
149.40
148.89
Trading strategy:
If the price breaks through 150.78, consider buying, the first target price is 151.11
If the price breaks through 150.25, consider selling, the first target price is 149.73
avax buy limit midterm "🌟 Welcome to Golden Candle! 🌟
We're a team of 📈 passionate traders 📉 who love sharing our 🔍 technical analysis insights 🔎 with the TradingView community. 🌎
Our goal is to provide 💡 valuable perspectives 💡 on market trends and patterns, but 🚫 please note that our analyses are not intended as buy or sell recommendations. 🚫
Instead, they reflect our own 💭 personal attitudes and thoughts. 💭
Follow along and 📚 learn 📚 from our analyses! 📊💡"
$UBER is HOTT! H5 Swing Trade with 10% Upside!NYSE:UBER is looking nice. Currently in it as a swing.
Undervalued and has been a holding up really well in this correction.
Markets get going next few weeks this name will get to $100 QUICK!
PTs: $82 / $85
WCB forming
Bullish H5_S indicator is bullish Cross
Volume Shelf Launch
Bull flag breakout!
Not financial advice.
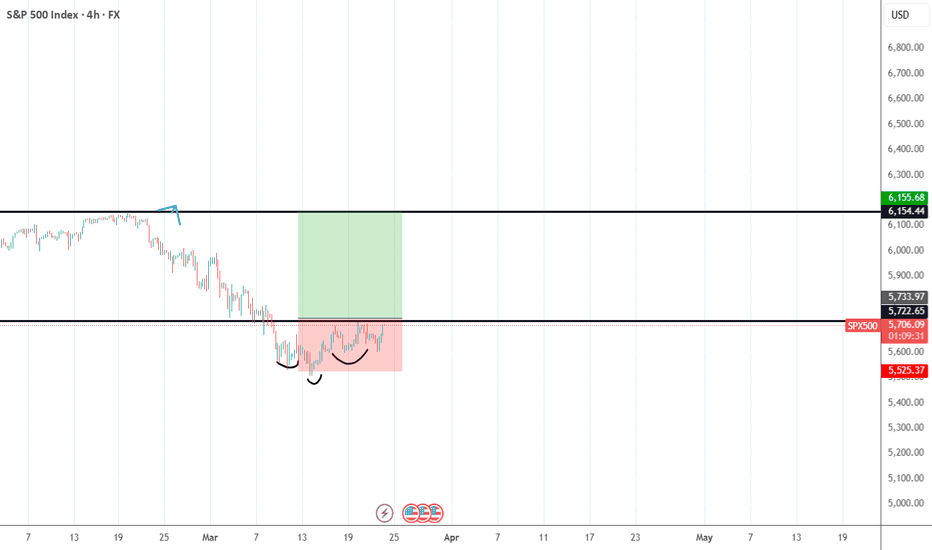
BUY SPX500SPX500 Trade Idea: Bullish Continuation Setup
Market Overview
The SPX500 has shown strong bullish momentum, and a continuation of this trend is likely if price holds above the 5,772-support area. A confirmed breakout from this level could provide an ideal buying opportunity.
Trade Setup
Entry: Buy at 5,733 (waiting for confirmation at key support)
Stop Loss (SL): 5,525 (below strong support zone)
Take Profit (TP): 6,154 (next key resistance level)
Analysis & Rationale
✅ Bullish Trend Continuation – Price action suggests strong momentum, favoring further upside.
✅ Key Support at 5,772 – A breakout above this level will confirm bullish strength.
✅ Favorable Risk-to-Reward Ratio – Well-defined SL and TP provide a balanced strategy.
Trading Plan & Execution
Wait for confirmation at 5,772 before entering.
If price holds, execute a buy order at 5,733.
Set SL at 5,525 to limit downside risk.
Take profit at 6,154, adjusting the stop-loss accordingly if price gains momentum.
This trade setup follows the bullish market structure, providing an opportunity to capitalize on SPX500’s continued upside potential. However, monitor economic data and global market sentiment for any shifts in trend.
📌 Risk Disclaimer: Always implement proper risk management and adjust your strategy as market conditions evolve.
USD/JPY(20250324)Today's AnalysisToday's buying and selling boundaries:
149.18
Support and resistance levels:
150.25
149.85
148.59
148.77
148.51
148.11
Trading strategy:
If the price breaks through 148.59, consider buying, the first target price is 149.85
If the price breaks through 149.18, consider selling, the first target price is 148.77
$OSCR - 77% Upside if we HODOR!!NYSE:OSCR - HODOR!!!
Strong Support has been created at $12.15-$13.25 throughout the last two years.
It's held every time, if we hold again and market plays ball then...
🎯$16.50 & $23 are INBOUND!
- All indicators curling up
- At key support
- Name has a lot of big names behind it.
- Extremely undervalued
Not financial advice
BITCOIN Is Very Bullish! Long!
Take a look at our analysis for BITCOIN.
Time Frame: 9h
Current Trend: Bullish
Sentiment: Oversold (based on 7-period RSI)
Forecast: Bullish
The market is testing a major horizontal structure 84,125.
Taking into consideration the structure & trend analysis, I believe that the market will reach 90,061 level soon.
P.S
The term oversold refers to a condition where an asset has traded lower in price and has the potential for a price bounce.
Overbought refers to market scenarios where the instrument is traded considerably higher than its fair value. Overvaluation is caused by market sentiments when there is positive news.
Disclosure: I am part of Trade Nation's Influencer program and receive a monthly fee for using their TradingView charts in my analysis.
Like and subscribe and comment my ideas if you enjoy them!
GBPCHF Is Going Up! Buy!
Please, check our technical outlook for GBPCHF.
Time Frame: 1D
Current Trend: Bullish
Sentiment: Oversold (based on 7-period RSI)
Forecast: Bullish
The market is approaching a key horizontal level 1.140.
Considering the today's price action, probabilities will be high to see a movement to 1.151.
P.S
We determine oversold/overbought condition with RSI indicator.
When it drops below 30 - the market is considered to be oversold.
When it bounces above 70 - the market is considered to be overbought.
Disclosure: I am part of Trade Nation's Influencer program and receive a monthly fee for using their TradingView charts in my analysis.
Like and subscribe and comment my ideas if you enjoy them!
EUR/CHF BUYERS WILL DOMINATE THE MARKET|LONG
Hello, Friends!
EUR/CHF is trending up which is clear from the green colour of the previous weekly candle. However, the price has locally plunged into the oversold territory. Which can be told from its proximity to the BB lower band. Which presents a great trend following opportunity for a long trade from the support line below towards the supply level of 0.963.
Disclosure: I am part of Trade Nation's Influencer program and receive a monthly fee for using their TradingView charts in my analysis.
✅LIKE AND COMMENT MY IDEAS✅
GBPUSD Will Go Up! Buy!
Here is our detailed technical review for GBPUSD.
Time Frame: 2h
Current Trend: Bullish
Sentiment: Oversold (based on 7-period RSI)
Forecast: Bullish
The market is trading around a solid horizontal structure 1.293.
The above observations make me that the market will inevitably achieve 1.297 level.
P.S
We determine oversold/overbought condition with RSI indicator.
When it drops below 30 - the market is considered to be oversold.
When it bounces above 70 - the market is considered to be overbought.
Disclosure: I am part of Trade Nation's Influencer program and receive a monthly fee for using their TradingView charts in my analysis.
Like and subscribe and comment my ideas if you enjoy them!
EUR/NZD BEST PLACE TO BUY FROM|LONG
EUR/NZD SIGNAL
Trade Direction: long
Entry Level: 1.881
Target Level: 1.888
Stop Loss: 1.876
RISK PROFILE
Risk level: medium
Suggested risk: 1%
Timeframe: 1h
Disclosure: I am part of Trade Nation's Influencer program and receive a monthly fee for using their TradingView charts in my analysis.
✅LIKE AND COMMENT MY IDEAS✅
EUR/CAD LONG FROM SUPPORT
Hello, Friends!
EUR/CAD pair is trading in a local uptrend which know by looking at the previous 1W candle which is green. On the 3H timeframe the pair is going down. The pair is oversold because the price is close to the lower band of the BB indicator. So we are looking to buy the pair with the lower BB line acting as support. The next target is 1.566 area.
Disclosure: I am part of Trade Nation's Influencer program and receive a monthly fee for using their TradingView charts in my analysis.
✅LIKE AND COMMENT MY IDEAS✅
US500 Is Bullish! Long!
Please, check our technical outlook for US500.
Time Frame: 1D
Current Trend: Bullish
Sentiment: Oversold (based on 7-period RSI)
Forecast: Bullish
The market is approaching a key horizontal level 5,657.57.
Considering the today's price action, probabilities will be high to see a movement to 5,809.58.
P.S
Please, note that an oversold/overbought condition can last for a long time, and therefore being oversold/overbought doesn't mean a price rally will come soon, or at all.
Disclosure: I am part of Trade Nation's Influencer program and receive a monthly fee for using their TradingView charts in my analysis.
Like and subscribe and comment my ideas if you enjoy them!
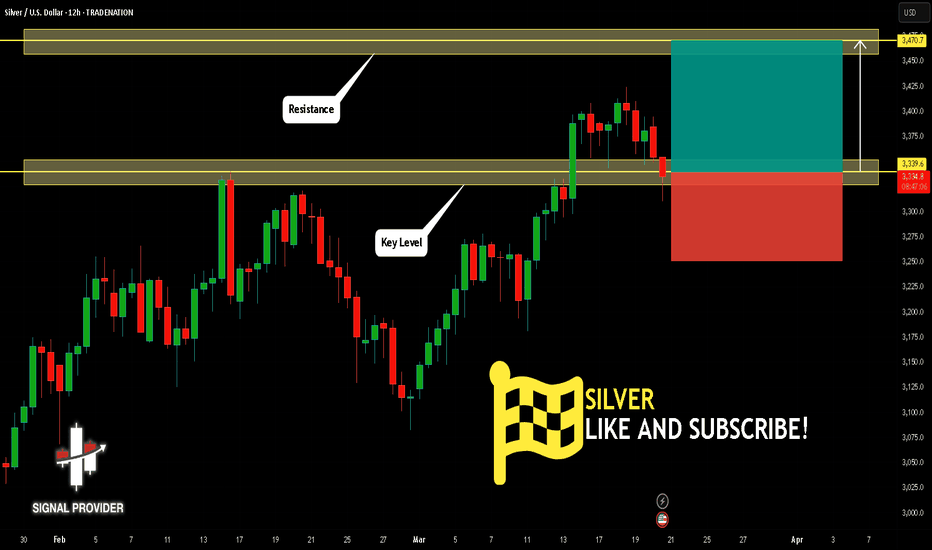
SILVER Is Very Bullish! Buy!
Here is our detailed technical review for SILVER.
Time Frame: 12h
Current Trend: Bullish
Sentiment: Oversold (based on 7-period RSI)
Forecast: Bullish
The market is approaching a significant support area 3,339.6.
The underlined horizontal cluster clearly indicates a highly probable bullish movement with target 3,470.7 level.
P.S
The term oversold refers to a condition where an asset has traded lower in price and has the potential for a price bounce.
Overbought refers to market scenarios where the instrument is traded considerably higher than its fair value. Overvaluation is caused by market sentiments when there is positive news.
Disclosure: I am part of Trade Nation's Influencer program and receive a monthly fee for using their TradingView charts in my analysis.
Like and subscribe and comment my ideas if you enjoy them!
USDCAD Is Going Up! Long!
Take a look at our analysis for USDCAD.
Time Frame: 10h
Current Trend: Bullish
Sentiment: Oversold (based on 7-period RSI)
Forecast: Bullish
The market is on a crucial zone of demand 1.437.
The oversold market condition in a combination with key structure gives us a relatively strong bullish signal with goal 1.446 level.
P.S
We determine oversold/overbought condition with RSI indicator.
When it drops below 30 - the market is considered to be oversold.
When it bounces above 70 - the market is considered to be overbought.
Disclosure: I am part of Trade Nation's Influencer program and receive a monthly fee for using their TradingView charts in my analysis.
Like and subscribe and comment my ideas if you enjoy them!
EUR/JPY SENDS CLEAR BULLISH SIGNALS|LONG
EUR/JPY SIGNAL
Trade Direction: long
Entry Level: 161.131
Target Level: 162.550
Stop Loss: 160.184
RISK PROFILE
Risk level: medium
Suggested risk: 1%
Timeframe: 3h
Disclosure: I am part of Trade Nation's Influencer program and receive a monthly fee for using their TradingView charts in my analysis.
✅LIKE AND COMMENT MY IDEAS✅
EUR/GBP BULLS ARE GAINING STRENGTH|LONG
Hello, Friends!
We are targeting the 0.841 level area with our long trade on EUR/GBP which is based on the fact that the pair is oversold on the BB band scale and is also approaching a support line below thus going us a good entry option.
Disclosure: I am part of Trade Nation's Influencer program and receive a monthly fee for using their TradingView charts in my analysis.
✅LIKE AND COMMENT MY IDEAS✅
Buy this token at least for a short price movementThis has reached the lowest price in its history and made a lowest low but it couldn't stabilize the price below the prior low. Besides, it broke a trend line ant made a short but obvious TR above the broken trend line, so you can buy at multiple prices in this area and wait at least for 0.6666 as the FIRST exit target OR hold it for the higher prices.


