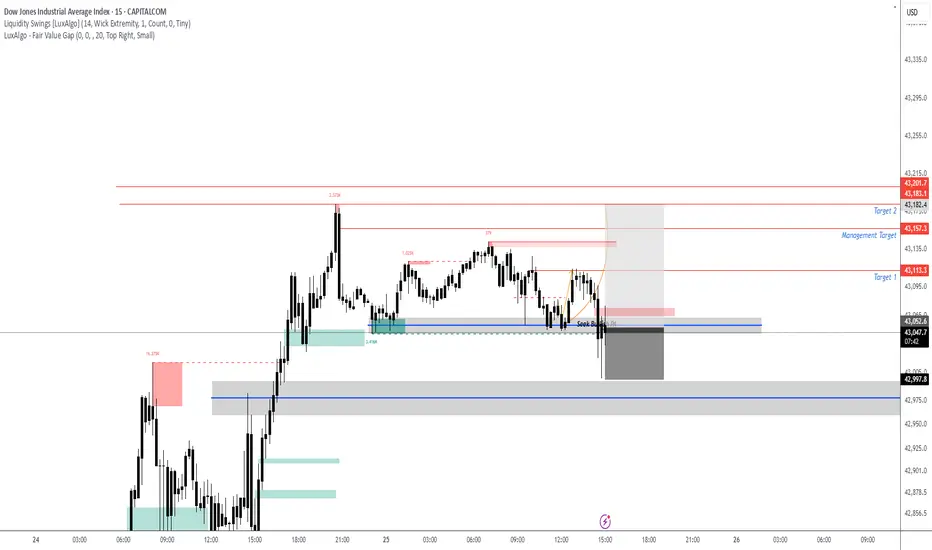
US30 - Entries ActiveAs anticipated got the sweep below then break above our area with a U shape formation. Looking to the upside.
Buy
JEF Jefferies Financial Group Options Ahead of EarningsIf you haven`t bought JEF before the previous earnings:
Now analyzing the options chain and the chart patterns of JEF Jefferies Financial Group prior to the earnings report this week,
I would consider purchasing the 57.50usd strike price Calls with
an expiration date of 2025-7-18,
for a premium of approximately $1.40.
If these options prove to be profitable prior to the earnings release, I would sell at least half of them.

MU Micron Technology Options Ahead of EarningsIf you haven`t bought MU before the rally:
Now analyzing the options chain and the chart patterns of MU Micron Technology prior to the earnings report this week,
I would consider purchasing the 128usd strike price Calls with
an expiration date of 2025-6-27,
for a premium of approximately $5.52.
If these options prove to be profitable prior to the earnings release, I would sell at least half of them.
Disclosure: I am part of Trade Nation's Influencer program and receive a monthly fee for using their TradingView charts in my analysis.

MKC McCormick & Company Options Ahead of EarningsAnalyzing the options chain and the chart patterns of MKC McCormick & Company prior to the earnings report this week,
I would consider purchasing the 85usd strike price Calls with
an expiration date of 2026-1-16,
for a premium of approximately $1.40.
If these options prove to be profitable prior to the earnings release, I would sell at least half of them.
Disclosure: I am part of Trade Nation's Influencer program and receive a monthly fee for using their TradingView charts in my analysis.

NKE NIKE Options Ahead of EarningsIf you haven`t sold NKE before the previous earnings:
Now analyzing the options chain and the chart patterns of NKE NIKE prior to the earnings report this week,
I would consider purchasing the 62usd strike price Calls with
an expiration date of 2025-7-3,
for a premium of approximately $2.29.
If these options prove to be profitable prior to the earnings release, I would sell at least half of them.
Disclosure: I am part of Trade Nation's Influencer program and receive a monthly fee for using their TradingView charts in my analysis.

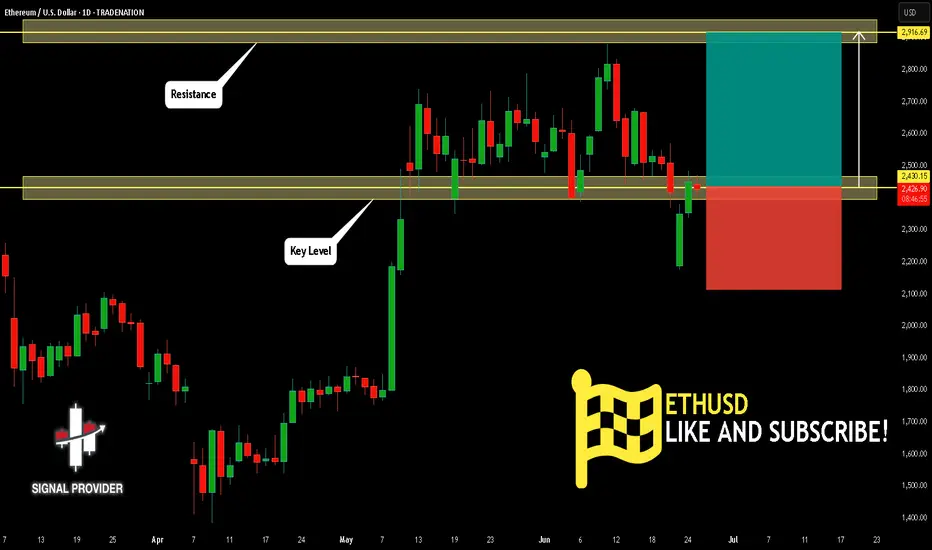
ETHUSD Is Going Up! Long!
Please, check our technical outlook for ETHUSD.
Time Frame: 1D
Current Trend: Bullish
Sentiment: Oversold (based on 7-period RSI)
Forecast: Bullish
The market is approaching a key horizontal level 2,430.15.
Considering the today's price action, probabilities will be high to see a movement to 2,916.69.
P.S
We determine oversold/overbought condition with RSI indicator.
When it drops below 30 - the market is considered to be oversold.
When it bounces above 70 - the market is considered to be overbought.
Disclosure: I am part of Trade Nation's Influencer program and receive a monthly fee for using their TradingView charts in my analysis.
Like and subscribe and comment my ideas if you enjoy them!
USOIL LONG FROM SUPPORT
USOIL SIGNAL
Trade Direction: long
Entry Level: 64.84
Target Level: 70.03
Stop Loss: 61.37
RISK PROFILE
Risk level: medium
Suggested risk: 1%
Timeframe: 9h
Disclosure: I am part of Trade Nation's Influencer program and receive a monthly fee for using their TradingView charts in my analysis.
✅LIKE AND COMMENT MY IDEAS✅

NZD/CHF SENDS CLEAR BULLISH SIGNALS|LONG
Hello, Friends!
NZD/CHF pair is trading in a local downtrend which we know by looking at the previous 1W candle which is red. On the 1D timeframe the pair is going down too. The pair is oversold because the price is close to the lower band of the BB indicator. So we are looking to buy the pair with the lower BB line acting as support. The next target is 0.496 area.
Disclosure: I am part of Trade Nation's Influencer program and receive a monthly fee for using their TradingView charts in my analysis.
✅LIKE AND COMMENT MY IDEAS✅

CAD/CHF BULLS ARE GAINING STRENGTH|LONG
Hello, Friends!
We are going long on the CAD/CHF with the target of 0.594 level, because the pair is oversold and will soon hit the support line below. We deduced the oversold condition from the price being near to the lower BB band. However, we should use low risk here because the 1W TF is red and gives us a counter-signal.
Disclosure: I am part of Trade Nation's Influencer program and receive a monthly fee for using their TradingView charts in my analysis.
✅LIKE AND COMMENT MY IDEAS✅

GBPUSD – Bullish Structure Holds, Waiting for a Clean RetestGBPUSD recently bounced strongly from the ascending trendline and hit resistance at 1.36300. The price is now slightly correcting, with a high probability of retesting the 1.35000 support zone – an area of FVG and technical confluence.
The bullish structure remains intact as long as price holds above this level. Positive UK Services PMI data further supports the medium-term uptrend.
Are you waiting for the pullback to jump in?

XAUUSD – Short-Term Decline, Long-Term Bullish AccumulationAfter a sharp drop of over 1,250 pips yesterday, gold reacted at the key demand zone around 3,300, where initial buying pressure has emerged. The chart still shows a valid short-term downtrend, but this area also aligns with the lower boundary of a long-term channel—previously a launch point for significant upward moves.
Currently, XAUUSD is consolidating below multiple unfilled Fair Value Gaps, awaiting a confirmed breakout toward the 3,361.500 region to potentially reverse the trend.
In terms of news, tensions in the Middle East escalated as the U.S. launched airstrikes on Iran’s nuclear facilities, triggering strong volatility in gold. Upcoming key U.S. economic data—including quarterly GDP and the Fed’s preferred inflation gauge, Core PCE—will play a crucial role in determining whether gold has the momentum to break out or remains in consolidation.
For now, the short-term bias remains bearish, but buyers are quietly accumulating strength for a potential long-term rally.

Gold Pullback to Resistance – Bearish Setup in PlayOANDA:XAUUSD is staging a modest technical rebound after a strong breakdown, currently retesting the confluence zone of resistance and EMA on the 1H chart. This area around 3,351 USD marks a key selling region where bearish momentum may resume.
On the macro front, traders are eyeing the upcoming Core PCE data — the Fed’s preferred inflation gauge. A higher-than-expected reading could boost the US dollar and reinforce downward pressure on gold prices.
Technically, the recent breakdown followed by a retest of structure suggests bearish continuation. If gold fails to break above resistance, it may drop first toward the 3,304 USD zone (TP1) and potentially extend to the key support near 3,250 USD (TP2).
All eyes should be on how price reacts to resistance. A confirmed rejection could offer a high-probability short opportunity.

BTCUSDT – Rebound from trendline, targeting 115,300On the daily chart, BTCUSDT has bounced from a confluence support zone around 105,200, where the rising trendline meets the FVG, confirming that the bullish structure remains intact. The current price pattern suggests a continuation of the uptrend, with a short-term target at the 115,300 resistance zone — a level that has previously rejected price multiple times.
If this level is broken, momentum could extend toward the 120,000 area in the medium term. As long as the price holds above the trendline, the bullish outlook remains valid.
On the news front, market sentiment is improving as Bitcoin spot ETFs in the U.S. show signs of renewed inflows, coupled with growing expectations that the Fed might pause rate hikes due to recent signs of economic weakness.

APX Rebound in Play?📈 “APX Rebound in Play? Eyeing the AUD 1.55 Resistance”
Appen (APX) has shown a significant uptick today, closing at AUD 1.040 (+5.58%) with a sharp volume spike (8.96M shares) that could suggest accumulation. After a long downtrend, price appears to be consolidating above key support near AUD 1.00, forming a potential base for reversal.
🔍 Chart Highlights:
Support Zone: AUD 1.000 – strong historical level holding.
Resistance Targets: → AUD 1.555 → AUD 1.655 → AUD 1.785
R/R Setup: Defined green zone shows potential upside if momentum continues; red zone clearly marks invalidation below support.
🧠 Thesis: If APX maintains momentum and holds above AUD 1.00, we may be witnessing a structural shift with upside potential toward AUD 1.78 in stages. Breakout traders might watch for confirmation via volume and price action at each resistance.
💬 “Could we be looking at an early-stage reversal or just a dead-cat bounce? Watching the 1.00 level closely.”
#ASX #APX #APPEN #MJTRADING #TRADING #SHARE #STOCKMARKET #BUY #CHART #MONEYMANAGEMENT

Patience has to be the Major Play in waiting on these Set ups! Was waiting for the sweep on gold to happen and they didnt do it till the very end of the day yesterday. Looking for the bullish action to continue. If we can get a breakout tonight then i will look for possible levels of support.

GBPUSD Breakout and Potential RetraceHey Traders, in today's trading session we are monitoring GBPUSD for a buying opportunity around 1.35900 zone, GBPUSD was trading in a downtrend and successfully managed to break it out. Currently is in a correction phase in which it is approaching the retrace area at 1.35900 support and resistance area.
Trade safe, Joe.

High Probability BUY Zone at The Edge📍 XAUUSD – High Probability BUY Zone at The Edge
Gold is currently reacting at a high probability BUY area, supported by multiple technical confluences:
✅ $3,300 Round Number: Psychological level and historical reaction zone
✅ Completion of 2nd Bearish Leg: A classic two-leg correction often signals exhaustion
✅ Retest of Uptrend Boundary: Long-term ascending trendline that has supported price since March
📌 Entry: Current price zone
🎯 TP1: Local highs ($3,353)
🎯 TP2: Mid-channel or upper resistance zone ($3,398)
❌ SL: 3263
This is a textbook trend continuation setup — the structure remains bullish unless proven otherwise.
Wait for confirmation or manage your risk accordingly.
—
#XAUUSD #Gold #ForexTrading #MJTrading #TechnicalAnalysis #BuyZone #SwingTrade #SupportZone #TrendlineSupport #SmartMoney #PriceAction #ForexSignals #CommodityTrading #MarketStructure #RiskReward #ChartSetup #ForexCommunity


LONG ON USD/JPYLong on UJ
- Price is respecting a major demand zone after a break and retest
- DXY (Dollar) is bullish
- Yen Bearish

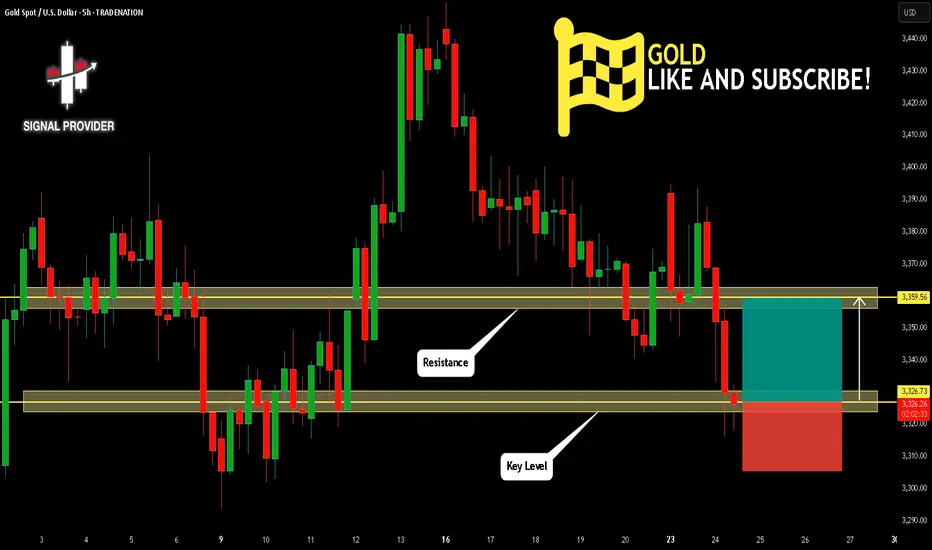
GOLD Will Go Higher! Long!
Here is our detailed technical review for GOLD.
Time Frame: 5h
Current Trend: Bullish
Sentiment: Oversold (based on 7-period RSI)
Forecast: Bullish
The market is trading around a solid horizontal structure 3,326.73.
The above observations make me that the market will inevitably achieve 3,359.56 level.
P.S
We determine oversold/overbought condition with RSI indicator.
When it drops below 30 - the market is considered to be oversold.
When it bounces above 70 - the market is considered to be overbought.
Disclosure: I am part of Trade Nation's Influencer program and receive a monthly fee for using their TradingView charts in my analysis.
Like and subscribe and comment my ideas if you enjoy them!
USDJPY Will Go Up! Buy!
Take a look at our analysis for USDJPY.
Time Frame: 9h
Current Trend: Bullish
Sentiment: Oversold (based on 7-period RSI)
Forecast: Bullish
The market is testing a major horizontal structure 145.018.
Taking into consideration the structure & trend analysis, I believe that the market will reach 146.793 level soon.
P.S
Overbought describes a period of time where there has been a significant and consistent upward move in price over a period of time without much pullback.
Disclosure: I am part of Trade Nation's Influencer program and receive a monthly fee for using their TradingView charts in my analysis.
Like and subscribe and comment my ideas if you enjoy them!

Gold Holds the Line – Will It Break Above $3,500?Gold continues to maintain its long-term uptrend after a technical pullback toward dynamic support around $3,325, aligning with both the EMA34 and the rising trendline.
If price rebounds from this zone and breaks above the key resistance between $3,460 and $3,500, a strong rally toward $3,600 could unfold in the medium term.
However, upcoming U.S. economic data—including GDP and the Fed’s preferred inflation gauge, Core PCE—will be critical in determining whether gold has the momentum for a breakout or remains in consolidation.
Are you holding gold, or waiting on the sidelines?

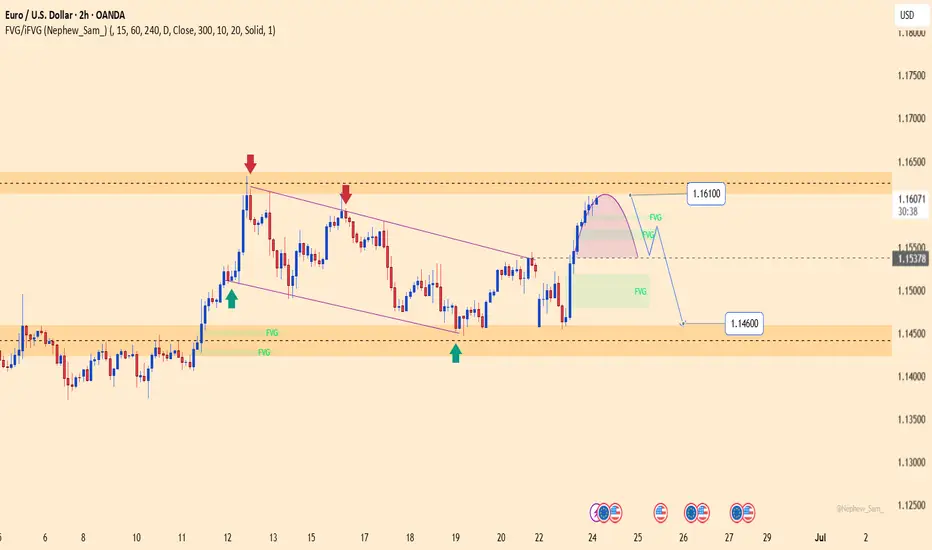
EURUSD – Rejected at 1.16100, bearish pressure re-emergingEURUSD has just completed a technical rebound toward the 1.16100 resistance zone, which has previously rejected price multiple times. The current structure suggests a mild reversal, with a potential pullback toward 1.15378. A break below this support could extend the decline toward 1.14600.
Recent upside momentum came mainly from temporary USD weakness, but the greenback remains supported by expectations that the Fed will keep interest rates elevated, while Eurozone PMI data continues to disappoint.
In summary, 1.16100 remains a key resistance level. If price shows clear rejection here, EURUSD may be poised for a deeper correction in the short term.