XAUUSD – Holding Support, Potential Rebound in SightOn the H4 chart, gold recently dropped over 1,250 pips, but is now showing signs of stabilizing around the key support zone at 3,303 USD. Although price temporarily broke below the ascending trendline, current price action suggests a possible false breakout. If support holds, a rebound toward the 3,418 USD resistance – aligning with the previous trendline and an unfilled FVG – becomes likely.
Yesterday’s decline was largely triggered by news that the U.S. carried out airstrikes on Iranian nuclear sites, boosting the USD and pressuring gold. However, the broader market remains sensitive, with traders awaiting crucial U.S. data – including Q1 GDP and Core PCE, the Fed’s preferred inflation gauge.
If these upcoming releases signal economic slowdown or easing inflation, gold may regain upside momentum. As long as 3,303 USD holds, the technical structure favors a short-term bullish scenario.
Buy

Have we made a Low for the Week yet on Gold???Im looking for price to sweep Monday's low before deciding what it wants to do. I want to see everything line up inside of the killzone to take advantage. Just have to be patient. We still have a lil time so sitting on my hands until it all looks clear to proceed with the move.

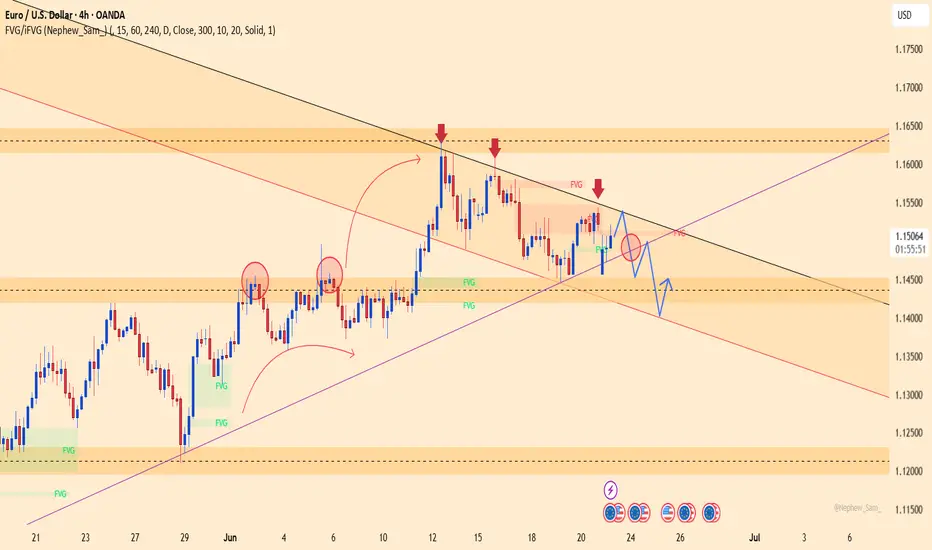
Euro – Eyes 1.15400, Awaits Powell's ToneEuro has just filled a GAP and rebounded strongly from the FVG zone around 1.14500. It is now approaching the 1.15400 resistance area, where a descending trendline intersects with a supply FVG. The bullish momentum remains intact within the short-term correction channel, but a rejection at this level could trigger a pullback.
On the news front, US Flash Manufacturing PMI is expected to decline, while Fed Chair Jerome Powell is set to testify this week. If he adopts a dovish tone, the USD may weaken further, potentially giving EURUSD the push it needs to break through resistance.
Strategy: Wait for a clear breakout above 1.15400 to confirm further upside. If rejected, watch the 1.14000 zone as a key support.
USOIL Is Very Bullish! Long!
Take a look at our analysis for USOIL.
Time Frame: 1D
Current Trend: Bullish
Sentiment: Oversold (based on 7-period RSI)
Forecast: Bullish
The market is on a crucial zone of demand 73.546.
The oversold market condition in a combination with key structure gives us a relatively strong bullish signal with goal 79.365 level.
P.S
We determine oversold/overbought condition with RSI indicator.
When it drops below 30 - the market is considered to be oversold.
When it bounces above 70 - the market is considered to be overbought.
Disclosure: I am part of Trade Nation's Influencer program and receive a monthly fee for using their TradingView charts in my analysis.
Like and subscribe and comment my ideas if you enjoy them!

EURNZD Will Go Higher From Support! Buy!
Take a look at our analysis for EURNZD.
Time Frame: 1h
Current Trend: Bullish
Sentiment: Oversold (based on 7-period RSI)
Forecast: Bullish
The market is on a crucial zone of demand 1.922.
The oversold market condition in a combination with key structure gives us a relatively strong bullish signal with goal 1.930 level.
P.S
We determine oversold/overbought condition with RSI indicator.
When it drops below 30 - the market is considered to be oversold.
When it bounces above 70 - the market is considered to be overbought.
Disclosure: I am part of Trade Nation's Influencer program and receive a monthly fee for using their TradingView charts in my analysis.
Like and subscribe and comment my ideas if you enjoy them!

EURJPY Is Going Up! Long!
Please, check our technical outlook for EURJPY.
Time Frame: 4h
Current Trend: Bullish
Sentiment: Oversold (based on 7-period RSI)
Forecast: Bullish
The price is testing a key support 166.677.
Current market trend & oversold RSI makes me think that buyers will push the price. I will anticipate a bullish movement at least to 167.654 level.
P.S
The term oversold refers to a condition where an asset has traded lower in price and has the potential for a price bounce.
Overbought refers to market scenarios where the instrument is traded considerably higher than its fair value. Overvaluation is caused by market sentiments when there is positive news.
Disclosure: I am part of Trade Nation's Influencer program and receive a monthly fee for using their TradingView charts in my analysis.
Like and subscribe and comment my ideas if you enjoy them!

EURUSD Long As the war escalated over the weekend market gapped during Asia session invalidating our initial forecast. (Linked Idea). Looking for the long on EURUSD.

BITCOIN SENDS CLEAR BULLISH SIGNALS|LONG
BITCOIN SIGNAL
Trade Direction: long
Entry Level: 104,672.03
Target Level: 107,484.65
Stop Loss: 102,785.72
RISK PROFILE
Risk level: medium
Suggested risk: 1%
Timeframe: 3h
Disclosure: I am part of Trade Nation's Influencer program and receive a monthly fee for using their TradingView charts in my analysis.
✅LIKE AND COMMENT MY IDEAS✅

Gold in a Tug of War – Consolidation or Comeback?After a quiet trading week, XAUUSD is hovering around 3,368 USD, trapped between hawkish central bank policies and prolonged geopolitical tension in the Middle East.
Despite safe-haven demand sparked by the Israel–Iran conflict, Fed, BOE, and SNB holding interest rates high conti
From a technical perspective, gold is struggling to break through the 3,385 USD confluence resistance zone. A rejection at this level could trigger a short-term pullback toward 3,330 USD or lower.
In my view, this is a healthy consolidation phase—not a reversal. Don’t underestimate the bulls. The long-term uptrenpullbacks may offer strate.
What about you—do you believe gold is gearing up for another rally? Drop your take below.

Gold Slumps Sharply – Has the Rate-Cut Hope Faded?Gold prices are under intense selling pressure after the Bank of England, the Swiss National Bank, and the Federal Reserve all decided to keep interest rates elevated. This unified stance underscores persistent inflation concerns, driving up the opportunity cost of holding non-yielding assets like gold. As a result, investors rushed to take profits, sending XAUUSD down over 200 pips in just one session.
Adding fuel to the fire, the Fed’s latest monetary policy report to Congress warned that inflation could rise to 3% by year-end, higher than previous projections. Moreover, the Fed trimmed expectations for rate cuts in 2025 and beyond, signaling a longer road to policy easing.
🔎 What does this mean for gold's short-term outlook?
With high rates here to stay and the Fed's cautious stance, gold remains vulnerable to further downside in the near term. However, if upcoming U.S. economic data shows signs of significant weakness, gold may regain favor as a safe-haven asset.
At the time of writing, XAUUSD is trading around $3,347, a critical zone that may determine whether the current drop continues or finds a bottom.
Do you believe this dip will deepen—or is it a golden opportunity to buy the pullback? Share your thoughts below!
New Week! New Opportunities on GOLD! With the recent activity in the middle east expecting prices to continue bullish. I was looking for this move last week but it seems the holiday delayed the process. If we can get a full breakout above the previous daily High level that will be confidence that we are moving bullish for the rest of the week.

Gold Under Pressure – Will the 3,385 Zone Hold?Hello everyone, let’s dive into gold price action together!
Following decisions from the Fed, BOE, and SNB to hold interest rates steady, gold continues to face downward pressure. High interest rates reflect a firm stance on inflation, pushing short-term capital away from non-yielding assets like gold.
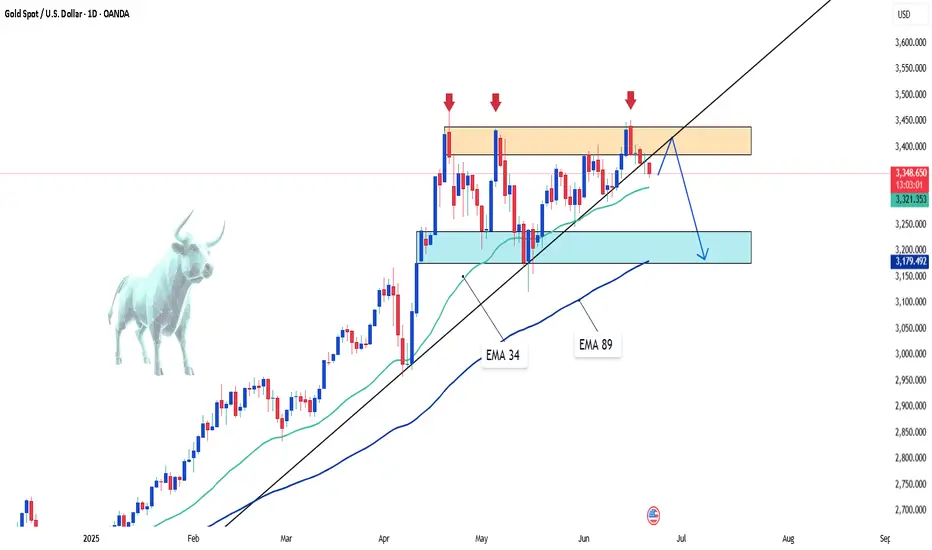
On the chart, gold closed the session near $3,368, showing little change from previous candles. The precious metal is still being rejected at a key confluence resistance zone (EMA 34, EMA 89, and a prior consolidation area). As long as price fails to break above $3,385, the downside scenario remains favored.
If this resistance holds, my next move would be to sell, targeting a drop to $3,300—a zone where buyers previously stepped in.
What about you? Do you see gold heading lower too?

"XAUUSD – Hidden Strength Within the Accumulation Zone"Hello everyone, how are you currently evaluating XAUUSD?
Yesterday, gold remained relatively stable without major volatility, yet continued to be supported by a favorable macro environment. Escalating tensions between Israel and Iran have sustained safe-haven demand. While the U.S. has yet to make a direct military move, President Trump’s emergency meeting and firm stance have increased market caution, which in turn boosted interest in gold.
At the time of writing, gold is trading around $3,368, and the long-term trend still favors the bulls. But why do I say that?
From both a technical and macro perspective, gold is in a healthy accumulation phase. Although it hasn’t broken above the record high, XAUUSD remains safely above key support zones — especially above the EMA 34 — which continues to affirm its bullish structure.
EMA 34 remains a strong dynamic support, with a clear separation from EMA 89, reinforcing the momentum. Even if we see short-term pullbacks in the next few sessions, they are more likely technical retests rather than signs of reversal.
Adding to that, the rising trendline, higher support levels, and bullish candlestick patterns all strengthen the case for continued upward movement. These combined factors paint a positive technical outlook for gold in the medium to long term.
From my perspective, I remain confident in gold’s long-term uptrend. What about you? Feel free to share your thoughts!

AUDUSD Potential Long - Dependent on PA Market openAUD/USD Long Setup – 15M Chart Analysis
Looking at a potential long on AUD/USD after price tapped into demand and swept liquidity. The area aligns with a fair value gap and previous order block, suggesting interest from larger players.
Two Entry Options:
1. Aggressive: Buy limit at the order block (riskier, no confirmation).
2. Conservative: Wait for break of structure, then retest into FVG with bullish price action for confirmation.
Targets:
Target 1: 0.6470
Target 2: 0.6480
Target 3: 0.6490
Extended Target: 0.6530 (only if 0.6490 is breached and price holds above)
Important Notes:
This setup is forecast-based and depends on how price opens and reacts.
Entry should follow a clear confirmation, especially after a liquidity sweep.
Ideal confirmation: Break of structure followed by a retest with bullish PA on lower timeframes (M5/M1).
Invalidation: A clean break and close below 0.6430 would invalidate this idea.
Stay disciplined. Trade the plan, not the prediction.

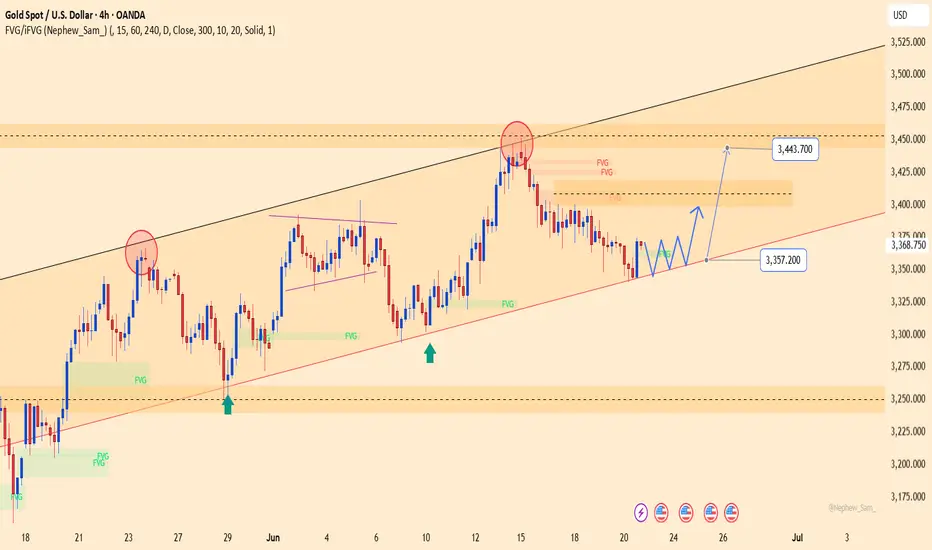
XAUUSD – Weak consolidation near 3,357, eyes on 3,443 retestYesterday, gold traded within the 3,344 to 3,371 USD range and closed at 3,368.75 USD (+0.72%). Despite the slight rebound, price action remains weakly consolidative within a broad ascending channel, repeatedly rejected at the 3,443 USD resistance area — where multiple FVGs (Fair Value Gaps) remain unfilled.
On the H4 chart, price is holding above the key confluence support at 3,357 USD, which aligns with the medium-term ascending trendline. If this level holds, a technical bounce back toward 3,443 USD is likely.
However, it's worth noting that recent upward moves have lost momentum near the upper FVG zones. Traders should wait for a clear confirmation signal — particularly a strong bullish candle at the current support — before considering entry.
EURUSD to Retest 1.16 regionWatching the 1.1490–1.1450 zone for a potential bullish reaction. This area includes a 4H Fair Value Gap and Order Block. If price gives a 15M CoCH within this range, I’ll look to enter long.
Targets: 1.1540, 1.1570, and 1.1610
Invalidation below 1.1440
Patience until price delivers a clear setup.

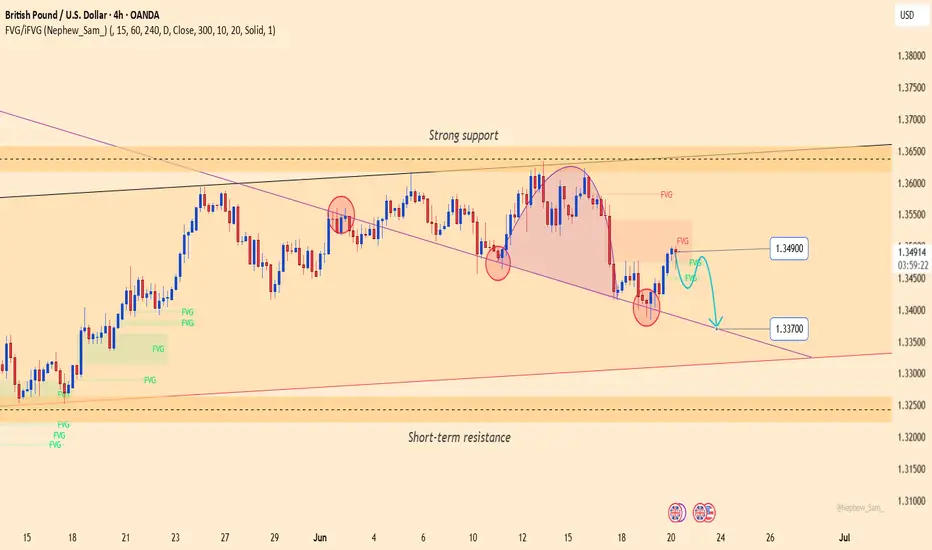
GBPUSD: Bearish pressure persistsGBPUSD is consolidating below a key medium-term resistance zone, with a rounding top and a minor head-and-shoulders pattern forming. The price is currently retesting the Fair Value Gap near 1.34900 — a potential reversal zone if it fails to break higher.
On the fundamental side, the Bank of England's decision to hold interest rates on June 19 disappointed the market. Meanwhile, the US dollar remains supported by safe-haven demand and the Federal Reserve’s hawkish tone, adding further pressure on GBP.
If GBPUSD fails to hold the trendline support near 1.33700, the risk of a deeper decline increases. Both the technical structure and macro fundamentals favor the bears.
$IREN could be next...100%+ UpsideNext Retail Darling... NASDAQ:IREN TA looks the part! 👀
Breakout 🎯$22 then $31
CupnHandle almost breaking out here with measured moves a lot higher!
Volume shelf acting as a launch pad.
WR% is uptrnding as well!
This one's looking good based on the TA.

SILVER Is Very Bullish! Long!
Take a look at our analysis for SILVER.
Time Frame: 4h
Current Trend: Bullish
Sentiment: Oversold (based on 7-period RSI)
Forecast: Bullish
The market is testing a major horizontal structure 3,603.0.
Taking into consideration the structure & trend analysis, I believe that the market will reach 3,697.2 level soon.
P.S
Overbought describes a period of time where there has been a significant and consistent upward move in price over a period of time without much pullback.
Disclosure: I am part of Trade Nation's Influencer program and receive a monthly fee for using their TradingView charts in my analysis.
Like and subscribe and comment my ideas if you enjoy them!

Gold in the Spotlight – Safe Haven or Short-Term Speculation?Hello everyone, great to see you again in our latest discussion about XAUUSD.
This week, gold has seen wild swings—soaring to new highs amid geopolitical tensions, then sharply pulling back. This highlights gold’s dual nature: both a safe-haven asset in times of crisis and a highly reactive instrument during speculative surges.
The Fed’s decision to hold interest rates at 4.50% and maintain a cautious stance on monetary policy continues to weigh on the precious metal. Still, growing expectations of rate cuts later this year remain a key bullish factor for gold, which doesn’t generate yield.
Meanwhile, persistent conflicts in the Middle East and the ongoing Russia–Ukraine war are fueling defensive investment demand. Central banks around the world are also steadily accumulating gold, reinforcing its role as a hedge against global economic and political uncertainty.
As for me, I remain optimistic about long-term upside potential. What are your expectations for gold?

Gold Longlooking to the upside on Gold from Asia lows. This is a prelim entry (forecast) need to seek bullish PA around the FVG if we get a pull back. If a pull back does not form we will wait for a break and RT above 3,352 and plan entries accordingly.

USDJPY – Bearish Pressure Builds Amid Fed Dovish ExpectationsFX:USDJPY is trading around the 145.300 mark and showing signs of weakness, as the US dollar comes under pressure from growing expectations that the Federal Reserve may begin cutting interest rates in September. This sentiment is fueled by recent soft US data, including weaker retail sales and industrial production.
Meanwhile, the Japanese yen is regaining some strength, supported by safe-haven demand amid geopolitical tensions in the Middle East and possible intervention signals from the Bank of Japan.
In the short term, I lean toward a corrective pullback scenario while awaiting clearer signals from the Fed.

