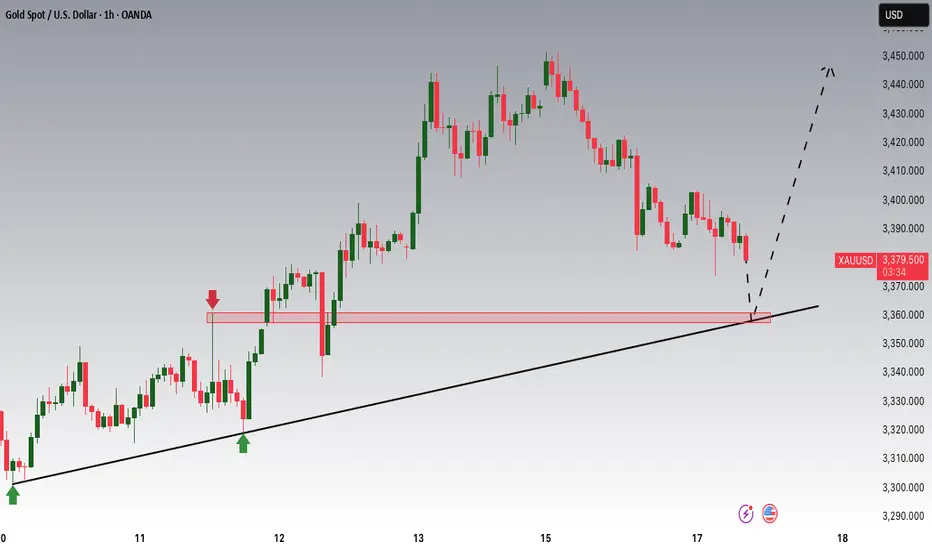
Gold is Nearing an Important Support!!Hey Traders, in today's trading session we are monitoring XAUUSD for a buying opportunity around 3,360 zone, Gold is trading in an uptrend and currently is in a correction phase in which it is approaching the trend at 3,360 support and resistance area.
Trade safe, Joe.
Buy
EURUSD – Healthy pullback within a strong uptrendEURUSD is undergoing a temporary correction after a strong bullish move, but the pair remains above key technical support levels such as the EMA34 and the ascending trendline. The 1.15070 zone now acts as a potential buy area—where demand may return if confirmation signals appear.
Market sentiment is leaning toward the expectation that the Fed may cut interest rates soon due to weaker-than-expected U.S. retail sales data, which has weighed on the USD and indirectly supported the euro. Meanwhile, the ECB continues to maintain a stable policy stance, further reinforcing the current bullish trend.
If the price holds above the green support zone, the next target could be around 1.15940. If this support breaks, traders should watch price behavior at the trendline before making the next trading decision.

EUR/USD Slips — Setup or Selloff?EUR/USD kicked off the week under pressure, hovering near 1.1540 during the Asian session. The drop comes as the U.S. dollar regains strength, driven by safe-haven demand amid rising geopolitical tensions in the Middle East.
In times like these, the greenback shines — and riskier currencies like the euro naturally take a hit. If the situation escalates further, the pair could extend its decline in the near term.
But let’s flip the perspective: while some see risk, others see opportunity. This dip might just be the pullback that buyers have been waiting for — especially if the fundamentals shift or tensions ease. Timing, as always, is everything.

Gold is giving up a Set up! Been waiting for this set up. But trying to remain disciplined on this one. I Need to see a sweep of lows at this point in order to be interested in the buy. Once we see that its on. Until then we sit on hands and wait.

AUDJPY Potential UpsidesHey Traders, in today's trading session we are monitoring AUDJPY for a buying opportunity around 93.600 zone, AUDJPY is trading in an uptrend and currently is in a correction phase in which it is approaching the trend at 93.600 support and resistance area.
Trade safe, Joe.

Try a R/R1 BuyThis signal is based on a 60% win rate backtested strategy...
1st order:
Buy @ 3418.3
SL: 3410
TP: 3426
2nd order:
Buy Limit @ 3414
SL: 3410
TP: 3426
Manage your Risk...

Buy for R/R1Buy or Buy Limit @ 42615
SL: 42377
TP1: 42850
Signal from a backtested strategy with a win rate of 60 %.
Manage your risk...

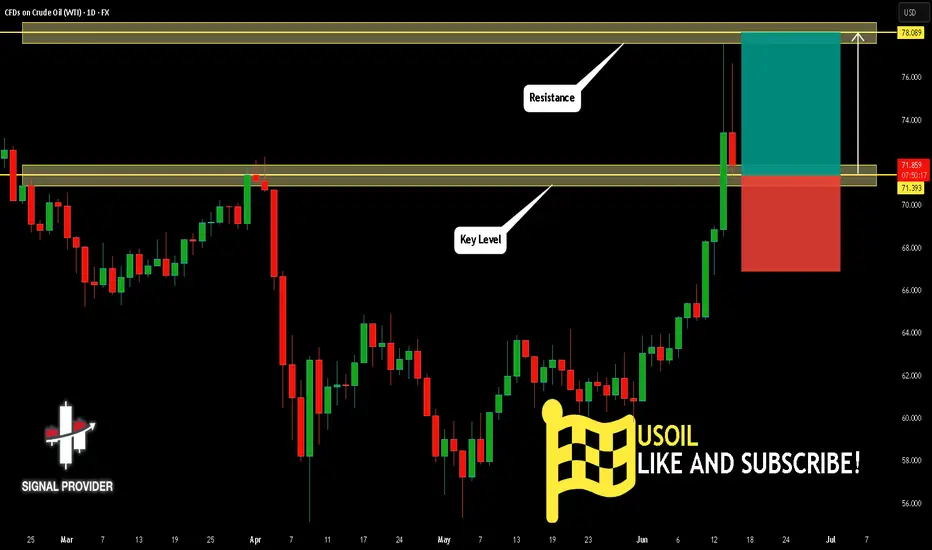
USOIL Will Move Higher! Buy!
Please, check our technical outlook for USOIL.
Time Frame: 1D
Current Trend: Bullish
Sentiment: Oversold (based on 7-period RSI)
Forecast: Bullish
The price is testing a key support 71.393.
Current market trend & oversold RSI makes me think that buyers will push the price. I will anticipate a bullish movement at least to 78.089 level.
P.S
Overbought describes a period of time where there has been a significant and consistent upward move in price over a period of time without much pullback.
Disclosure: I am part of Trade Nation's Influencer program and receive a monthly fee for using their TradingView charts in my analysis.
Like and subscribe and comment my ideas if you enjoy them!
EURUSD Is Bullish! Long!
Here is our detailed technical review for EURUSD.
Time Frame: 3h
Current Trend: Bullish
Sentiment: Oversold (based on 7-period RSI)
Forecast: Bullish
The market is trading around a solid horizontal structure 1.157.
The above observations make me that the market will inevitably achieve 1.165 level.
P.S
Please, note that an oversold/overbought condition can last for a long time, and therefore being oversold/overbought doesn't mean a price rally will come soon, or at all.
Disclosure: I am part of Trade Nation's Influencer program and receive a monthly fee for using their TradingView charts in my analysis.
Like and subscribe and comment my ideas if you enjoy them!

GOLD Is Very Bullish! Buy!
Please, check our technical outlook for GOLD.
Time Frame: 9h
Current Trend: Bullish
Sentiment: Oversold (based on 7-period RSI)
Forecast: Bullish
The market is approaching a key horizontal level 3,327.72.
Considering the today's price action, probabilities will be high to see a movement to 3,385.41.
P.S
Please, note that an oversold/overbought condition can last for a long time, and therefore being oversold/overbought doesn't mean a price rally will come soon, or at all.
Disclosure: I am part of Trade Nation's Influencer program and receive a monthly fee for using their TradingView charts in my analysis.
Like and subscribe and comment my ideas if you enjoy them!

EURJPY Will Go Higher From Support! Buy!
Please, check our technical outlook for EURJPY.
Time Frame: 6h
Current Trend: Bullish
Sentiment: Oversold (based on 7-period RSI)
Forecast: Bullish
The price is testing a key support 164.890.
Current market trend & oversold RSI makes me think that buyers will push the price. I will anticipate a bullish movement at least to 166.192 level.
P.S
Overbought describes a period of time where there has been a significant and consistent upward move in price over a period of time without much pullback.
Disclosure: I am part of Trade Nation's Influencer program and receive a monthly fee for using their TradingView charts in my analysis.
Like and subscribe and comment my ideas if you enjoy them!

GBPUSD Will Move Higher! Buy!
Take a look at our analysis for GBPUSD.
Time Frame: 1h
Current Trend: Bullish
Sentiment: Oversold (based on 7-period RSI)
Forecast: Bullish
The price is testing a key support 1.349.
Current market trend & oversold RSI makes me think that buyers will push the price. I will anticipate a bullish movement at least to 1.352 level.
P.S
The term oversold refers to a condition where an asset has traded lower in price and has the potential for a price bounce.
Overbought refers to market scenarios where the instrument is traded considerably higher than its fair value. Overvaluation is caused by market sentiments when there is positive news.
Disclosure: I am part of Trade Nation's Influencer program and receive a monthly fee for using their TradingView charts in my analysis.
Like and subscribe and comment my ideas if you enjoy them!

USOIL Will Go Higher From Support! Buy!
Take a look at our analysis for USOIL.
Time Frame: 2h
Current Trend: Bullish
Sentiment: Oversold (based on 7-period RSI)
Forecast: Bullish
The market is testing a major horizontal structure 67.337.
Taking into consideration the structure & trend analysis, I believe that the market will reach 69.433 level soon.
P.S
The term oversold refers to a condition where an asset has traded lower in price and has the potential for a price bounce.
Overbought refers to market scenarios where the instrument is traded considerably higher than its fair value. Overvaluation is caused by market sentiments when there is positive news.
Disclosure: I am part of Trade Nation's Influencer program and receive a monthly fee for using their TradingView charts in my analysis.
Like and subscribe and comment my ideas if you enjoy them!

GBP/USD LONG FROM SUPPORT
Hello, Friends!
GBP/USD pair is trading in a local uptrend which know by looking at the previous 1W candle which is green. On the 4H timeframe the pair is going down. The pair is oversold because the price is close to the lower band of the BB indicator. So we are looking to buy the pair with the lower BB line acting as support. The next target is 1.358 area.
Disclosure: I am part of Trade Nation's Influencer program and receive a monthly fee for using their TradingView charts in my analysis.
✅LIKE AND COMMENT MY IDEAS✅

AUD/USD BULLISH BIAS RIGHT NOW| LONG
Hello, Friends!
AUD/USD pair is in the downtrend because previous week’s candle is red, while the price is clearly falling on the 15m timeframe. And after the retest of the support line below I believe we will see a move up towards the target above at 0.651 because the pair oversold due to its proximity to the lower BB band and a bullish correction is likely.
Disclosure: I am part of Trade Nation's Influencer program and receive a monthly fee for using their TradingView charts in my analysis.
✅LIKE AND COMMENT MY IDEAS✅

Toward $3,500? Gold Faces Key Policy DecisionsGold is currently trading around $3,438 and continues to show positive momentum. After a week focused on inflation data, the gold market is now shifting its attention to interest rate decisions and policy guidance from major central banks.
The week begins with the Empire State Manufacturing Index, a key indicator of economic activity in the New York region. Following that, the Bank of Japan (BoJ) will announce its monetary policy decision, and investors are closely watching to see whether the BoJ will continue normalizing its interest rates.
Next comes U.S. retail sales data for May — a crucial gauge of consumer spending, which remains the backbone of the U.S. economy. Any signs of weakness in consumer activity could increase expectations for Federal Reserve rate cuts.
However, the main focus remains the upcoming Fed meeting. While markets widely expect rates to be held steady, investors are awaiting clear signals from Chair Jerome Powell regarding the path and timing of potential rate cuts ahead.
According to Kitco’s weekly gold survey, professional analysts remain optimistic about gold’s outlook, while retail investors are showing more caution.
With central bank decisions approaching and geopolitical tensions lingering, investors need to stay alert. Risks such as rising social unrest in the U.S., escalating conflicts in the Middle East, and ongoing de-dollarization trends are all fueling demand for gold as a safe-haven asset.
Given expectations that the Fed will hold rates steady, gold maintains its defensive appeal. In my view, the precious metal may soon retest its highs near $3,500, as its role as a global safe haven becomes even more pronounced amid mounting uncertainty.

USD/JPY(20250616)Today's AnalysisMarket news:
Trump: The United States may still intervene in the Iran-Israel conflict. If Iran launches an attack on the United States, the United States will "fight back with all its strength on an unprecedented scale." Iran and Israel should reach an agreement.
Technical analysis:
Today's buying and selling boundaries:
143.79
Support and resistance levels:
145.47
144.84
144.43
143.15
142.74
142.12
Trading strategy:
If the price breaks through 144.43, consider buying in, the first target price is 144.84
If the price breaks through 143.79, consider selling in, the first target price is 143.15

Gold on the Rise – Will It Break New Highs?Hey traders! What’s your view on XAUUSD?
Yesterday, gold surged over 400 pips and the rally hasn't slowed down. Price is now hovering around $3,428, right below a key resistance above the all-time high.
Why the spike? US CPI came in lower than expected, boosting hopes for a Fed rate cut. The dollar weakened, tensions in the Middle East grew, and central banks are buying gold aggressively.
Personally, I expect a breakout. What about you – will gold pull back or continue its climb?
Drop your thoughts in the comments!

Gold Takes the Throne as Safe Haven AgainThe recent escalation in the Middle East — particularly Israel’s surprise strike on Iran — has stirred up significant volatility in global financial markets. Oil prices surged, stock markets around the world turned red, just as many had predicted. However, in a surprising twist, capital did not rush into the usual safe havens like the US dollar or Treasury bonds. Instead, it flowed decisively into gold.
In fact, US Treasury yields have soared from 3.98% in April to around 4.42% now. This surge doesn’t signal growing confidence — it reflects investor demand for higher returns to compensate for the rising risk of holding dollar-denominated assets.
Against this backdrop, gold is emerging as an “unshackled safe haven” — immune to political instability tied to fiat-currency-issuing nations. The precious metal is once again proving its value in times of global uncertainty.

GOLD OPENS BULLISHJust as analysed, there was a strong bullish setup at the close of last week so this move was just taking out top liquidity, continuing its course of bullish rally. We can also spot a bullish trend build up from the 3400's which projected to the 3450's before making its retracement last week.
we expect Gold to go for more higher liquidity as we are close to the ATH, in other words; ROAD TO 3500'S as a visible path has been analysed

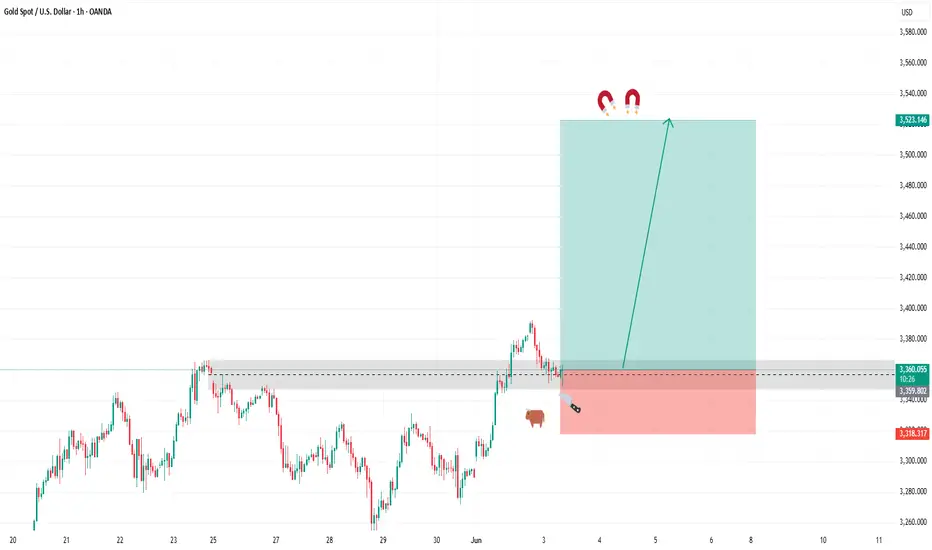
GOLD NEW HIGHGOLD is ready to make a RUN for the money. We are monitoring GOLD for bullish scenario. Our buys are locked in at 3299.110 our stops are below 3241.00 and targets above previous ATH at 3523.750. Use proper risk management. Bets of luck.

BULLISH GOLDIn todays session we are adding more buys to our initial bias on bullish gold heading for new highs. Our entry is at 3360.84 tp new highs of 3523.15 and stop for this one is 3318. Adjust your positions according to your risk management. Use proper money management. Best of luck
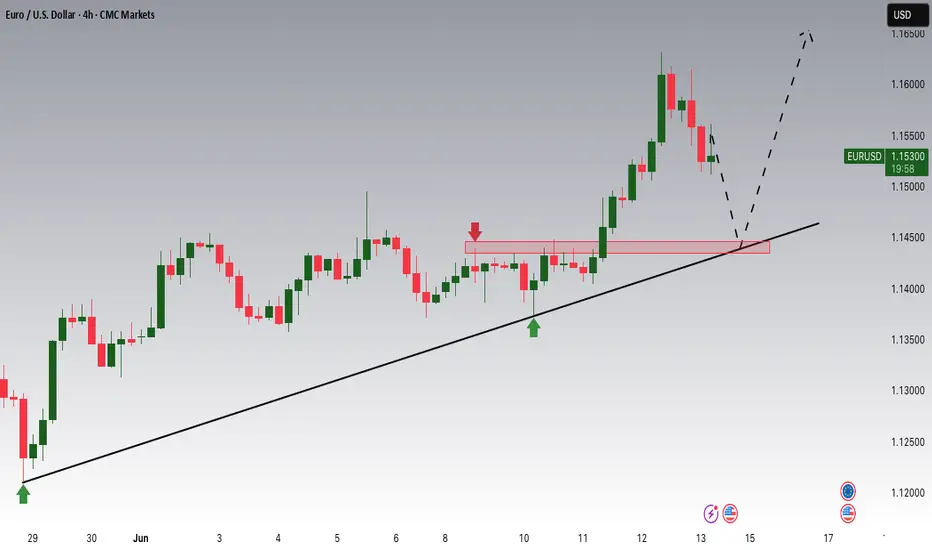
EURUSD Potential UpsidesHey Traders, in today's trading session we are monitoring EURUSD for a buying opportunity around 1.14500 zone, EURUSD is trading in an uptrend and currently is in a correction phase in which it is approaching the trend at 1.14500 support and resistance area.
Trade safe, Joe.