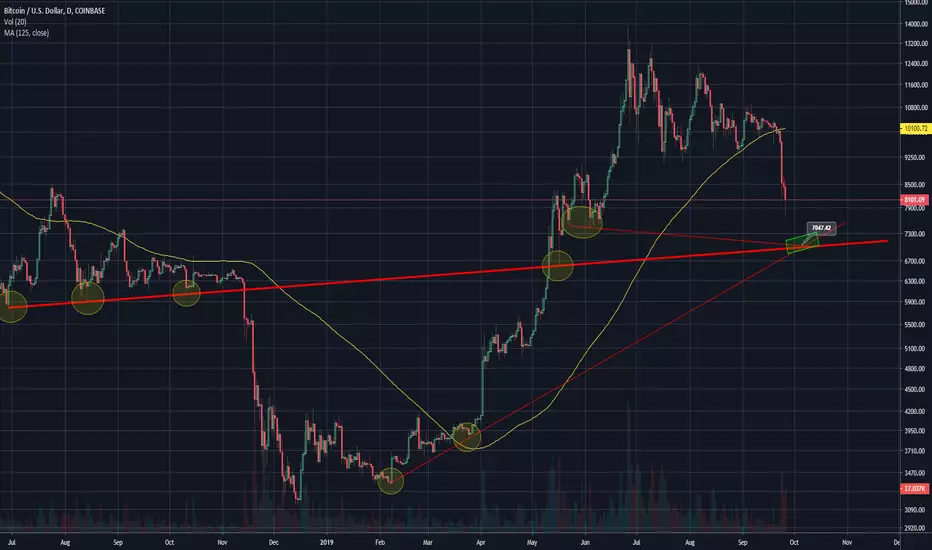
IF I WERE A BITCOIN ON TODAYLet me start by saying I'm definitely no permabull for any pair, commodity, etc. I'm loving the current positioning of the BTCUSD joint though. Here's much of what I'm looking to play out. Bold yellow lines are heavy support (imo), the thin yellow line appears to be a possible bottom-trend-line (tbd). You get the idea though.
*trade at your own risk.
Buybitcoin


BUY BITCOIN NOW DON'T MISS OUTBUY BITCOIN AT THE CURRENT MARKET PRICE... $9500 IS THE MEASURED TARGET FOR WAVE 3


buy bitcointhis is as per the completion of a possible retracement in anticipation to the next bull run ,with a possible payout of 1:54 ,remember stick to money management.

long bitcoinpossible long on bitcoin,could be this the next big move on bitcoin ? lets see remember money management is essential

BTCUSD This is the time to buy Bitcoin !Buying Bitcoin for one possible profit targets after the break of trend line and retest !


BTCUSD BUY 09.10.2019BUY signal at 8221$.
If you want to see more history of this strategy, I will able to show you if you request me.
__________________________________________________________________________
You can use the signals independently or like indicator of trends together with other indicators in your trading strategy.
Know that the success of your strategy that based on those signals depends from your money management and the additional conditions that you make in these strategies.
You use these signals inside your strategies at your own risk.
The chart shows the last trades on the product + the last signal.
I have several strategies for different products, and I want to show you proof of it works on history, and you will be able to see it, when returns to that profile.
Therefore, subscribe and watch for that profile.
The signals rare but useful.

Bitcoin, if I'm waiting for an even much lower price, where?If I'm waiting for a much lower price to buy bitcoin, where will it be?
Well, you might just be in luck. A bullish bat pattern might just form up. Tonights NFP might be helping you to achieve that or against it.
1 of my friend has bought 20% of his intended purchase of bitcoin last night and maybe 30% to 50% more when it reaches 7900USD.
I must say I'm no expert in this product but is certainly a price 7900 for a next major reaction.

Analisis en Bitcoin CCAMovimiento alcista rápido (IMPULSO 0-100) seguido de movimiento correctivo hasta el nivel 38.2, concuerda con un movimiento rápido y una corrección de consolidación. De no dar una salida y seguir corrigiendo evaluaremos el Pullback a la zona del 61.8
CCA

Where Am I Buying BTC?COINBASE:BTCUSD Buy zone for my personal BTC buy shown on chart. Main point of focus is the nearly horizontal trend line shown in thicker red. In a perfect world price action would go ahead and dump on off the meet the convergence of trend lines over the next 7-10 days, or even take a slower, more measured downward slope in that time period. I won't be making any BTC purchases above this level however. If price does not make it down to the level shown, I will begin purchasing again on the convincing break and close back above the 125 daily moving average, for reasons given in previous posts. Just putting it out there for anyone interested in knowing. Happy hunting and GLTA!!
LEVELS TO BUY BITCOINUsing historical data and seizing the opportunity for a good level to buy bitcoin after a dramatizing drop in value. These are the price ranges that I see Bitcoin continuing to before hitching to the upside.


BITCOIN BUY AND HOLD!!!! THOUSANDS TO BE MADEBitcoin breakout soon, following my pre predicted channel. Up and down till we break out then a buy stop to maximise profits!
Some people didn't want to listen lol

BTCUSD Buying Bitcoin for 2 possible profit targets ! Buying Bitcoin for 2 possible profit targets after the break of trend line and resistance !

BTCUSD Time to buy again !After breaking resistance,looking for the possible 2 profit targets.If the resistance turned support breaks then it invalidates the idea !


Chart Speaks for Itself?Short term, seems short- Ranging between Fib lines (thick colored) and trending down on the daily, however still holding above he 50 day MA - 4 hour crossed below 125&200MA but right on the 50 MA for both 4 hour & 1D. We are right on the money with the downward trend since the end of June (28/29).
Mid term -On the daily it looks like the appetite is toward the 8K range (ranging 7,600 to 9,400) which is sing low of beginning of June or somewhere between 7,200 & 8,400 which would be the first time we crossed over long term trend line. That same red thick line trending up (monthly support) for be the renewed support at 9,100.
Long term - Needless to say, since my first post testing how to use this thing, I see that we crossed the 200W MA and that is long term bullish - period.
But more confirmation says on the weekly, all MAs are trending up and we have plenty of room since they are all the way down at the 6,500 level.
Thanks - buy bitcoin, but don't rely on it.


BTC PULLBACK TARGETSHi guys!
If you read my previous analysis, you know that I preticted that we gonna have a fakeout to 9K than immediately pull back.
I do not think it is gonna be a very short-living pullback, I think the 8K will not act as a support. It would be a way too small pullback compared to our parabolic run. The 21 EMA (blue line) should also not hold.
What I will be looking at is the 50 MA (purple line) and the 100 MA (green line). If we look at the price of bitcoin in the last parabolic run in 2017 you can see that when we had a move up we pulled back to the 50 or the 100 MA. We can also see that at the start of the parabolic run we pulled back to the 100 MA and than as we got higher and higher the 50 MA was the one that acted as a support.
Since we are only at the start of a bull run, I would say that it is more probable that we will see a pullback to the 100 MA. At the time we get there it will be around the 6.4K region what I also mentioned in my previous analysis.
***It is not a financial advice! It is only my opinion and you should always do your own research!***
If you liked the analysis please leave a like, and if you have any questions feel free to leave a comment.

IS BTCUSD (BITCOIN) SET TO RALLY 40% HIGHER?Hi Traders,
The 4-hour chart of BTCUSD shows that the reversal from 78.6 Fib ratio and a sharp surge from $3412 to $4274 which broke out the descending trendline can actually be seen as a textbook five-wave impulse in wave (i).
.
According to the Elliott Wave theory, a three-wave correction in the opposite direction follows every impulse pattern. And indeed, the rest of the chart reveals an a-b-c zigzag correction in wave (ii) that terminated at a confluence level (50 - 61.8 Fib ratio + swing level + moving averages).
.
If this count is correct, there is a complete 5-3 cycle to the north. Fortunately for BTC holders, this means another rally to around $6000 can be expected in wave 3 from now on.
.
What's your thought about Bitcoin? Kindly let me know in the comment.
.
Thanks for reading!
Veejahbee.

BTC Bullish & Bearish Scenario (Short Term)BTC seems to be forming a symmetrical triangle. Being that the overall monthly trend is still bearish, the odd favor BTC breaking to the downside. However, with the RSI showing bullish divergence, there is a chance BTC will break to the upside and head towards the resistance range of $4,100-$4,200. If not, you can expect BTC to break downwards towards the $3,200 range. Good luck!
