TRON the next rally for an AltcoinTRON seems to be the next ALt Coin Crypto that is ready to rally with the Crypto Summer kicking in with Bitcoin and Ethereum.
So this one looks exciting for upside.
Here are SOME fundamentals for upside first.
🏛 1. Institutional Money Flows
Big players are backing TRON with institutional-scale adoption, fueling network demand and price strength
🔗 2. SkyLink Launch
The new SkyLink protocol lets users earn yield on tokenized Treasuries, boosting excitement around TRX utility
💱 3. USDT Powerhouse
TRON has minted over $22 billion USDT in H1 2025—cementing its role as a stablecoin hub
Here are the technicals.
Cup and Handle
Price> 20 and 200MA
Target 3,861
Disclosure: I am part of Trade Nation's Influencer program and receive a monthly fee for using their TradingView charts in my analysis.
Buycrypto

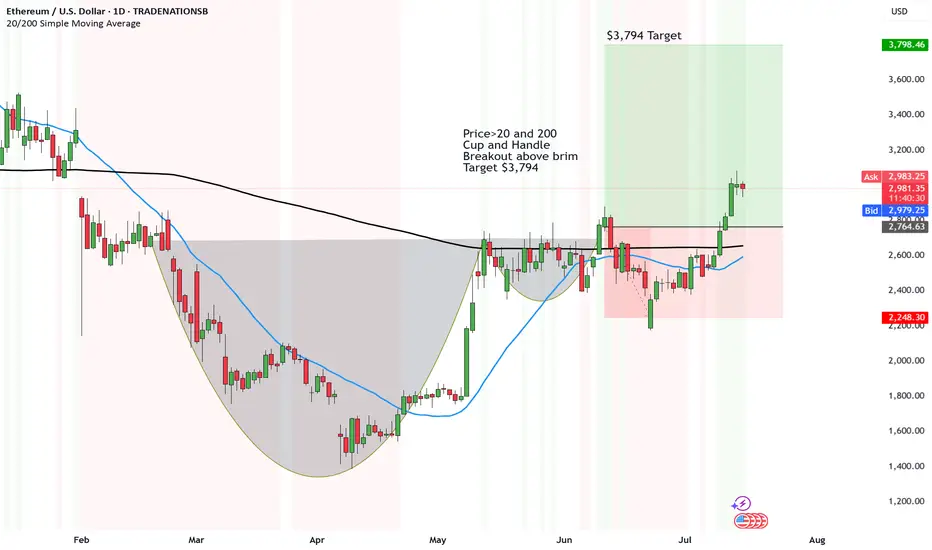
Ethereum - It's about damn time!Ethereum has been slacking for a couple of years.
The strong catalyst to excel Ethereum just seems to be lingering compared to the first 5 years.
So, it looks like it's just following suit with Bitcoin current rally, as it hits all time highs and shines confidence to the rest.
So the update with Ethereum remains to be the same.
Price>20 and 200
Cup and Handle
Breakout above brim
Target $3,794
Disclosure: I am part of Trade Nation's Influencer program and receive a monthly fee for using their TradingView charts in my analysis.
Bitcoin setting up for strong upside in 2025 thanks to TrumpSince the target of Bitcoin hit at $100,000, we are seeing bullish signs for BTC.
First we have a strong W Formation form and break above the neckline.
Second, the moving averages are aligned nicely with gPrice>20 and 200
Trump presidency is bullish who is supporting crypto with the Trump coin taking off (with volatility though)
If Trump coin drops 50%, it will send crypto traders back to Bitcoin who'll see more stability with the coin.
First target in 2025 is $151,691

Cardano Flag Pattern
📊 Overview:
Cardano is setting the stage for a massive rally with a textbook bullish flag pattern on the daily chart. After a stunning 280% surge forming the flagpole, ADA is now consolidating in a controlled channel, signaling a likely continuation to much higher levels. This is a golden opportunity for bullish traders.
📈 Why Cardano is Poised to Explode:
1️⃣ Breakout Imminent: The price is flirting with the $1.10 resistance zone, and a breakout could ignite a rally straight toward $2.10 and beyond—nearly doubling from current levels.
2️⃣ Massive Potential: The measured move of the flag projects a target of $2.10, but with strong market sentiment, ADA could overshoot and challenge new multi-year highs.
3️⃣ Bullish Momentum: Cardano's network developments and growing ecosystem adoption are adding fuel to the fire, drawing both retail and institutional interest.
🎯 Key Levels and Targets:
Immediate Resistance: $1.10 (the breakout level).
Target 1: $1.60 (intermediate milestone).
Target 2: $2.10+ (flag projection, with potential for overshooting).
Support: $0.95
💡 Bullish Outlook:
Cardano is not just showing potential; it's screaming for a breakout. The setup is primed, and the volume on a breakout could send it soaring. With momentum and market sentiment in sync, ADA could be the top performer in the coming weeks.

Cardo about to ROCKET to 1.5530 after the Symmetrical TriangleSymmetrical Triangle has formed on Cardo and it looks like we are approaching the Apex of the triangle where there is upside to come.
Crypto is definitely taking a break from all the upside, but seems to be preparing for a big boost.
Whether it be Trump administration to incorporate Crypto more into the legal system or the Smart Money piling in while the less patient closes out.
Here are the indicators.
Price> 20 and 200
Flag pole UP.
Target 1.5530

Bitcoin insane $105,000 target still on track but first a WedgeWhen you use longer time frames, more patience is required for the play.
We've seen since Early 2022, the price started forming a Rounding Bottom.
It completed on 7 March 2024. Then was the consolidation period where traders are freaking out and calling it the next Crypto winter.
But in the bigger scheme of things it's just where demand and supply is settling for the next big move.
Follow on and we have a large falling wedge in play for Bitcoin. And once it breaks out, the target of $105,000 is easily on the cards.
Trading CFDs is not suitable as the daily interest charges on this kind of trade, will eat away at the portfolio.
So, I would only raw dog and buy more Bitcoin once the break out above the Wedge.
Will update as goes.

ETHUSD / Long Trade Active ✅💡Hello Traders!
This is my idea for ETHUSD. I expect a bullish breakout as the price liquidates the old lows.
My expectation is to see the price to close the FVG and also to set a new PWH as we are in a bullish trend.
Please LIKE 👍, FOLLOW ✅, SHARE 🙌, and COMMENT ✍ if you enjoy this idea! Also, share your ideas and charts in the comments section below! This is the best way to keep it relevant, support us, keep the content here free, and allow the idea to reach as many people as possible.
____________________________________
www.tradingview.com

SOLUSDT is Bullish now| BUY opportunity !Hello Traders, here is the full analysis.
SOL can very easily see some strong growth from this point. GOOD LUCK! Great BUY opportunity SOLUSDT. I still did my best and this is the most likely count for me at the moment.
Support the idea with like and follow my profile TO SEE MORE.
Traders, if you liked this idea or if you have your own opinion about it, write in the comments. I will be glad 🤝
Patience is the If You Have Any Question, Feel Free To Ask 🤗
Just follow chart with idea and analysis and when you are ready come in THE GROVE | VIP GROUP, earn more and safe, wait for the signal at the right moment and make money with us💰

ENTRY LOW RISK IN BEST SUPPORTHIGH/USDT.P
BUY-LONG
✓ ENTRY : - 1.130 - 1.180
💵 Target 1: 1.219
💵 Target 2: 1.253
💵 Target 3: 1.279
💵 Target 4: 1.322
💵 Target 5: 1.354
🪄 Stop | Loss : 1.104

lambo skates for bitcointhis this aint going nowhere. weve tried the idea of crypto going to 0. this is money that will be used forever. i have no problem $ cost averaging in, and making a passive investment, especially where gbtc is available. lowest im looking at is 16,200, highs im looking at are around 18,600. i like this as an asset any time broader bear market extremes are present.

LTCUSD- Round Bottom ReversalLTCUSD os the past day demonstrates the Round Bottom Reversal quite well..
The RSI / Ichimoku shows the RSI candles progressively trending upward and
piercing through the cloud.
Selling volume has spikes heading down into the reversal and then once
reversing relative volume has spikes as much as 5X.
Given the sideways of the general cryptocurrency market, right now
LTCUSD is a stable coin STRONG BUY,

Ethereum/USDT
This i s our analyze ETH/USDT make sure you check what happen because RSI is goin to diversion

WOOUSD = previous idea work
P.S. Always do your own analysis before a trade. Put a stop loss. Fix profit in parts. Withdraw profits in fiat and reward yourself and your loved ones

⭕️BUY crypto FANTOM ; Now is the best time to Buy ❗️🧐🔰You see the analysis of the crypto FANTOM in four hours ( FTMUSDT , 4H) ❗️🔎
🔰BUY FTMUSDT at 1.0300
✅TP ; 2.0600 (+10300 pips)
❌SL ; 0.9180 (-1120 pips)
📊R/R ; 0.1 (This number is derived from the division of Risk to Reward and must always be less than one, and the less it is, the better🧐)
🔰BUY FTMUSDT at 1.0300
✅TP ; 3.1000 (+20700 pips)
❌SL ; 0.9180 (-1120 pips)
📊R/R ; 0.05 (This number is derived from the division of Risk to Reward and must always be less than one, and the less it is, the better🧐) 🔥🔥
🔰Due to the price in the demand area and the fatigue that is evident in the price movement, if the price breaks the white downtrend line. Buying in this area seems low risk. The first target is located in the nearest supply area and the second target is located in the main supply area, which was previously the highest price for this crypto.💰👌
⚠️⚠️🔥Take a look at Phantom Analysis step by step on YouTube🔥⚠️⚠️
⚠️⚠️Please observe capital management and open a low volume transaction❗️❗️
I hope this analysis is useful for you🙏🏻🌹
📌Please introduce the "TRADER STREET" to your friends 🙏🏻
_______________________📈TRADER STREET📉________________________

⭕️BUY Crypto AVAXUSDT ; at the best place 🧐⭕️You see the analysis of the cryptocurrency used in the avalanche blockchain network (AVAX) in four hours(AVAX USDT , H4)🔎
🔰As the analysis shows, the best place to buy low risk is at the intersection of the uptrend line (white) and the support line (orange)❗️
The profit and loss limits are specified in the image👌
⚠️⚠️Please observe capital management and open a low volume transaction❗️❗️
I hope this analysis is useful for you🙏🏻🌹
📌Please introduce the "TRADER STREET" to your friends 🙏🏻
_______________________📈TRADER STREET📉________________________

⭕️BUY Crypto TOMOCHAIN ❗️⭕️You see the analysis of Crypto TOMOCHAIN in 4 hours v(TOMO/USDT , H4 )🔎
🔰Trend lines are marked with white color and Demand ranges with purple color. The price moves in a flag-like pattern❗️. In case of price collision to the bottom uptrend line, a suitable position for buying is formed. 🧐
There are two types of expected price movements that are marked with yellow and orange lines. The profit limit and the limit of loss are specified in the image.
⚠️⚠️Please observe capital management and open a low volume transaction❗️❗️
I hope this analysis is useful for you🙏🏻🌹
📌Please introduce the "TRADER STREET" to your friends 🙏🏻
__________________📈TRADER STREET📉___________________

⭕️BUY SOLANA Crypto in a convenient and safe place🧐⭕️You see Solana's analysis in four hours(SOLUSDT , 4H)🔎
🔰Given that Solana has returned from a strong support range (purple range) and has broken the white downtrend line 2 and 3, and it is expected that after the price returns from the resistance range with which it is engaged and the price pullback❗️ to the line White downward trend 3, I will buy❗️
The expected price movement is marked in yellow and I set the target in the purple resistance range, which overlaps with the downtrend line 1👌
⚠️⚠️Please observe capital management and open a low volume transaction❗️❗️
I hope this analysis is useful for you🙏🏻🌹
📌Please introduce the "TRADER STREET" to your friends 🙏🏻
_________________________📈TRADER STREET📉_____________________________

⭕️BUY Crypto TRON (TRX USDT) ❗️⭕️BUY Crypto TRON❗️
🔰You see the analysis of Crypto TRON in 4 hours ( TRX /USDT , H4 )🔎
🔰Trend lines are marked with white color and Supply range with purple color. 🧐
The profit limit and the limit of loss are specified in the image.
Some investments can be made with respect to capital management.❗️❗️
⚠️⚠️Please observe capital management and open a low volume transaction❗️❗️
I hope this analysis is useful for you🙏🏻🌹
📌Please introduce the "TRADER STREET" to your friends 🙏🏻
__________________📈TRADER STREET📉___________________

BUY BTC Neo wave time cycle study gives me the confidence.
weekly clossing on friday(06/18) is the end for corrective cycle 4/A.
An EXTRACTING TRIANGLE pattern completed today gives additional cushion with stop loss
Buying pressure and, weakness in gold and stocks will boost this crypto for 2 months for 4/B upto 51600
Levels given for long and shorts .
ENJOY CRYPTO TRADING!!

RSRUSDT - BUY Price breaking out of LTF correction channel Price has broken out of the LTF correction channel
Price formed a triple bottom before breakout

VET/USD Buy IdeaThis is my view on Vechan, after completing wave 5 on the way are ABC corrective waves. So I will look to buy it around 0.16 highlited area.

BITCOINWILLNEVERDIE NEXT EPISODE: THE BATTLE AT 10KAfter peaking above the resistance level at $7684 briefly, price level took an immediate drop down before gaining support at the 0.618 FIB level. Now with support and resistance between $7400 / $7450, bulls are due to continue their moon mission after surpassing $7450 and closing there. The battle of the comes up at $10.5K. Until then we feast.

