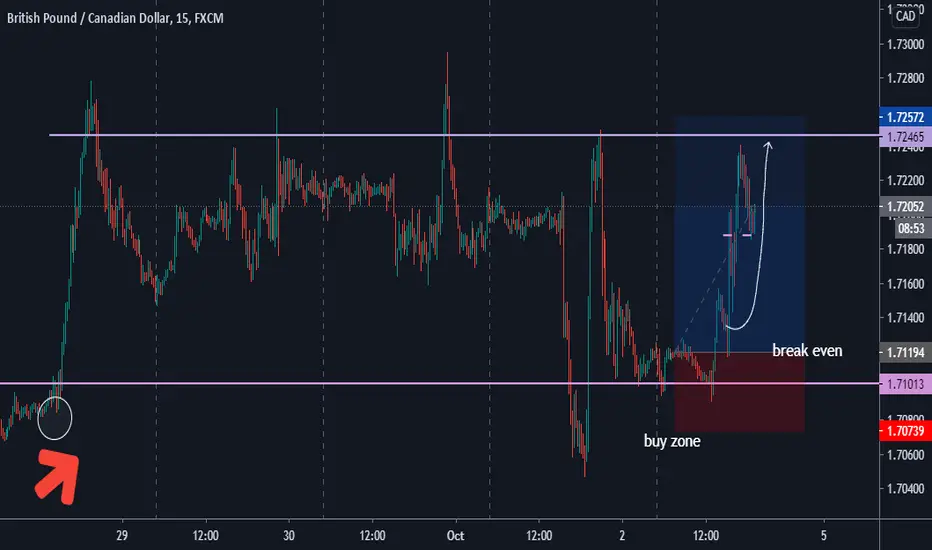
Break evens are signs of progress. Keep it upHi guys.... today ill be showing you my current trade, on going activated in the morning...
Its a range market transitioning to uptrend? may not.. always keep dat in mind that markets will surprises you
Move to break even
waiting for 6% trade or close the trade
Patience is a virtue
Buying

Bird's View | My favorite viewHi guys today ill be showing you the bird's view. This is my favorite analysis to see the overall direction of the market. As you can see I'm using 1hr charts my higher timeframe to see what is happening in the market. The market is ranging and there is a nice buy set up to me. Hoping i can secure a break even before the market turns against me.
See yah next week for more market view

Short Term TradingHi guys im trading a very short term trade, a pull back one. Trying to join the main uptrend if it favors me to go. Managing carefully to break even or let my stop loss -2% hit.. Happy trading everyone

Trade Accordingly to your own set-up Hi guys, today ill be showing you that trades that are in your set up are the best. They give you high probability trades. Bigger reward trade, less risk, and you can review it again and again to improve your trades. I always put stop loss to lessen my risk. Happy trading everyone

Potential Long on the EURCADWaiting for a clear break of structure on the EURCAD before I can actually enter the trade.
I would say it is still in a valid bear structure, but there is bull momentum to it too. Buyers are trying to drive the price up on the 4hour timeframe.
If they are successful in breaking the bear structure, I will wait for sellers to bring price down and test the region again. Then see if buyer can hold the level by overpowering the sellers.
Only then will I enter the potential buy.

EURCAD buyEURCAD buy opportunity, nearly broke resistance after an inverted head and shoulder formation

ETH looking food for long on 15min TFETH is showing signs of buy volume and accumulation. It could be good bet to long it on 15 min TF.

Kenji signals: buy AUDUSDToday, the indicator "Kenji" on the daily AUDUSD chart generated a buy signal.
Let's give some explanations on this signal.
This is the ordinary signal to open the trade with a basic volume .
According to the indicator, the price of AUDUSD is currently in the active uptrend phase (the area between the fast and slow averages is colored blue). At the same time, current prices entered the buy zone, which led to the formation of a "buy" signal.
The long position remains relevant until either the market conditions change (for example, the uptrend changes to flat or downtrend), or a signal to close it appears (a blue cross indicating a sharp divergence between the price and average values).
Recall, work in a trend is one of the most comfortable and potentially successful trading options.
For reference:
The "Kenji" indicator is a brand new look at the average analysis. The main problem of most trading strategies and indicators based on the average analysis is a number of false signals in the case of flat and trend reverse (for example, frequent crossings of the averages, numerous changes in the direction of the averages, etc.). As a result, averages analysis cannot show its real power and effectiveness.
The Kenji indicator using a unique algorithm avoids the most common average analysis traps and significantly improves the quality of signals by determining the current state of the market (using the color indication "Kenji" shows the current state of the market: red color - downtrend, blue - uptrend, green - flat).
It generates signals for comfortable trading in a local trend. The indicator provides information on both the timing position opening and the moments of profit taking. It also helps to determine the level of aggressiveness of a signal. This makes the "Kenji" indicator a handy tool both for novice and experienced traders.

Repcohome - Price Action Turning Around The price action turning around and now indicating strength which may lead to another rally up and may give 40-50% returns in short span of time.
T1- 220 T2- 240 SL -140

Kenji signals: buy EURUSDToday, the indicator "Kenji" on the daily EURUSD chart generated a buy signal.
Let's give some explanations on this signal.
This is the ordinary signal to open the trade with a basic volume .
According to the indicator, the price of EURUSD is currently in the active uptrend phase (the area between the fast and slow averages is colored blue). At the same time, current prices entered the buy zone, which led to the formation of a "buy" signal.
The short position remains relevant until either the market conditions change (for example, the uptrend changes to flat or downtrend), or a signal to close it appears (a blue cross indicating a sharp divergence between the price and average values).
Recall, work in a trend is one of the most comfortable and potentially successful trading options.
For reference:
The "Kenji" indicator is a brand new look at the average analysis. The main problem of most trading strategies and indicators based on the average analysis is a number of false signals in the case of flat and trend reverse (for example, frequent crossings of the averages, numerous changes in the direction of the averages, etc.). As a result, averages analysis cannot show its real power and effectiveness.
The Kenji indicator using a unique algorithm avoids the most common average analysis traps and significantly improves the quality of signals by determining the current state of the market (using the color indication "Kenji" shows the current state of the market: red color - downtrend, blue - uptrend, green - flat).
It generates signals for comfortable trading in a local trend. The indicator provides information on both the timing position opening and the moments of profit taking. It also helps to determine the level of aggressiveness of a signal. This makes the "Kenji" indicator a handy tool both for novice and experienced traders.

BNGO BioNano Genomics upside potenial, huge volume comingBioNano Genomics, Inc. is a life sciences instrumentation company, which focuses on genome analysis space.
Net Income $-29,820,000.00
Market Cap $69.23 million
Annual Sales $10.13 million
BNGO exceeded EARNINGS ESTIMATES in Q1 and on 7/17/2020 Maxim Group Reiterated the Rating to Buy and a target of $2.00 per share.
If you are interested to test some amazing buy and sell indicators, which give the signal at the beginning of the candle, not at the end of it, just leave me a message.
If you are interested to test some amazing buy and sell indicators, which give the signal at the beginning of the candle, not at the end of it, just leave me a message.

S&P Gameplay and the forecast for tomorrowWatch out the market and get ready to enter in a long position


DONT FOMO BUY!!!This is just a simple rule I try to follow when buying long term positions. This is not any kind of short term strategy or trend following. Its just an easy rule I try to follow to avoid buying at prices that are inflated. It's kind of common sense but you would be surprised.

USDCAD BUY Analysis/ Institutional TradingUSDCAD is going to rally to either the first second or third TP zone shown above. It is displaying the Wyckoff accumulation phase on the H1... It should carry on and play out a buy( Phase E) before reaching it's turning point for a potential sell, which is my tp3. Risk to reward ratio on this trade is exceptional and please use proper risk management. Safe Trading ;)

Potential Buy opportunity for GBPAUD/ Institutional trading According to my Institutional view of trading... GBPAUD will rally but before that I'm waiting for price to reach the area 1.79650, which is where I'm looking to place my buy trades as shown above (buy limit orders applicable as well). Then SL will be at 1.79069 meaning this is a low risk to high reward trade (Risking 55.8 pips for a reward of 279 pips). The TP area is at price level 1.82492, which is also a sell zone I'm looking @ to sell GBPAUD as soon as it reaches it (TP's 1 & 2 have been provided). Again risk to reward is very good and all the information has been provided on the chart .
Use proper risk management and safe trading ;)

The gold is will get stronger and stronger BULLIShHere w are again with this strong engulfing candle


