EQIX Potential Buy setupReasons for bullish bias:
- Price forming a bullish rectangle
- Entry is at breakout of rectangle for further confirmation
Entry Level (Buy stop): 828.70
Stop Loss Level: 784.23
Take Profit Level 1: 865.40
Take Profit Level 2: 917.64
Buyopportunity

SPT possible BUY setup Though this might be a risky play, since SPT is posting results in couple of days, I love what the charts are telling me at the moment.
This Chicago based firm provides social media management software for businesses.
Sprout Social has recently targeted larger companies for partnering, establishing a nice contract with Salesforce.
What am I looking now:
1. Though I mentioned that this play is a risky one, due to upcoming earnings, SPT i currently trying to break from it's Daily Cup and Handle formation.
2. Today's try was not a god try of breaking the highest point of the Cup and Handle formation, sitting at around $66.70 price level. Price did break that point at one moment, but it quickly failed to maintain above it.
3. Selling pressure was high unfortunately, there were nearly 782k shares sold once it broke through the resistance level.
4. Since I am considering this a risky play, my initial entry will be small, with stop loss possibly larger than usual. Stop loss will be sitting at around $57.39 price level, which is just below the wick of the last candle which bounced from the 50EMA.
5. Once the earnings report are published, I will either close the trade or add to the position, depending on the results posted.
As always, please do your due diligence, this is just an opinion.

BTCUSD LongBitcoin broke the daily bear trend line, and made its retest flawlessly, thus indicating the end of the bear market, and the continuation of the rise in the coming months. The RSI also indicates the possibility of an upside in the short term.

SNPS Potential Buy setupReasons for bullish bias:
- Price bounced from trendline
- Price has tested recent resistance turned support
Entry Level: 525.42
Stop Loss Level: 476.00
Take Profit Level 1: 574.84

XRP is likely to rebound from the lower support of this patter!BINANCE:XRPUSDT BITSTAMP:XRPUSD CRYPTOCAP:XRP Update
XRP is currently trending within a rising channel that has been in place for over 600 days. Presently, it maintains a position above the lower support level of this channel. We anticipate a potential rebound from this lower support zone.
The area marked by the blue box represents the accumulation zone.
Resistance levels to watch include the 50-day moving average, the 0.513 level, and the 0.85 level.
To invalidate this pattern, XRP would need to break below the lower trend line of the channel.
Stay tuned for further updates as the situation develops.

#StrongBuy #IOCLIOCL made a strong Bullish Structure on a Monthly timeframe.
It's a strong Buy on a Decent Dips.
Monthly Resistance Breakout.
Short Term targets 🎯 on Charts.

IR Potential buy setupReasons for bullish bias:
- Simple DOW theory
- Safe entry will be above 84.44
Entry Level(Buy limit): 80.12
Stop Loss Level: 73.64
Take Profit Level 1: 86.6

EL Potential buy setupReasons for bullish bias:
- Price is at strong weekly support
- Price has made a HL
- Entry is at breakout of last LH for further trend confirmation
Entry Level(Buy Stop): 153.03
Stop Loss Level: 122.18
Take Profit Level 1: 183.88

Airbnb: Unlocking Unique Experiences and Soaring Stock PotentialNASDAQ:ABNB the biggest hotel company that owns no hotels (funny how things work eyyy) has underperformed since its IPO in 2021.
We are finally starting to see its stock price catch up with its value. As more people travel and seek unique local experiences, the demand for Airbnb's platform is bound to grow in leaps.
Strong Financials: The company is highly profitable which is rare among tech companies, posting +4 Billion in Q3 2023.
Innovation: The company recently launched a new service called "Airbnb Experiences," which allows travelers to book unique experiences in the destinations they visit. This new service has the potential to drive further growth for the company.
Technical Analysis: The stock price is facing a significant resistance at $151, and a breakthrough could lead to substantial upward movement. I'll be monitoring this closely for an attractive entry point.

XRAY Potential Buy setupReasons for bullish bias:
- Price making a bull flag
- Safe entry at breakout of pole for confirmation
- No divergence
Entry Level(Buy Stop): 37.84
Stop Loss Level: 33.23
Take Profit Level 1: 42.45
Take Profit Level 2: 47.06
Take Profit Level 3: 51.67

MDLZ Potential Buy setupReasons for bullish bias:
- Price is making new Highs
- Price is near all time high, hence Buy stop order above it
- SL will be updated to new HL once the order gets triggered
- TP will be set accordingly using Fib extension
Entry Level (Buy stop): 77.68
Stop Loss Level: 68.63

Strong Buy SBIN cmp 622, Target 670++ within 3-5 trade sessions.State Bank of India is a Fortune 500 company. It is an Indian Multinational, Public Sector banking and financial services statutory body headquartered in Mumbai. It is the largest and oldest bank in India with over 200 years of history.
Branch Network
Presently, the bank operates a network of 22,219 branches and 62617 ATMs across India. It also operates 71,968 business correspondent outlets across India.
Market Share
The bank has a market share of 22.84% in deposits and 19.69% share in advances in India. It has a strong customer base of 45 crore customers.
Loan Book
Retail loans account for 39% of the loan book, followed by corporate (37%), SME (14%) and Agriculture (10%). The bank has a well-diversified loan book exposed to various sectors. Top sectors include home loans (23%), infrastructure (15%), services (12%) and agriculture (10%). 75% of the corporate advances are rated A and better ratings from rating agencies. 38% of the corporate book accounts for PSUs & Govt. departments.
International Business
The bank has a global footprint with a network of 233 branches/offices in 32 countries. It has presence in USA, Canada, Brazil, Russia, Germany, France, Turkey, Australia, Bangladesh, Nepal, Sri Lanka and other countries. Presently, Overseas business accounts for 3% of total deposits and 13% of total advances.
Government Business
SBI has always been the banker of choice to the government of India and is the market leader in government business. It had turnover of 52,50,000 lakh crores and commissions of 3,700 crores from government business in FY20.
Financial Inclusion Business
The bank has 71,000 BC outlets which has primary focus on financial inclusion customers. The bank accounts for 40% of all PMJDY accounts i.e. more than 12 crore accounts. Presently, the deposits from PMJDY accounts are 42,500 crores i.e. 1.2% of total deposits of the bank.
Digital Metrics
Increasing digitization resulted in 40% of asset accounts and 60% of liability customers added via digital channels in FY21.
Subsidiaries Operations
The bank owns various subsidiaries which are engaged in related business activities :-
1. SBI Capital Markets Ltd (100% stake)
2. SBI DHFI Ltd (72% stake)
3. SBI Cards and Payment Services Ltd (69% stake)
4. SBI Life Insurance Co. Ltd (57.6% stake)
5. SBI Funds Management Pvt Ltd (63% stake)
6. SBI General Insurance Company Ltd (70% stake)
KEY Ratios (Q1FY24)
Capital Adequacy Ratio - 14.50%
Net Interest Margin - 3.34%
Gross NPA - 4.77%
Net NPA - 1.23%
CASA Ratio - 45.15%
Book Value ₹ 402
Price to book value 1.55
Bank's performance:
Quarterly net profit of 14,330 crores.
Operating profit for Q2FY24 at 19,417 crores.
RoA for H1FY24 at 1.10%.
RoE for H1FY24 at 22.57%.
Net interest income increased by 12.27% YoY.
Non-interest income increased by 21.59% YoY.
Credit growth:
Domestic advances grew by 13.21%.
Driven by SME advances, retail personal advances, and agri advances.
Corporate segment advances grew by 6.62%.
Asset quality:
Gross NPA ratio improved by 97 bps YoY to 2.55%.
Net NPA ratio improved by 16 bps to 0.64%.
PCR improved by 39 bps YoY to 91.93%.
Future outlook:
Credit and deposit growth expected to be around 16-17% in FY24.
Margins may see a slight compression of 3-5 bps due to increased deposit rates.
Aims to maintain credit growth momentum by disbursing pending loans and converting proposals into sanctions.
SME loans:
Witnessed healthy growth in SME book.
Initiatives taken to improve infrastructure for SME lending.
Expects to reach target of 4 trillion in SME loans by FY24.
Unsecured loans:
Unsecured loan portfolio, including Xpress Credit, has a low GNPA ratio of 0.69%.
Resilient in terms of asset quality.
Digital initiatives:
Increased traction in cross-selling business through YONO.
Sourced 61% of savings bank accounts digitally.
Launched "YONO for Every Indian" and witnessed growth in digital loan portfolio.
Capital adequacy:
Well capitalized with a capital adequacy ratio of 14.28% and CET-1 ratio of 9.94% which is well above regulatory requirements. Expects CET-1 ratio to improve further with ploughing back of profits.
Conclusion:
SBIN stock price has given a breakout multiple times along with the strong volumes and today it has retested the breakout zone, which is a strong buying point for a minimum target of 670 in 3-5 trading sessions. Fundamentally, stock can has an intrinsic valuation of Rs.800 so there is an enough cushion and momentum on upside.

ABNB Potential Buy setupReasons for bullish bias:
- Price broke double bottom neckline
- Potential Cup and Handle formation
Entry Level: 142.34
Stop Loss Level: 129.62
Take Profit Level 1: 155.06

SBUX Potential Buy setupReasons for bullish bias:
- Price broke Last LH
- Bounce from strong support
Entry Level(CMP): 96.17
Stop Loss Level: 90.95
Take Profit Level 1: 101.39
Take Profit Level 2: 106.61

SWING IDEA - NAZARA TECHNOLOGIESWe can see a very good buying opportunity in NAZARA TECHNOLOGIES .
The reasons are stated below :
750-770 zone was tested multiple times and finally it broke and is now retesting it
0.382 Fibonacci support
Price action formation - higher highs
Double bottom pattern on higher timeframe (500 zone)
Targets - 926 // 1066 // 1345 // 1681
StopLoss - 730 on closing basis

ITW Bull flag formationReasons for bullish bias:
- Price forming a potential bull flag
- Entry is at breakout of pole for further confirmation
- HH breakout will also add confluence
- TP till projection
Entry Level (Buy Stop): 264.22
Stop Loss Level: 249.49
Take Profit Level 1: 278.95
Take Profit Level 2: 293.68
Take Profit Level 3: 300.56

Bullish on Snowflake Inc. ($SNOW)NYSE:SNOW is looking to break through a major resistance price of $205 and start snowballing to the north of the charts. Targeting the $300 price which is the next major price level.
Snowflake has demonstrated remarkable revenue growth since its IPO!!
As businesses increasingly migrate to the cloud for data storage and analytics, Snowflake's innovative cloud-native data platform stands out. Its architecture allows for seamless scalability, flexibility, and real-time data insights, making it a preferred choice for enterprises seeking advanced data solutions
The company's subscription-based model, coupled with a diverse customer base, contributes to a steady revenue stream. With a rising demand for cloud data warehousing and analytics, Snowflake is well-positioned to capitalize on this trend and continue its impressive revenue trajectory which will reflect its stock price.
Make it SNOW $$$

FTNT Potential Buy setupReasons for bullish bias:
- Price making HH HL
- Price crossing 63.44 would be another confirmation
- Testing resistance zone
Entry Level: 63.44
Stop Loss Level: 57.39
Take Profit Level 1: 69.49
Take Profit Level 2: 75.54
Take Profit Level 3: 80.69

ADBE Buy Setup- Price bounced from trendline and support showing good buy opportunity
EP: 586.92
SL: 558.19
TP1: 615.65
TP2: 644.38
TP3: 673.11

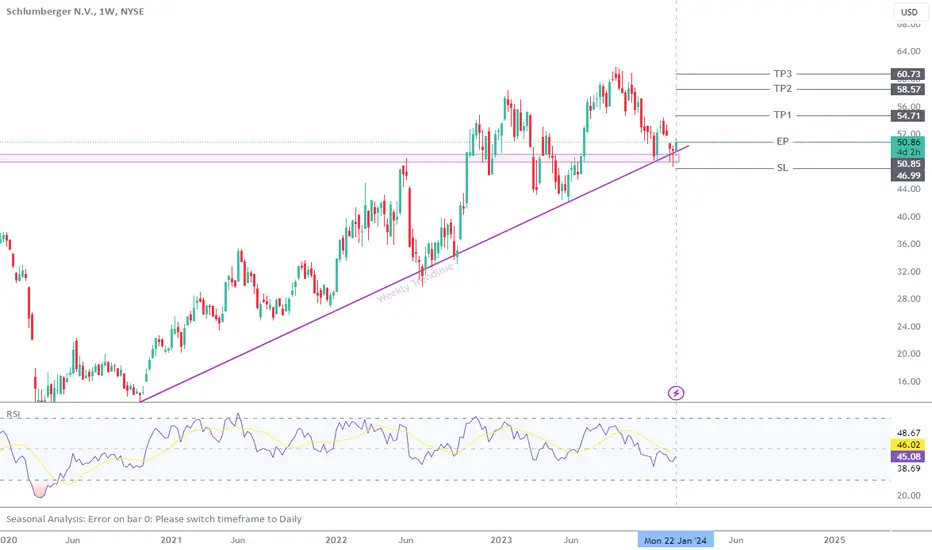
SLB Potential Buy setupReasons for bullish bias:
- Price respected strong trendline
- Hammer candle formation on the support
Entry Level: 50.85
Stop Loss Level: 46.99
Take Profit Level 1: 54.71
Take Profit Level 2: 58.57
Take Profit Level 3: 60.73
Eurcad buyHello guys, on eurcad we have a strong continuous breaks to the up side and we currently have a deep pullback at the discount pricing which we are expecting the market to continue higher .

Gold finally picking up?As Gold has been falling for the past few weeks. We could see momentum pick up in the direction of gold gaining in value. Since the BTC ETF's have been approved we saw a bit of a stabilized movement with the pair. With this sentiment & analysis we saw the safe haven.. gold drop..from the looks of what it happening currently it could technically still be on a downtrend but i'd like to do a bit of counter trend trading today since the volume looks to be accommodating to the upside since London session.
*** KEY ANALYSIS ***
- I'm looking for breaks to the upside of gold of 2032.87. i need the 30mm candle to close above this point before i can have a confirmation of execution. stops under my zone at 2029.26

The Bullish Case for TESLAOne of the biggest misconception on Tesla is that it is just an Electric Vehicle Company but that is not the case. Tesla is also a Robotics, AI and energy company. If you look at it from that lens, TESLA is undervalued and has a great future!!
TESLA recently bounced off the $212 Support level and believe this is the start of a bullish trend. Targeting the $300 Price point and we may even see $300 by the end of 2024.
For context Elon recently tweeted this on TESLA
"I am uncomfortable growing Tesla to be a leader in AI & robotics without having ~25% voting control. Enough to be influential, but not so much that I can't be overturned.
Unless that is the case, I would prefer to build products outside of Tesla. You don't seem to understand that Tesla is not one startup, but a dozen. Simply look at the delta between what Tesla does and GM. As far as stock ownership itself being enough motivation, fidelity, and other similar stakes to me, why don't they show up for work?"
In this tweet, Elon Musk expresses his desire for greater control over Tesla's direction as the company expands into AI and robotics. He believes that his current 13% stake in the company is not enough to make significant decisions in these areas.
Tesla has a great future and as long as Elon is the captain, this ship will continue to go to mars and beyond. cheers
