Siri setup for uptrendSiri is at the bottom of its trend channel. Expecting it to go back up soon, Good spot to buy now or $5.75 if you want more at the end of the dip, but trend shows this point might be going back up.
Buyopportunity

BITCOIN ENTERRING OUR BUYING ZONE :BE READY: -------.Sigma zone is very near you did't get enough time to --"ACCUMULATE".

ACTION CONSTRUCTION EQUIPMENT LTD ACTION CONSTRUCTION EQUIPMENT LTD GOOD FOR SWING
Daily chart time frame breakout
volume is high
BUY 301.90
sp 267
1st target 333
2nd target 365
⚠️ Important: Always maintain your Risk & Reward Ratio.
✅Like and follow to never miss a new idea!✅
Disclaimer: I am not SEBI Registered Advisor. My posts are purely for training and educational purposes.

Gold buy opportunity Hi
We are in begging of powerful wave 3 on elliot wave analysis. Based on this theory, gold is started to be 2300 and over it.
Please buy on this point.
Have a good trade.
Bye

MANYAVAR aka. VENDANT FASHION LTD looks like a great buy at CMPVEDANT FASHIONS LTD also better known as MANYAVAR is a Monopoly clothing and accessory business when it comes to marriage related shopping.
Also, it has very strong Fundamentals.
Recently, It has broken on UPSIDE from the Box on good volumes.
Volumes are rising each day, can be an interesting buy for Medium to Long term.
Note: This is not an investment advice.

Let’s goPrice is strong bearish on HTF. But this looks like a good scalp. Will take ifhourly closes bullish and some sort of engulfing candle for afternoon NY sess

Great buy opportunity for nikkeiHi
In my elliott analysis, we are in second wave and the third (and very profitable wave) will be started soon.
Two target is shown in chart by fibo and resistance line.
Please like my idea if you agree with it.
Have good trade
Yours

Dax's buy opportunityHi
According my Elliot analysis, we are in starting of third wave for Dax index. This impulse wave can increase to 14730-14950 at the first state.
Have good trade
Yours

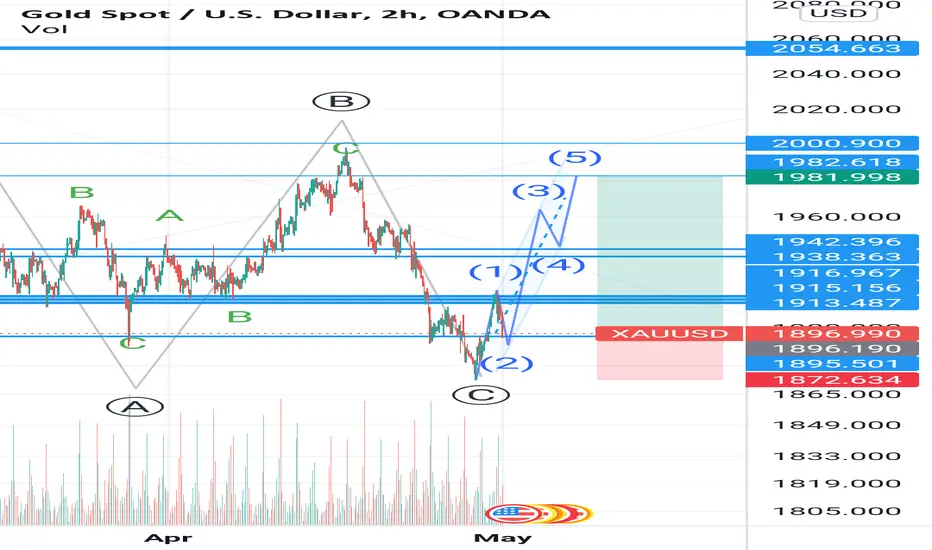
Gold's buy opportunityHi
The correction of third wave wss done and forth wave was finished.
We are in impulse increasing wave and a best opportunity to buy.
Have good trade.
Bye
Call Option Setup *ATER*Speculating that ATER will break 5.20 resistance and move up towards $6 a share. Im looking to buy a $5 call option expiring 4/29. A perfect wedge is being set up, good buy oppurtunity in my eyes.

JSMR will shine during Eid holidays 2022. Buy now !!positive sentiment supported the movement of JSMR shares during the Eid holiday season. Based on the news and also from a technical perspective, JSMR shares are also in an uptrend phase with a bullish candle supported by an increasing volume along with an increase in the oscillator and MACD indicators

RIOT Calls *Not Financial Advice* *All Speculation*Looking to buy Call options for RIOT. Depending on how BTC reacts to 38000 resistance level will be the determing factor to if I buy these call options. If we see a break at 38000 then RIOT will more then likely trade down to $10 a share, this is where im looking to buy in. However if we see a reversal at 38000 then RIOT will likely trade into 11.5-12 zone. If we dont see a reversal at 38000 then im speculating market will retest at 36000. The exact play im looking at is a RIOT 11.5 Call Expiring May 6. Entry zone is $10 area and Exit Zone is 11.5-12 area.

QQQ Calls ??? 4/26 - 4/29 Analysis Looking for QQQ to bounce of 318 and retest this restistance. If I see a reversal at 318 I will be buying call options that expire 4/29. If this goes how I predict then I will be looking to sell my option contracts in the 324-327 Zone before the contracts expire. Depending on how QQQ reacts to 322 resistance will determine my exit.

Buy CUMMINSINDStock gave breakout from descending triangle pattern!
Can be bought @cmp for target of 1065.
Take SL at 840.
R:R is 2.22 if bought at 910.


Gland pharma Daily seen double bottom and rsi divergence buy at Cmp(3300)Sl will at 3200 for 3450 3500 ++

WAR WeStarter Cryptocurrency Launchpad at $1 Million Mk capWAR WeStarter is a cross-chain token initial swap platform which selects high-quality crypto projects that need fundraising before listing to major exchanges.
It was launched in May 2021 at $2. Due to market conditions, the price is now $0.071 and the market cap is $1 million.
The first financing was completed on April 15th, and the participated investment institutions include Continue Capital, SevenX Ventures, NGC Ventures, AU21 Capital, Spark Digital Capital, LD Capital, Power Law Capital, Kyros Ventures, DoraHacks Ventures, SkyVentures, DEFI TIMES CAPITAL and others.
A similar incubator is SFUND Seedify, has a mk cap of $185Mil.
So The upside potential is 185X from here just to reach SFUND`s market cap.
Extremely low circulating supply, with few thousands usd, you ca substantially move the price.
The RSI shows a massive bullish divergence. Increase in volume while decrease in price.
Minimum upside potential is 10X in my opinion.

Paypal Correction coming to an end ? Paypal has taken a beat down this week but when we zoom out its no more than a healthy correction .
Price began to correct after putting in a double top back in the summer and from then on we identify a change in market structure .
We are way down at the .786 Fib and heading towards .886 for around 110 a share .
Always wait and see the reaction of a level and look at volume and reactions on a LTF will give you some clarification.
If .886 is the last stop then you want to see a change in market structure on LTF with a higher low /Higher high but i
would expect a reaction at this level .
Fib speed fan and FIB Expansion used in chart + fixed Range

$GGPI Gores Guggenheim, Inc. intends to acquire assets and businesses through a merger, capital stock exchange, stock purchase, reorganization, or similar business combination. The company was founded in 2020 and is based in Boulder, Colorado.

MATIC Following BTC Correction [10:51/Dec 3] MATIC Following a correction we have a main support resistance line that will impact the price and decision of the trend, some how it looks it can go and find a bottom around $2 this all depends on how low BTC can go on this weekend correction.
Get ready to add more matic later this day.

Waiting for retest for LINA/USDTHi all,
Why I see an opportunity
LINA broke through the resistance yesterday.
The retest area corresponds nicely with the Fibonacci level
With the current bullish sentiment, I am waiting for a retest as final confirmation before entering the trade. For this, I keep an eye on the price action on lower timeframes. (I don't set a buy limit).
Possible Disadvantages
- Retest can also be higher so we miss the boat
- The leverages traders (including me) are being tricked with a false breakout.
Always do your own research and use proper riskmanagement

Buy opportunity ICP/USDTA few days ago I drew a scenario where I see a buying opportunity when the price goes above $45. The price has moved above this resistance today. Not very extreme, but in an interesting way.
Fib confirmation
The Fibonacci level is between .649 and .81. Combine this with other factors (see drawing) and I expect an increase to $68. I have a spot trading for longer-term and a leverage position as in the chart.
Risk
The disadvantage is that there is no uptrend yet so that consolidation can continue. Always do your own research and have good riskmanagement.

View on ICP/USDTICP has been accumulating for a month. I think in a positive scenario we could see a breakout around $45. It can of course also happen that the accumulation continues.
Leverage trading
In the case of leverage trading, I would wait for a retest at a price level of $50 or $55 (depending on a breakout). The lower timeframes help you to have a sexy entry.
Spot trading
In the case of spot trading, the price is quite low compared to earlier this year.
Important!
The information is based on my opinion and is not financial advice
