Buyopportunity

$KILO Setup Looks Prime — This Could Just Be the StartTSX:KILO is showing real strength right now.🚀
Price broke out of a clean downtrend and reclaimed the horizontal support zone. That reaction from buyers? Strong and confident.
The chart offers two clear scenarios, but both point to the same thing: more upside ahead.
Targets? $0.057 and $0.08 are on the radar.
The structure’s bullish, and momentum is shifting fast.
Looks like TSX:KILO is just getting started.
DYOR, NFA

$NKN Heating Up — Breakout Imminent?GETTEX:NKN is waking up.
It held that trendline perfectly, and now it’s pushing back strongly.
Price was getting squeezed in that wedge for days looks like it’s ready to pop.
That top line? It’s not going to hold for long.
Volume is picking up, and this move could easily send it flying to $0.06.
Feels like one of those setups where momentum just builds up and boom, breakout.
Keep your eyes on it. This one’s heating up fast.
DYOR, NFA

$AVAAI Looks Ready to Explode — Don’t Blink!$AVAAI looks locked in for the next leg up.
After a clean breakout from the previous resistance zone, the price is now forming a solid base above its classic bullish structure.
The trendline’s been respected. Buyers stepped in early.
Volume’s healthy. Structure’s is strong.
In my view, the chart is screaming continuation.
$0.095 and $0.11 could come faster than expected.
Don’t blink, this move could get explosive.
DYOR, NFA
#ALTSEASON #CRYPTOMOJO_TA

$SUPRA Breakout Confirmed — Trend Reversal in Play!$SUPRA just flipped the script!
After months of bleeding under a brutal downtrend, it finally broke out clean and confident.
That long-term resistance? Crushed.
Now it's retesting the breakout zone, a classic reclaim move.
EMAs are curving up, momentum's clearly shifting.
In my opinion, this breakout confirms a trend reversal.
Buyers are stepping up.
$0.0096+ Looks like the next magnet.
like if you are bullish!

CHILLGUY Structure Looks Solid — Watch for the Bounce#CHILLGUY IMO, it will come back around the previous resistance level, which is now acting as support.
From there, we can see a fresh bounce and a strong move upward.
The structure looks good; there is no noise, just clean price action.
#Altseason2025

$CGPT Holding Strong — Another Move Coming?$CGPT is holding the uptrend well. 🚀
It bounced from the trendline and the 200 EMA, just like before.
The structure still looks strong with higher lows and steady volume.
This pullback could be the setup for another move up.
Watch this level closely.
Retweet if you are bullish!
DYOR, NFA
#Altseason2025

$DARK Breakout Alert — 2x Potential in Sight?Spotted something interesting on $DARK 👀
After 10 days of slow grinding, it broke out of a falling wedge, and now it’s retesting that level perfectly.
No panic, just a clean setup.
If this bounce holds, we could see a strong move up, even 2x from here.
It might be time to zoom in before everyone else does.

PATIENCE WILL PAY OFF 〉LONG TERM BUY COMING SOON.As illustrated, I'm trying to visualize what the next couple of weeks could look like.
Taking into consideration the fact that May + June are corrective months for gold historically (don't believe me; check the seasonality tool...) , Is likely for price to range up and down within quite a wide range anywhere between 3300 and 3100 before it enters a bullish continuation impulse by the end of June and into first week of July.
( I have illustrated 2 potential buying areas; one closer to price and another extended one lower )
That being said, one must adapt to such market conditions that will only offer certain structure offering a few intraday trades, but mostly short term trades or quick scalping moves all within a same trading session, simply because as each session comes in, they will target previous sessions highs or lows (ranging back and forth in an uncomfortable manner and without a clear direction).
Asia would target Sydney's open, then London might target Asia's open, then NY might target any low or high in the opposite direction... and so on back and forth without truly holding a bullish or bearish structure longer than a few hours to a full calendar day before it turns around (sideways behavior).
As price reaches "stronger psychological" price levels like 3150, 3100, 3050 and potentially 3000; then you might start seeing evident rejections within higher timeframes (4H and 1D); ideally seeing rejection wick/s followed by a nice push up showing true power and volume to the upside, potentially signaling the bottom of this correction phase.
TIME should be aligned with this market behavior; that means that checking the seasonality tool. every year (on average 5, 10 and 15 years), gold makes a bottom during the first week of JULY ...
So... market structure, price, and time must be aligned correctly and it will all make sense whenever that moment comes; hence, the title of this idea.
I am personally not worried about any sort of economic event; news are only gas for the market to move and create liquidity and volatility.
AT THIS POINT, THE ONLY THING THAT COULD TRIGGER A SIGNIFICANT MOVE IN GOLD, IS A GEOPOLITICAL EVENT THAT WOULD TRULLY TRIGGER UNCERTAINTY IN THE MARKETS... .
--
GOOD LUCK!
Persaxu

$SIGN Waking Up — Breakout Looks CleanSIX:SIGN is waking up 👀
It broke out of the downtrend clean move above $0.09
That old resistance? Now acting as support. That’s a good sign.
Price is holding above the MA, buyers are in control.
Next stop? $0.105 to $0.12 range.
This could be just the beginning.
Keep it on your radar.
#ALTSEASON #GEM

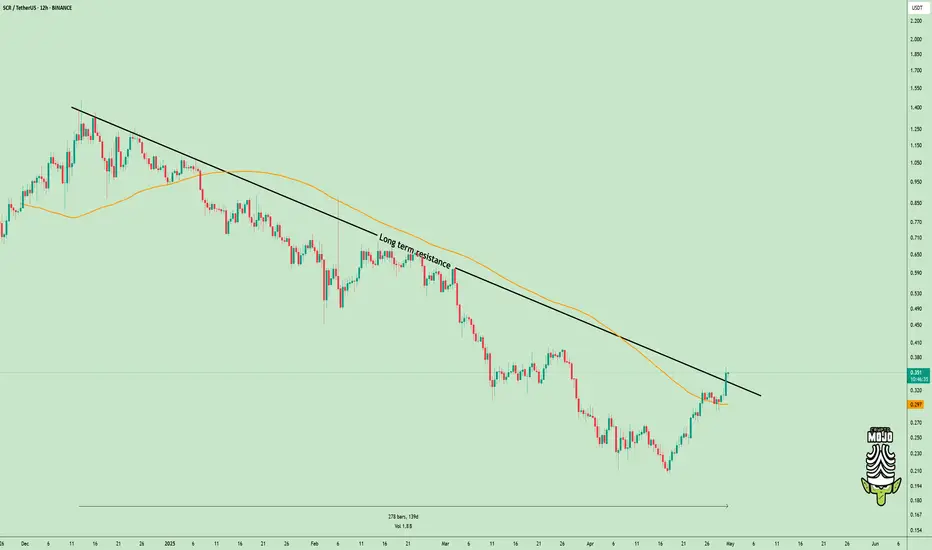
Downtrend Over? $SCR Just Flipped the Script!TSX:SCR just broke out after moving down for 139 days.
This isn’t just another pump, it’s a change in direction.
- Price broke the long-term downtrend
- Jumped above the 200 EMA
- Now testing the breakout zone again
If this area holds, bulls could take control and push higher.
It’s a clean setup, don’t ignore it.
DYOR, NFA
#ALTSEASON
ETH is showing a potential reversal !on the 15 minute chart,
Price is holding strong above the support zone
and is now testing resistance at $1815
if it breaks, the next target is $1830.
scalpers don't miss this breakout opportunity!

XRP Breakout Watch — Are You Positioned for the Move?#XRP is still respecting the 150-day falling wedge structure.
Price is pushing toward the upper resistance with rising momentum.
If the breakout confirms, a strong move could be ahead.
Watching closely for confirmation.
Retweet if you're ready.
#Altseason2025

$ALT Breaks 136-Day Resistance — Big Rally Loading?#ALT has officially broken above the 136-day-long resistance.
Price is now consolidating above the breakout zone, showing strength.
If momentum continues, a major rally could be ahead.
Watching closely for confirmation of the next move.
NASDAQ:ALT BINANCE:ALTUSDT

WolfIn a premature stage but if the price sustain at the level of around 3$ then the potential targets around 3.5 and above.

Next BTC Peak in Dec 2025?#Bitcoin Duration of Expansion Phases Above Previous All-Time Highs (ATH)
Historically, the time Bitcoin spends above its previous ATH increases with each cycle.
> In 2017, the expansion phase lasted 211 days.
> In 2021, it extended to 285 days, a 74-day increase (+29%).
If this trend continues, the current cycle’s expansion phase (starting Oct 2024) could last 425 days (+29% from 2021), projecting an end in Dec 2025.

Global Market Overview. Part 2 — U.S. Stock Indices Start of the series here:
Indices? What about the indices?
When the market isn’t an economy, but a chessboard riddled with landmines.
As much as we’d like to see rationality reflected in index charts, indices are not the economy.
They are derivative instruments that track the capital flow into the largest publicly traded companies. In our case — they serve as a mirror of the U.S. stock market. But here’s the thing:
There’s one core principle that most analysts love to forget:
Once interest rates are cut — the game flips bullish.
Cheap money doesn’t lie idle. It flows straight into corporate balance sheets. And one of the first strategies that gets deployed? Buybacks.
Share repurchases are the fastest way to inflate stock prices — without changing the product, the market, or even the strategy. It’s an old Wall Street tune. And it’ll play again the moment Jerome Powell gives the signal to cut. Even if he says, “It’s temporary,” the market won’t care — it’ll act automatically.
But what if the cut doesn’t come?
What if the Fed drags its feet, and U.S.–China relations fully descend into trade war?
What if instead of cheap money, we get a recession?
That scenario benefits neither the U.S. nor China. Despite political theatrics, the two economies are deeply intertwined. Much more so than their leaders admit.
The unspoken threat from China
If Beijing wanted, it could cripple the U.S. economy overnight —
Nationalizing all American-owned assets on Chinese soil, from Apple’s factories to Nike’s logistics chains.
If that happens, dozens of U.S. corporate stocks would be worth less than toilet paper.
But China doesn’t make that move. Because blackmail is not the tool of strategists.
Beijing thinks long-term. Unlike Washington, it counts consequences.
And it knows: with Trump — you can negotiate. You just have to place your pieces right.
Want to understand China? Don’t read a report — read a stratagem.
If you truly want to grasp how Beijing thinks, forget Bloomberg or the Wall Street Journal for a minute.
Open “The 36 Stratagems” — an ancient Chinese treatise that teaches how rulers think.
Not in terms of strong vs. weak — but when, through whom, and against what.
You’ll see why no one’s pressing the red button right now: the game isn’t about quarterly wins — it’s about future control.
The economy is built for growth. That’s not ideology — that’s axiomatic.
Argue all you want about bubbles, fairness, or who started what.
One thing never changes: the global economic model is based on growth.
No ministry or central statistical agency can stand before a microphone and say, “We want things to fall.”
Markets reflect future expectations. And expectations are, by definition, based on belief in growth.
Even crashes are seen as temporary corrections, paving the way for recovery.
That’s why people always buy the dip.
Not retail. Smart money.
Because no panic lasts forever — especially when the whole system is backed by cash.
The U.S. controls the market through headlines
This logic fuels Washington’s strategy.
Today, Powell “waits.”
Tomorrow, the White House stirs panic with tariff threats.
The day after — surprise! “Constructive dialogue.”
And just like that:
Markets rally, dollar corrects, headlines flip from “crisis” to “hope.”
It’s not coincidence. It’s perception management.
Markets crash fast — but they rebound just as fast, once a positive signal drops. Especially when that signal touches the U.S.–China trade front.
One line — “talks are progressing” — and by nightfall, S&P 500 is back in the green.
Why? Because everyone knows:
If there’s de-escalation — it’s not a bounce. It’s a new cycle.
The recovery scenario
Here’s what happens if negotiations progress:
The dollar weakens — capital exits safe havens
S&P 500 and Nasdaq spike — driven by tech and buybacks
Money flows back into risk assets — especially industrials and retail, exposed to international trade
Gold and bonds correct — as fear fades
We don’t live in an era of stability. We live in an era of narrative control.
This isn’t an economic crisis.
This is a crisis of faith in market logic.
But the foundation remains: capital seeks growth.
And if growth is painted via headlines, buybacks, or a surprise rate cut — the market will believe.
Because it has no other choice.
In the markets, it’s not about who’s right —
It’s about who anticipates the shift in narrative first.

ABCD Pattern Intact
Monthly Closing above 388 would Trigger
more positivity towards 430 - 440.
465 is Important Resistance.
remember, Crossing & Sustaining 465 with
Huge Volumes may exposes New Highs towards
600+
However, it should not break 320 in
worst case.

#Bitcoin is bouncing again!#Bitcoin is bouncing again!
The weekly 50 EMA is holding strong as support.
Every time this happens, a big move follows.
Are we about to see a new rally? 👀
Retweet if you're bullish
#BTC #Crypto

continue to grow, conquer new ATH, XAU⭐️GOLDEN INFORMATION:
US economic data delivered mixed signals. Import prices stayed subdued, while the New York Fed Manufacturing Index outperformed expectations, with several internal components also showing strength. However, inflationary pressures resurfaced as prices paid climbed back into expansionary territory, and the six-month business outlook showed signs of weakening.
Looking ahead, gold traders will closely monitor March Retail Sales and remarks from several Federal Reserve officials, particularly Fed Chair Jerome Powell’s speech on Wednesday. Additional focus will be on upcoming housing figures and weekly Initial Jobless Claims to gauge the broader economic landscape.
⭐️Personal comments NOVA:
After accumulating at the beginning of the week, gold price started to grow strongly reaching 3275 and will continue to move towards the new ATH zone.
⭐️SET UP GOLD PRICE:
🔥SELL GOLD zone : 3288- 3290 SL 3295
TP1: $3270
TP2: $3250
TP3: $3235
🔥BUY GOLD zone: $3167 - $3165 SL $3160
TP1: $3180
TP2: $3200
TP3: $3220
⭐️Technical analysis:
Based on technical indicators EMA 34, EMA89 and support resistance areas to set up a reasonable BUY order.
⭐️NOTE:
Note: Nova wishes traders to manage their capital well
- take the number of lots that match your capital
- Takeprofit equal to 4-6% of capital account
- Stoplose equal to 2-3% of capital account

BEARS ARE TRAPPED 〉3300 SOONAs illustrated, I'm trying to visualize a brief pull back next week making the low of the week early into Monday.
Potentially ASIA making the week's low on Monday's open.
I was able to visualize the path to 3200, and showed in a past idea how 3200 COULD HOLD as support ... so I wouldn't be surprised if price doesn't even get to 3100, although it could very well find a support there as it is a strong psychological + institutional price at which many central banks, brokers, hedge funds, etc could be dealing gold.
In other words, institutions willing to add long positions or even position themselves for the week, they'll do it a these key round numbers easy to deal big orders with... (3,200; 3150, 3100, etc).
That being said, we can't ignore or take out the fundamental aspect of gold which, as a matter of fact, it is its main driver until this day. That is: tariff war escalating, stock market on the edge of a cliff, geopolitical conflict very uncertain, ... and much more.
Not only investors are protecting their assets with gold, but CENTRAL BANKS keep purchasing gold... for a reason...
I've said it multiple times before: any dip is a buying opportunity. Every correction is a bear trap... to traders that think gold is like any other FOREX pair that responds to "divergence" or "stochastic crossovers" or some random indicator.
As these retail traders pile in with short trades, the trend continues to take them out and all of that liquidity is actually serving as more gas and power for gold to expand higher and higher... since for every buyer there must be a seller ...
"But it's so expensive". .. well... define "expensive". There is no historical point that defines today's price as "expensive" ... it's simply the new and actual price of gold.
THE TREND IS YOUR FRIEND.
--
GOOD LUCK!

Xauusd up trend Gold has been on an up trend since Friday.
And it will continue it uptrend up to the price of 3280.
So tape profit will be at 3280

WILL GOLD MARK NEW ATH TRUMP TERRIF ALERT!🚨 GOLD UPDATE (XAU/USD)🚨
Gold is showing a strong bullish trend, and it’s expected to continue for the next month. 🌟 If you see any dips, buy in again and again! We could see gold touch 3200 soon, especially with the ongoing China & Trump tensions. The US economy remains strong, and fundamentally, gold is primed to soar even higher! 📈💥
After Trump's tariffs, gold may dip and sweep more liquidity before bouncing back stronger. ⚡ As China and Trump battle, US strength keeps pushing gold to new heights. 📊
Key Buying Zones 🔑:
- 3030 – 3035: Last zone for reversal 🔄
- 3000: Strong support zone 🚀
Targets 🎯:
- 3100 💰
- 3200 💎
- After 1 month: 3300 💥
⚠️ Always follow risk management⚠️
