PI...Hello friends
Given the good growth we had, we now have the opportunity to buy in the pullback...
You can buy in steps within the limits we have specified for you with capital management...
*Trade safely with us*
Buysellsignal
BTC/USDT#BTC's possible bottom is in.
- took support on a long-term weekly trendline.
-bounced off the 50-week Ema support.
-W.D. Gann's 14th march reversal date

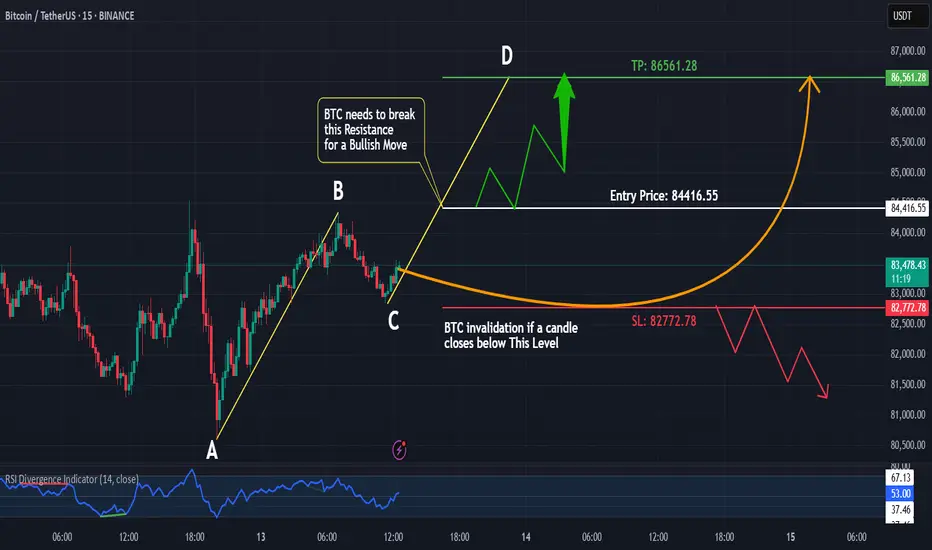
BTC Bulls Are Back? AB=CD + 0.618 Fib Rejection!#Bitcoin is setting up for a potential bullish breakout!
On the 15-minute time frame, #BTC is forming a classic #AB=CD pattern, a strong harmonic signal for a continuation move. Additionally, price has just rejected the 0.618 Fibonacci retracement level, confirming buying pressure from this key zone.
Key Observations:
🔹 Uptrend Intact – Higher highs and higher lows ✅
🔹 AB=CD Completion – Potential bullish price reaction ✅
🔹 0.618 Fib Rejection – Strong demand zone ✅
🔹 Resistance Level Ahead – Awaiting breakout confirmation
Trading Plan:
If #BTC breaks above the resistance level, I’ll be looking for a long trade setup with proper risk management.
🔹 Invalidation: If #BTC breaks below the Fib level, I’ll reassess my bias.
🔹 What are your thoughts? Will #BTC break out or face rejection? Drop your opinions in the comments!
🔹 Like, Comment & Follow for more trade setups and market insights!
Financial Apocalypse? Markets Crash as Billions Flow into Cash –A New Wave of Market Turbulence: How Trade Wars and Uncertainty Affect Investors
The US stock market is currently undergoing a massive sell-off, which analysts compare to previous financial crises. Both institutional and retail investors are actively exiting equities and high-risk instruments, including cryptocurrencies. The accumulated anxiety is driven not only by the global economic cycle but also by specific political decisions: trade wars and protectionist measures are putting significant pressure on corporate earnings and market expectations.
Early Signs: Tariffs and Escalation
When Donald Trump announced increased tariffs on imports from China a few years ago, the stock market reacted sharply but briefly. Many analysts hoped the tensions would turn out to be short-lived negotiating tactics. Ultimately, however, the trade confrontation evolved into a prolonged phase, affecting not only the US and China but also European partners.
Today we see a continuation of this policy, where new restrictions and tariff threats have been added to the previously introduced measures. This has prompted capital outflows and increased uncertainty, as global supply chains have come under question, and the prospects for global trade recovery are murky.
Parallels with the 2008 Crisis
Comparisons to 2008 are inevitable due to the scope and speed of the drop in stock prices. However, while the primary trigger in 2008 was the collapse of the subprime mortgage market and the banking sector, the current negative factors lie in the realm of trade and geopolitical tensions.
Leading companies' financial results are declining because of rising costs for raw materials and logistics due to mutual tariffs. Global demand is weakening, and heightened instability is causing management teams to cut back on investment programs. All this is reflected in stock market indices, which continue to lose several percentage points in a single trading session.
Buffett’s Role and the Cash Accumulation Strategy
Warren Buffett, one of the largest and most conservative investors, prepared for such a scenario by amassing an unprecedented amount of cash. Buffett’s approach does not involve “catching a falling knife” at the peak of panic, but as soon as the situation stabilizes or compelling long-term opportunities arise, he will likely begin buying undervalued assets.
This strategy is typical for major players who focus on fundamental indicators. They are not looking at short-term fluctuations but rather the potential gains when the market recovers and prices return to fair value.
Cryptocurrencies: Expectations vs. Reality
Many assumed that cryptocurrencies would serve as a haven during crises. However, experience shows that in periods of global uncertainty, risk-averse investors exit digital assets alongside everything else. Bitcoin and Ethereum have lost 20–30% since the latest “flare-ups” began, and even statements about a “national bitcoin strategy” have so far failed to influence their prices.
Meanwhile, fundamental factors—limited supply, the development of blockchain technology, and IT-sector interest—have not disappeared. These arguments gain traction when investors’ risk appetite returns. But when the market is dominated by fear of further declines, they tend to avoid risky trades and prefer liquid, proven instruments.
Where the Money Goes
Unlike previous downturns, capital has not rushed into gold. While gold prices reached their peak a few weeks ago, their growth has since slowed, as some investors opt to keep their funds in cash, considered the safest choice.
Such behavior may suggest that the sell-off is nearing its climax: when capital remains “on the sidelines,” it eventually starts seeking new opportunities—whether in bargain-priced shares of large industrial giants, the tech sector, or even the cryptocurrency market with its depressed valuations. The volume of outflows from the US stock market is colossal; over the last couple of weeks, the total market cap of leading indexes has fallen by several trillion dollars. It is expected that a substantial portion of this money will re-enter the market, though likely redistributed among different asset classes.
Medium- and Long-Term Outlook
Investors with a six-month or longer horizon often see the current levels as potential entry points. Historically, global conflicts and economic crises end sooner or later, opening opportunities for those who can tolerate temporary volatility.
However, short-term trading remains extremely risky: as uncertainty persists, we may see more waves of sell-offs that knock out speculators with weak nerves or insufficient liquidity. During such moments, those who remain disciplined and steadfast can find profitable opportunities.
Conclusion
Today’s financial market conditions stem from a convergence of factors: aggressive trade policies, geopolitical risks, and the natural winding down of certain economic cycles. The mass sell-off of stocks and cryptocurrencies indicates that investors are unwilling to take on new risks until tariff disputes calm down, a clearer picture emerges for corporate profits, and major economic centers reach some form of agreement.
Nevertheless, the market retains its cyclical nature: historical parallels show that after the steepest drops, recovery periods often follow. The only question is when the turnaround will occur and who will be the first to capitalize on it.

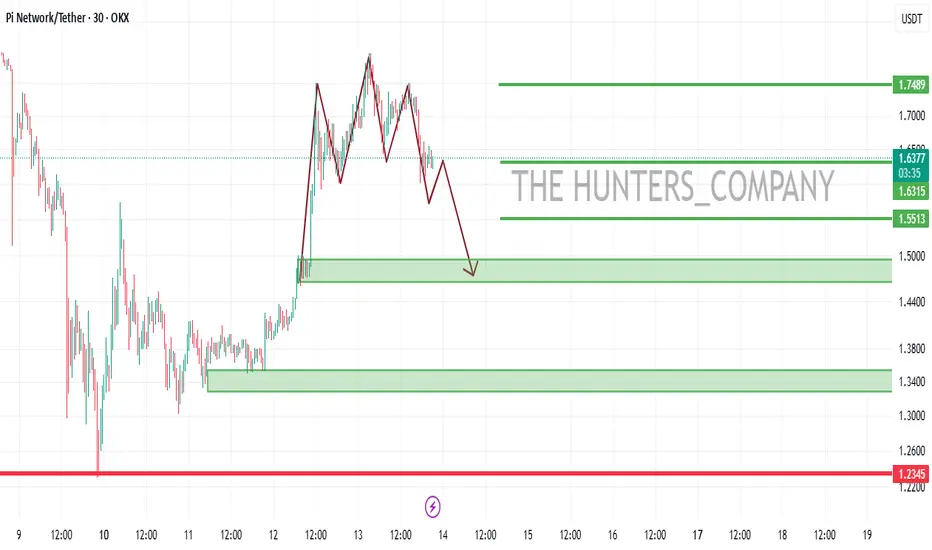
BTC Ready for a Big Move? Harmonic Pattern + Resistance BreakoutTechnical Breakdown:
#BTC is forming a harmonic pattern on the 30-minute time frame, signaling a potential bullish reversal.
Bullish divergence is developing, which strengthens the case for an upward move.
The key resistance level is acting as a barrier. A break and close above this level will confirm a bullish breakout.
Trading Plan:
🔹 Wait for bullish divergence confirmation.
🔹 Monitor the breakout of resistance.
🔹 If a candle closes above resistance, enter a long position with proper risk management.
🔹 Target levels: 93700
🔹 Stop-loss below recent lows for a safe risk-reward ratio.
What do you think? Will #BTC break out or get rejected? Drop your thoughts in the comments!
Follow for more real-time trade ideas, setups, and market insights!

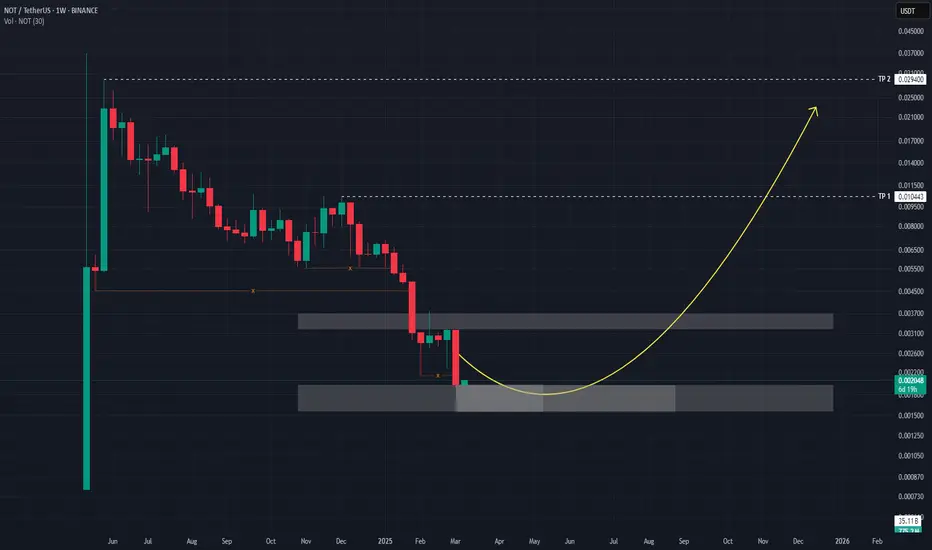
NOTUSDT Weekly Demand Zone: Potential Bullish Reversal at 0.0019This analysis focuses on Notcoin (NOTUSDT) on the Weekly timeframe , identifying a key demand zone that suggests a potential bullish reversal .
Based on chart observation, the price of NOTUSDT is approaching a critical demand zone located between 0.001971 and 0.001561 . This zone is anticipated to act as strong support, potentially marking a significant price low for the asset in the current market cycle.
The expectation is that within this demand zone , buyers will step in with sufficient volume , leading to a change in the current price trend and initiating a bullish reversal . The presence of proper volume upon entering this zone will be crucial to confirm the strength of the demand and the likelihood of a sustainable upward movement.
To illustrate the potential upside, Take Profit (TP) levels have been marked on the chart. These TP levels represent projected targets for the price following a successful bounce from the demand zone. Traders and investors should monitor price action closely as it interacts with this zone, looking for bullish confirmation signals such as:
Increased buying volume: A surge in volume as the price tests the demand zone would indicate strong buyer interest.
Bullish candlestick patterns: Formation of reversal candlestick patterns within the zone (e.g., bullish engulfing, hammer) could further validate the potential for an upward move.
In summary: This analysis suggests that the 0.001971 - 0.001561 zone presents a significant opportunity for a potential bullish reversal in NOTUSDT on the weekly timeframe. Closely monitoring price action and volume within this zone is recommended to identify potential long entry opportunities, targeting the marked Take Profit levels as the asset recovers.
NZDCAD — Sell Setup at Key Resistance ZoneOANDA:NZDCAD has reached a key resistance zone, marked by prior price rejections, suggesting strong selling interest. This area has previously acted as a key supply zone, increasing the likelihood of a bearish reversal if sellers step in.
If the price confirms resistance within this zone through bearish price action—such as wick rejections or lower timeframe weakness—we could see a move toward 0.81780, which aligns with a logical target based on recent market structure.
However, if the price breaks and holds above this resistance area, the bearish outlook may be invalidated, potentially opening the door for further upside.
Just my take on support and resistance zones—not financial advice. Always confirm your setups and trade with solid risk management.
Best of luck!

GBPUSD Approaching Key Resistance — Will It Drop to 1.27720?OANDA:GBPUSD is approaching a significant resistance zone, an area where sellers have previously stepped in to drive prices lower. This area has acted as a key supply zone, making it a level to watch for potential rejection.
If price struggles to break above and we see bearish confirmation, I anticipate a pullback toward the 1.27720 level.
However, a strong breakout and hold above resistance could invalidate the bearish outlook, potentially leading to further upside.
Just my take on support and resistance zones—not financial advice. Always confirm your setups and trade with solid risk management.
Best of luck!

BRETT/USDT- Breaks out of 3 month of trendline.
-Yesterday listed on Coinbase Futures.
Entry: 0.043-0.039
Target:100%-200%

Googles next Move where to Long next + Wickless Candles Hi in this video I highlight what to look for in the chart to take shorts and where to fill Longs next . In addition to that I provide a small educational idea of looking out for Wickless candles and how they can add value to your analysis . Please like follow share and ask any questions that you have and thankyou for your support

CHFJPY at Key Support Level - Potential Buy SetupOANDA:CHFJPY is at a significant demand zone that has consistently triggered bullish reversals in the past. This zone has previously acted as a strong support level and now as price tests this area again, it creates a potential opportunity for buyers to regain control.
I expect the price to move toward 168.60. On the other hand, a break below this support could signal further downside.
Just my take on support and resistance zones—not financial advice. Always confirm your setups and trade with solid risk management.

EURJPY Approaching Major Support – Will Buyers Step In?OANDA:EURJPY is approaching a significant support zone, highlighted by previous price reactions and strong buying interest. This area has historically acted as a key demand zone, increasing the likelihood of a bounce if buyers step in.
The current market structure suggests that if the price confirms support within this zone, we could see a bullish reversal. A successful rebound could push the pair toward the 160.000 level, a logical target based on past price behavior and structural confluence.
Just my take on support and resistance zones—not financial advice. Always confirm your setups and trade with solid risk management.
Best of luck!

NICKEL — Sell Setup at Key Resistance ZonePEPPERSTONE:NICKEL has reached a significant resistance zone, marked by prior price rejections, suggesting strong selling interest. This area has previously acted as a key supply zone, increasing the likelihood of a bearish reversal if sellers step in.
If the price confirms resistance within this zone through bearish price action—such as wick rejections or lower timeframe weakness—we could see a move toward 15,804, which aligns with a logical target based on recent market structure.
However, if the price breaks and holds above this resistance area, the bearish outlook may be invalidated, potentially opening the door for further upside.
Just my take on support and resistance zones—not financial advice. Always confirm your setups and trade with solid risk management.
Best of luck!

OM/USDT : Do you know what is going to happen?hello guys
As you can see, this currency has strong spikes...
Now, according to the latest spike, we have identified good support ranges for you to buy step by step and move with it until the specified goals, of course, with capital management...
*Trade safely with us*

AUDCAD — Sell Setup at Key Resistance LevelOANDA:AUDCAD has reached a key resistance zone, highlighted by strong selling interest. This area has historically acted as a supply zone, increasing the likelihood of a bearish reversal if sellers step in.
The current price action suggests that if the pair confirms resistance through signals like bearish engulfing candles, long upper wicks, or increased selling volume, we could see a downward move toward 0.90250 — a logical target based on previous price behavior and market structure.
However, if the price breaks above this zone and sustains, the bearish outlook may be invalidated, opening the door for further upside.
Just my take on support and resistance zones—not financial advice. Always confirm your setups and trade with solid risk management.
Best of luck!

FIL BUYHI friends
According to the pullback we had, we can enter into the transaction with risk and capital management.
*Trade safely with us*

EURJPY - Bullish Continuation Toward 160.850OANDA:EURJPY is trading within a well-defined ascending channel, with price action respecting both the upper and lower boundaries. The recent bounce off support suggests buyers are maintaining control, supporting a potential continuation of the uptrend.
As long as the price remains above the support level and the channel's lower boundary holds, the bullish structure remains intact.
A potential upside target is 160.850, aligning with the upper boundary of the channel. A break and close above this level could signal further bullish momentum.
However, a breakdown below the support zone would invalidate the bullish scenario and may open the door for a deeper pullback.
Remember, always confirm your setups and trade with solid risk management.
Best of luck!

USDCHF - Sell Setup at Key Supply ZoneOANDA:USDCHF has reached a key supply zone, highlighted by strong selling interest. This area has historically acted as a resistance level, increasing the likelihood of a bearish reversal if sellers step in.
The current market structure suggests that if the price confirms resistance within this zone, we could see further downside movement. A successful rejection could push the pair toward 0.89940, a logical target based on prior price behavior and the current structure.
However, if the price breaks and holds above this resistance, the bearish outlook may be invalidated, potentially leading to further upside.
Just my take on support and resistance zones—not financial advice. Always confirm your setups and trade with solid risk management.
Best of luck!

XRP Breakout Setup – Perfect Harmonic Pattern#XRP is setting up for a massive move!
✅ Harmonic Pattern in Play – Harmonic pattern is forming, signaling a potential reversal.
✅ Bullish Divergence – RSI/MACD is showing strength, indicating momentum shift.
✅ Key Resistance Level – A breakout above could trigger a strong rally.
Trading Plan:
Wait for a confirmed break and retest of the resistance.
Enter a long trade with stop-loss at 2.31 and target 2.6 to 2.7.
Risk Management: Using a 1:2 or higher risk-reward ratio.
Will #XRP break out or fake out? Drop your thoughts below!

ADA Bullish Breakout Incoming? Key Levels to Watch! Overview:
#ADA has been following a perfect harmonic pattern and has now completed it. On the 1-hour timeframe, a bullish divergence has formed, signaling potential upward momentum. But is it time to go long? Let's break it down.
Key Confirmation:
🔹 Harmonic pattern completion
🔹 Bullish divergence on 1H timeframe
🔹 Price respecting key support levels
🔹 The final confirmation? A break and close above resistance!
Trading Plan:
🔹 Entry: Wait for a 1-hour candle to close above resistance
🔹 Targets: TP-1: 0.78 and TP-2: 0.8250
🔹 Stop-Loss: Below recent swing low for proper risk management
What’s Your Take?
Do you think #ADA will break out or face rejection? Share your thoughts in the comments! Let’s discuss and trade smartly.
Follow for more trade ideas!

EURCAD Approaching Major Resistance — Potential Sell OpportunityOANDA:EURCAD is approaching a significant resistance zone, a level where sellers have consistently stepped in, leading to notable bearish reversals in the past. This area is marked by strong selling interest and historical price reactions, increasing the likelihood of bearish move if sellers regain control.
The current price action suggests that if the pair confirms resistance through signals like bearish engulfing candles, long upper wicks, or increased selling volume, we could see a downward move toward 1.49830 — a logical target based on previous price behavior and market structure.
However, if the price breaks above this zone and sustains, the bearish outlook may be invalidated, opening the door for further upside.
Just my take on support and resistance zones—not financial advice. Always confirm your setups and trade with solid risk management.
Best of luck!

NICKEL - Sell Setup at Key Resistance LevelPEPPERSTONE:NICKEL has reached a significant resistance zone, highlighted by previous price reactions and strong selling interest. This area has historically acted as a key supply zone, increasing the likelihood of a bearish reversal if sellers regain control.
The current market structure suggests that if the price confirms resistance within this zone, we could see a bearish move. A successful rejection could drive the price toward 15.6220, a logical target based on previous price behavior and the current market structure. However, if the price breaks above this zone, the bearish outlook may be invalidated, opening the door for further upside.
Just my take on support and resistance zones—not financial advice. Always confirm your setups and trade with solid risk management.
Best of luck!

MARA Holdings Options Ahead of Earnings If you haven`t bought the dip on MARA:
Now analyzing the options chain and the chart patterns of MARA Holdings prior to the earnings report this week,
I would consider purchasing the 13usd strike price Calls with
an expiration date of 2025-6-20,
for a premium of approximately $2.37.
If these options prove to be profitable prior to the earnings release, I would sell at least half of them.
