BTC Ready for a Major Move! (30m Chart Analysis) Chart Setup:
#BTC is forming a Head & Shoulders pattern on the 30-minute timeframe, signaling a potential bullish breakout. Additionally, a bullish divergence has appeared, strengthening the case for an upward move.
Key Levels to Watch:
🔹 Neckline Breakout: A confirmed breakout above the neckline could trigger a strong long opportunity.
🔹 Support Zone: If #BTC retests and holds the support level, it may provide a better risk-reward entry.
🔹 Invalidation: A breakdown below key support could shift the bias.
Trading Plan:
🔹 Wait for a clean neckline breakout with volume confirmation.
🔹 Set a stop-loss below recent support.
🔹 Target key resistance zones for profit-taking.
What’s Your Take?
Will #BTC break out or get rejected? Drop your thoughts in the comments!
Follow for More Trade Ideas & Market Updates!
Buysellsignal

GBPAUD - Short Setup at Key Resistance LevelOANDA:GBPAUD is approaching a major resistance zone, an area where sellers have consistently stepped in, leading to notable reversals in the past. This level is marked by strong selling interest and historical price reactions, increasing the likelihood of a bearish move if sellers regain control.
The current price action suggests that if the pair confirms resistance through bearish engulfing candles, long upper wicks, or increased selling volume, we could see a downward move toward the 1.99200 level. However, if the price breaks above this zone, the bearish outlook could be invalidated, opening the door for further upside.
Just my take on support and resistance zones—not financial advice. Always confirm your setups and trade with solid risk management.
Best of luck!

AUDJPY at Key Support Level – Potential Rebound to 95.900OANDA:AUDJPY has reached a significant demand zone, where past price action shows strong buying interest. This area has historically acted as a key support, increasing the likelihood of a bullish reaction if buyers re-enter the market.
If the support holds, a bullish reversal could push the pair toward 95.900, a logical target based on previous price behavior and market structure. Confirmation signals to watch for include bullish engulfing candles, long lower wicks, or increased buying volume, which would strengthen the case for an upside move.
However, if the price breaches this zone and sustains below it, the bullish outlook may be invalidated, increasing the likelihood of further downside. Monitoring candlestick patterns and volume at this critical level is crucial for identifying potential trade opportunities.
Just my take on support and resistance zones—not financial advice. Always confirm your setups and trade with solid risk management.
Best of luck!

SOLUSDT: Preparing for a Breakout? Key Levels to Watch!Current Trend: #SOL is in a downtrend but is now testing a strong support zone, indicating a potential reversal.
Technical Outlook:
🔹 Support Zone: $158(Strong demand area)
🔹 Resistance Level: $175 (Breakout confirmation level)
🔹 4H Timeframe Analysis: #SOL is currently making a correction, and a breakout above the resistance level could trigger a strong bullish move.
Trading Plan:
🔹 Bullish Scenario: If #SOL breaks above the resistance, it could push toward new higher highs, targeting $270 and beyond.
🔹 Bearish Scenario: If it fails to break resistance, we may see another pullback to retest lower levels.
Key Insights:
🔹 #SOL remains a strong project with the potential to break its ATH in the long run.
🔹 Waiting for a clean breakout ensures we enter with proper risk management.
What’s Your View? Drop your thoughts in the comments!
🔹 Follow for More: Daily insights, trade setups, and market updates!

XRP at Critical Level – Major Move Incoming! Bullish OR BearishCurrent Market Structure:
#XRP is in a downtrend and has recently broken a key support level, signaling potential further downside. However, a Bullish Harmonic Pattern is forming on the 4H timeframe, which could indicate a possible trend reversal.
Key Technical to Watch:
🔹 Bearish Scenario: If #XRP continues to reject resistance and fails to reclaim lost support, the bearish trend may continue toward the next key levels.
🔹 Bullish Scenario: A bullish divergence on the 1H or 4H timeframe could trigger an upward move, forming new higher highs (HHs) and higher lows (HLs).
Trade Setup:
🔹 Short Position: If price stays below resistance & rejection continues.
🔹 Long Position: If bullish divergence confirms & price reclaims lost levels.
Big Move Expected – Watch Closely!
What’s Your Bias? Bullish or Bearish? Comment Below!
#XRP #Crypto #Trading #HarmonicPattern #TechnicalAnalysis #CryptoTrading

AUDNZD: Potential Buy Opportunity at Key Support LevelOANDA:AUDNZD is approaching a significant support zone. This zone has consistently acted as a key area of interest where buyers regained control, leading to notable reversals in the past. The current moves suggests the potential for a bullish reaction if price action confirms rejection through signals such as bullish engulfing candles, long lower wicks, or increased buying volume.
If the support holds, I anticipate a move upward toward the 1.10860 level, aligning with the expectation of a short-term reversal. However, if the price breaches this zone and sustains below it, the bullish outlook may be invalidated and we could potentially see a bigger downside.
Monitoring candlestick patterns and volume at this critical zone is essential for identifying buying opportunities. Proper risk management is advised to navigate potential volatility. If you have any thoughts on this setup or additional insights, drop them in the comments!

XRP Bullish Setup – AB=CD Pattern on 1H Timeframe!#XRP is in a strong uptrend, showing no bearish signs, and currently forming a classic AB=CD pattern on the 1-hour timeframe. This pattern is a well-known harmonic structure that often leads to a continuation of the trend!
Key Technical Insights:
🔹 AB=CD Pattern Completion: Price is approaching the 0.618 Fibonacci retracement zone.
🔹 No Bearish Signs: Momentum remains bullish, with increasing volume.
🔹 Confluence Support: The 0.618 FIB level aligns with previous demand zones, increasing the probability of a bounce.
Trading Plan:
Entry: Around the 0.618 FIB level, Price is 2.65
🔹 Targets: TP at 2.88
🔹 Stop-Loss: Below structure 0.5 FIB level, Price is 2.6
What do you think? Will #XRP respect the AB=CD pattern and continue higher? Drop your thoughts in the comments!
Like & Follow for more high-probability trade setups!

LTC BUYhello guys
Considering the good growth of the price and after its correction, now is a good opportunity to enter into a transaction with capital management.
We have specified a target for you.
*Trade safely with us*

APT BUYHello guys
Considering the price structure and making the floor, we expect the price to move according to its cycle until the specified targets.
So we can enter into a transaction with capital management
*Trade safely with us*

ETH Breakout Incoming? Bullish Trend Confirmation! Market Update:
CRYPTOCAP:ETH has been consolidating in an accumulation phase after a strong bearish trend on the 4-hour timeframe. This phase often indicates that smart money is positioning for the next big move!
Key Levels to Watch:
🔹 Resistance Level: 2920
🔹 Support Level: 2500
Bullish Confirmation Strategy:
🔹 Breakout of the accumulation phase
🔹 Break of the resistance level
🔹 A 4H candle closure above resistance
Trade Setup:
Once these confirmations are in place, we can anticipate a strong bullish rally. I'll be looking for long entries with proper risk management and a favorable risk-to-reward ratio.
What’s Your Take?
Will #ETH break out, or will bears take control again? Drop your thoughts in the comments!
#ETH #Crypto #Trading #Breakout #CryptoTrading

SPX500 : Important support for purchaseshello friends
Considering the drop we had, now we can buy step by step on the specified supports in the low time with risk and capital management...
*Trade safely with us*

ONE Potential 84x Surge? (If Bull Comes)BINANCE:ONEUSDT seems to be retesting and holding above the upper trendline of a multi-year triangle breakout.
This makes it a potential long entry point.
It has also formed a two-year-long ascending channel since 2023.
🔥 Long Targets:
$0.229 (~15x from current price) –
This is the measured move of the ascending channel. The price also meet a strong resistance zone from previous highs, making it pretty good sense.
$1.237 (~84x from current price) – This is the full breakout target of the triangle, though it seems unlikely to be reached; However, this 84x was how high it surged last time.
If a bull run happens, a reasonable strategy would be to sell 50%-80% of the holdings at $0.229, keeping a small portion as "free ride" profit in case it extends to $1.237.
Some skeptics may think an 84x move is ridiculous, but keep in mind, although the altcoin season hasn’t even started yet, BINANCE:OMUSDT has already surged over 300x since last year.
If you think many things impossible, you’ll never make the big gains.
🔥 The key is to think big but execute strictly:
✅ Always set a stop-loss with buying order.
✅ Take profits at targets without hesitation.
This is how you maximize gains in crypto bull runs and protect capital in crashes.
-------
🔥 Short Target:
$0.00296 (~-79% from current price) – This is the measured move of the ascending channel breakdown.
A short entry should only be considered after a confirmed break below the channel.
🔴 Read my signature & publications for more info you don’t want to miss.
🔥 for more future "guesses" like this!

#3090 #Tabuk CementBased on the pattern identified on the weekly chart, a bullish flag pattern is currently forming. This suggests a continuation of the previous upward trend. Given the characteristics of the pattern, we can plan entries on a medium to long-term timeframe by closely monitoring the identified levels on the chart. Entries only a breakout.
"Non financial advice, do your own research"

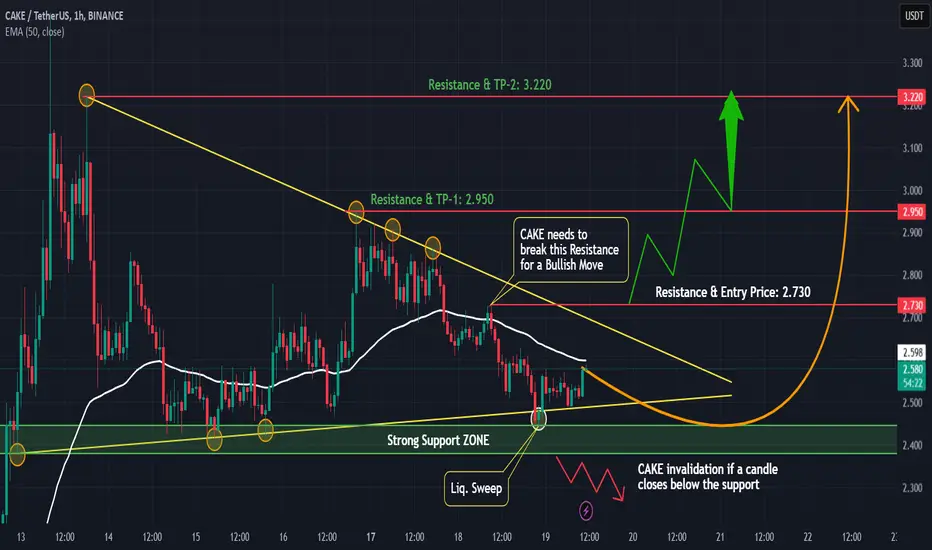
#CAKEUSDT: Triangle Breakout – Next Move?Market Overview:
#CAKEUSDT has been in a strong uptrend and recently formed a triangle pattern on the 1-hour timeframe. This pattern typically signals trend continuation, and we just witnessed a breakout!
Key Observations:
🔹 Triangle breakout confirmed – bullish signal!
🔹 Resistance Level: Watch for a clean break for further confirmation.
🔹 Potential Targets (TPs): Higher highs expected if momentum holds.
Strategy:
🔹 If price retests the breakout zone and holds, we could see a strong bullish continuation.
🔹 Invalidation: If price falls back into the pattern, we may see a fakeout scenario.
What’s your take? Will #LDOUSDT pump higher or is this a bull trap? Share your thoughts below!
Follow for more chart updates, trade ideas, and market insights!
OXY Occidental Petroleum Corporation Options Ahead of EarningsAnalyzing the options chain and the chart patterns of OXY Occidental Petroleum Corporation prior to the earnings report this week,
I would consider purchasing the 50usd strike price Calls with
an expiration date of 2025-4-17,
for a premium of approximately $1.56.
If these options prove to be profitable prior to the earnings release, I would sell at least half of them.

DEVIATON INJIt looks like we have a deviation below the demand zone and the $13.8 support, which could present a buying opportunity.
I’m waiting to see if the price finds support around $14.4.
If the price drops below $14 and stays there for an extended period, I’ll reassess the trade, as we could see another leg down toward the $8-$11 zone, where stronger support is likely.
For now, the weekly oscillators look decent—Stoch RSI is close to a bullish cross, and RSI has found support at 40.

Should we buy bitcoin or not?hello friends
Due to the growth we had, we entered a downward channel. Now all we can do is wait...
We have obtained important supports for you to buy and we have identified the targets as well...
*Trade safely with us*

Ethereum Holds Strong – $4K Target in Sight?#Ethereum has bounced off its long-term trendline support for the third time, maintaining a strong bullish structure.
Upcoming Resistance is at $2,900 and $3,250, with $4,000 as the next major target.
A sustained move above $2,900 could push ETH toward $3,250.
A breakout above $3,250 would confirm further upside. Losing trendline support may invalidate this setup.
DYOR, NFA

SUI BUYhello friends
Due to the failure of the downward structure, we can enter into the transaction with capital management.
*Trade safely with us*

GBPAUD Approaching Support: Will Price Rebound to 1.9890?OANDA:GBPAUD is approaching a key support zone. Previously, this area has acted as strong demand, leading to significant bullish reversals. The ongoing bearish momentum suggests sellers are driving the price toward this level, where buyers may step in.
A bullish confirmation, such as a strong rejection pattern, bullish engulfing candles, or long lower wicks, would increase the probability of a rebound. If buyers regain control, the price could move toward the 1.98900 level. However, a breakdown below this zone could invalidate the bullish outlook, opening the door for further downside.
This is not financial advice but rather how I approach support/resistance zones. Remember, always wait for confirmation, like a rejection candle or volume spike before jumping in.
Please boost this post, every like and comment drives me to bring you more ideas! I’d love to hear your perspective in the comments.
Best of luck , TrendDiva

Trading opportunity for NEARUSDTBased on technical factors there is a Buy position in :
📊 NEARUSDT
🔵 Buy Now
🪫Stop loss 3.000
🔋Target 4.000
📏 R/R 1,8
💸RISK : 1%
We hope it is profitable for you ❤️
Please support our activity with your likes👍 and comments📝

thrd stock analysis in the next dayswe will see the stock with strong buying signals in the next few days

CELO LONGCelo has bounced every time it touched the lower range around $0.40, usually reaching at least $0.25.However, given the current market conditions, I expect either more downside or a sideways movement in the next few days.
The Stoch RSI is gearing up for a bullish cross on the weekly, but historically, the first cross is often followed by a negative one, before a second bullish cross that truly pushes the price higher. So while we might see some short-term upside, we should also be prepared for lower prices before a more significant rally kicks in.
