AAPL Poised for Continued GrowthIf you haven`t bought AAPL before the rally:
What to consider now:
1. AI-Driven iPhone Upgrade CycleApple’s integration of Apple Intelligence, its proprietary AI platform, is set to catalyze a significant iPhone replacement cycle. Posts on X highlight positive sentiment around AI-driven demand, with estimates suggesting a 40% year-over-year surge in iPhone shipments in China during May 2024, signaling strong consumer interest. New AI features, such as on-device processing for enhanced privacy and functionality, are expected to drive accelerated hardware upgrades. Analysts, including Bernstein, project these features could boost upgrade rates, with even a 1% increase in upgrades driving meaningful revenue growth. With the iPhone 15 and future iterations leveraging AI, Apple is likely to capture pent-up demand, as noted by industry observers who see long-term revenue growth from its 7% year-over-year increase in active installed base.
2. Strong Ecosystem and Services GrowthApple’s ecosystem—spanning iPhones, iPads, Macs, and wearables—continues to drive customer loyalty and recurring revenue. The company reported record services growth in Q2 2025, with revenue reaching $95.4 billion, up 5% year-over-year. Services like Apple Music, iCloud, and Apple TV+ benefit from the growing active device base, which ensures sticky, high-margin revenue streams. This ecosystem strength mitigates concerns about short-term iPhone sales fluctuations, as Apple captures upgrade revenue over time. The seamless integration of hardware and services creates a moat that competitors struggle to replicate, reinforcing AAPL’s long-term growth potential.
3. Technical Bullish MomentumFrom a technical perspective, AAPL exhibits strong bullish patterns across multiple timeframes. TradingView analyses point to a rising bullish channel, with higher highs and higher lows signaling sustained upward momentum. Key bullish patterns, such as an ascending wedge and triangle, are forming around current price levels, suggesting potential breakouts. For instance, if AAPL clears $203.21 with volume, it could target $204.98 or higher, with some analyses eyeing $240 as a near-term resistance. Technical indicators like a rising RSI and MACD convergence further support short-term bullish momentum. Despite recent consolidation, reduced volatility and a strong setup pattern indicate AAPL is primed for a breakout.
4. Analyst Optimism and Market SentimentAnalyst sentiment remains overwhelmingly positive, with a consensus “Buy” rating and a 12-month price target of $228.85, implying a 14.05% upside from the current price of $200.66 as of June 2025. Hedge funds like Third Point see “significant” upside, driven by AI features that could meaningfully boost earnings. Bernstein’s raised price target to $240 reflects confidence in Apple’s ability to monetize AI through hardware and services. Posts on X also highlight investor optimism, with AAPL’s $350 billion market cap increase in a single day underscoring strong market confidence in its AI-driven growth chapter.
5. Global Expansion and Emerging MarketsApple’s growth in emerging markets, particularly India and China, bolsters its bullish case. Improved guidance for December 2023, driven by iPhone 15 adoption and India’s market potential, signals untapped opportunities. Apple’s ability to penetrate these high-growth regions, combined with its premium brand appeal, positions it to capture a larger share of global smartphone and tech markets.
Disclosure: I am part of Trade Nation's Influencer program and receive a monthly fee for using their TradingView charts in my analysis.
Buysellsignal

Gold price short term recovery 3366⭐️GOLDEN INFORMATION:
Kansas City Federal Reserve President Jeff Schmid stated on Wednesday that the central bank has sufficient time to assess the impact of tariffs on inflation before making any decisions regarding interest rates. His remarks suggest a cautious approach and align with Fed Chair Jerome Powell’s comments from the previous day.
Chair Powell reaffirmed the view that there is no urgency to alter monetary policy, emphasizing a patient, data-driven approach as the Fed monitors economic developments. This less dovish tone from Fed leadership may help cap downside pressure on gold in the near term.
Meanwhile, money markets are fully pricing in two rate cuts by the end of 2025, with a September move seen as more probable than one in July—although expectations for a July cut have slightly increased since last week.
⭐️Personal comments NOVA:
Gold price recovered and continued to accumulate, pay attention to the GAP 3366 area at the beginning of the week, selling pressure is still maintained.
⭐️SET UP GOLD PRICE:
🔥SELL GOLD zone: 3366- 3368 SL 3373
TP1: $3358
TP2: $3345
TP3: $3330
🔥BUY GOLD zone: $3303-$3301 SL $3296
TP1: $3315
TP2: $3328
TP3: $3340
⭐️Technical analysis:
Based on technical indicators EMA 34, EMA89 and support resistance areas to set up a reasonable BUY order.
⭐️NOTE:
Note: Nova wishes traders to manage their capital well
- take the number of lots that match your capital
- Takeprofit equal to 4-6% of capital account
- Stoplose equal to 2-3% of capital account

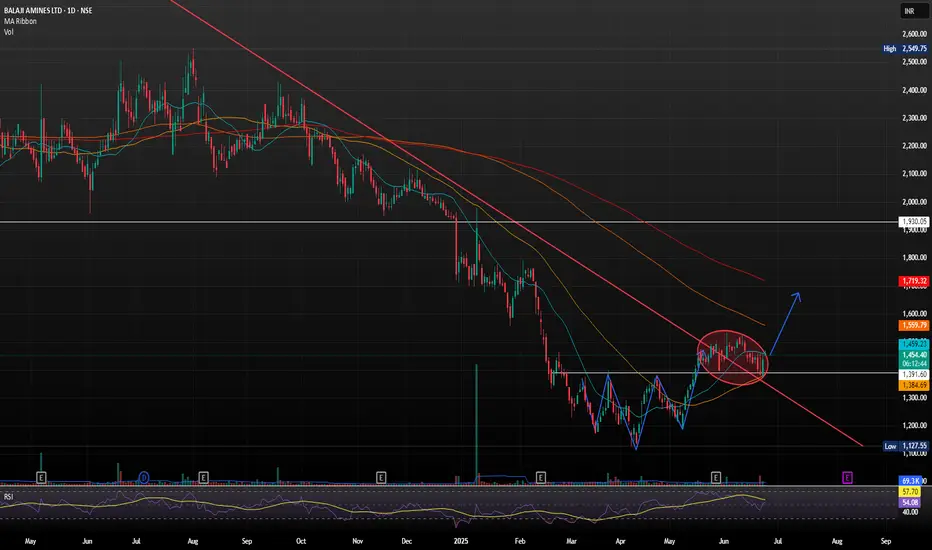
BALAJI AMINES PURE REVERSAL ON CHART.Balaji Amines Ltd. is a leading Indian chemical manufacturing company, primarily engaged in the production of methylamines, ethylamines, and their derivatives, along with specialty chemicals and pharma excipients. It holds a strong position in the aliphatic amines segment and is even the sole producer of certain specialty chemicals in India.
INVERSE HEAD & SHOULDER BREAKOUT AND CONSOLIDATION AT PULLBACKS SHOWS STRONG MOMENTUM FOR UPWARDS
A breakout above 1486 could trigger momentum toward 1524 and beyond towards 1775-1906
On the downside, keep an eye on support near 1330–1358.
#Ethereum Update!!CRYPTOCAP:ETH has broken below the $2,308 resistance zone and is now trading lower.
Price is approaching a key demand area around $2,132–$2,000, where we’ve seen strong buyer reactions in the past.
IMO, if bulls step up and defend this zone, we could see a recovery bounce aiming for $2,526, the next major resistance ahead.
I’ll keep you updated as things develop.
If you find my updates helpful, don’t forget to like and follow for more! DYOR, NFA

Middle East War - Gold Price Increases✍️ NOVA hello everyone, Let's comment on gold price next week from 06/23/2025 - 06/27/2025
⭐️GOLDEN INFORMATION:
Gold prices held steady on Friday, hovering near $3,369 and on track to post a weekly loss of nearly 1.90%, as markets digested US President Donald Trump’s decision to forgo immediate military action against Iran in favor of a diplomatic approach. At the time of writing, XAU/USD is down 0.11%.
While easing geopolitical tensions helped lift risk sentiment, additional pressure on gold emerged from concerns over potential US restrictions on allies operating semiconductor plants in China, as reported by Bloomberg. Trump's restraint on Iran encouraged a risk-on tone, weighing on the appeal of the safe-haven metal.
⭐️Personal comments NOVA:
Middle East tensions escalate, gold prices continue to recover above 3400, early next week
🔥 Technically:
Based on the resistance and support areas of the gold price according to the H4 frame, NOVA identifies the important key areas as follows:
Resistance: $3395, $3448
Support: $3302, $3256
🔥 NOTE:
Note: Nova wishes traders to manage their capital well
- take the number of lots that match your capital
- Takeprofit equal to 4-6% of capital account
- Stoplose equal to 2-3% of capital account
- The winner is the one who sticks with the market the longest

Trump:New update(don't miss it)hello friends👋
This time we came with the analysis of Trump's famous coin meme, which you requested a lot.
Well, as you can see, by making a double floor, the price has broken its downward channel and has grown well.
After the price growth, we saw the price suffering and then the price correction, which caused the formation of an upward pattern.
Now, according to the successful formation of this ascending pattern, it should be seen whether the buyers support the price in the specified support areas or not...
Pay attention that our trend is upward and the pattern made also shows an upward trend, that's why we have identified the support areas for you to enter the transaction step by step with risk and capital management.
🔥Follow us for more signals🔥
*Trade safely with us*

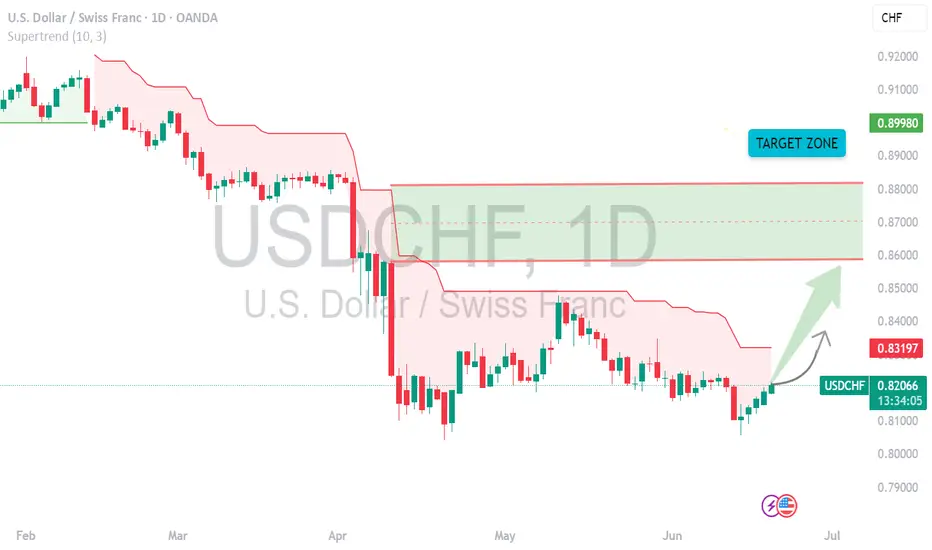
USDCHF daily Cls model 1 Target sl setUSDCHF Trade Setup Alert 🚨
Entry Confirmed ✅ | Target Locked In 🎯 | SL in Place for Risk Control 🛡️
We’ve set our eyes on the next move for USDCHF – trade smart, not emotional.
🔹 Target: [86034
🔹 Stop Loss: 80030
Watch the price action closely — let the strategy play out! 📊📈
#USDCHF #ForexSignals #TradingSetup #RiskManagement #TradingView
Accumulate around 3400, Keep interest rate today⭐️GOLDEN INFORMATION:
Gold prices slipped below the $3,400 threshold on Tuesday, weighed down by renewed strength in the US Dollar (USD), despite a worsening global risk sentiment. The resilience of the greenback limited gains in the safe-haven asset, though mounting tensions between Israel and Iran continue to offer underlying support. At the time of writing, XAU/USD is trading at $3,380, down 0.05%.
Although risk appetite remains subdued, gold has struggled to rally, as the US Dollar regains ground. The US Dollar Index (DXY), which measures the currency against a basket of six major peers, climbed 0.46% to 98.58.
Meanwhile, geopolitical tensions intensified after US President Donald Trump abruptly departed the G7 summit in Canada on Monday in response to unfolding events in the Middle East. In a stark warning posted to his social platform, he urged, “Everyone should immediately evacuate Tehran,” signaling a sharp escalation in the conflict that began last Friday.
⭐️Personal comments NOVA:
Gold price is moving in accumulation zone below 3400 - 3365. Break and return above 3400, continue to accumulate.
⭐️SET UP GOLD PRICE:
🔥SELL GOLD zone: 3437- 3439 SL 3444
TP1: $3425
TP2: $3410
TP3: $3395
🔥BUY GOLD zone: $3338-$3340 SL $3333
TP1: $3346
TP2: $3355
TP3: $3370
⭐️Technical analysis:
Based on technical indicators EMA 34, EMA89 and support resistance areas to set up a reasonable BUY order.
⭐️NOTE:
Note: Nova wishes traders to manage their capital well
- take the number of lots that match your capital
- Takeprofit equal to 4-6% of capital account
- Stoplose equal to 2-3% of capital account

Brent OilGiven the conflicts in the Middle East, I think oil could reach $90. I hope that doesn't happen. What do you think? This is my analysis of oil. I think the upward trend will continue.

BTC/USDTHello friends, I hope you are doing well. This analysis came to my mind for Bitcoin. On the 4-hour time frame, if Bitcoin crosses the areas I specified, it will move towards its targets. It could be bullish because gold and oil were bearish yesterday. What do you think, friend?

Accumulate, BTC back above 110K💎 BTC PLAN UPDATE (June 16)
NOTABLE BITCOIN (BTC) NEWS:
Bitcoin (BTC), Ethereum (ETH), and Ripple (XRP) are showing signs of stabilization around key support levels following last week’s correction. BTC is attempting to regain momentum after closing below a critical support zone, while ETH and XRP are hovering near technical thresholds that could determine their next directional move.
TECHNICAL ANALYSIS OUTLOOK:
Bitcoin could decline further if it closes below the 50-day EMA
Bitcoin closed below its daily support at $106,406 on Thursday, then bounced back after retesting the 50-day Exponential Moving Average (EMA) at $102,893 on Friday. BTC has since stabilized around the $105,000 level over the weekend. As of Monday, it continues to consolidate, trading near $105,788.
If BTC fails to close above the $106,406 resistance level and heads lower, it may extend its decline toward the psychologically significant $100,000 level.
The Relative Strength Index (RSI) on the daily chart is hovering around the neutral 50 mark, signaling indecision among traders. Meanwhile, the Moving Average Convergence Divergence (MACD) indicator shows a bearish crossover on the daily chart, indicating selling pressure and a possible downtrend continuation.
At this stage, whether you're new or experienced, it's wise to spend more time practicing, deepening your technical analysis knowledge, and exploring educational content shared on the channel. Strengthening your foundation will help you protect your capital in this volatile environment.
==> This analysis is for trend reference only. Wishing all investors successful trades!

ETH/USDTWe have talked about Ethereum many times and said that the main goal of Ethereum is 3000. Ethereum has had an upward movement and is now in a channel. The last movement it had led to a failure and it went back inside. I think Ethereum is bullish. Comment your opinion.

WOOF Petco Health & Wellness Company Potential Bullish ReversalIf you haven`t sold WOOF before this major retracement:
WOOF Petco Health and Wellness Company has experienced a notable selloff recently, with its stock price declining to around $2.47 as of mid-June 2025. However, several fundamental and technical factors suggest that WOOF could be poised for a meaningful reversal and upside recovery in the near to medium term.
1. Attractive Valuation and Upside Potential
Despite the recent pullback, Petco’s stock is trading at a compelling valuation relative to its long-term growth potential.
Price forecasts for 2025 indicate an average target of approximately $3.55, representing a 43.7% upside from current levels.
More optimistic scenarios project highs up to $7.05 within this year, suggesting significant room for a rebound if market sentiment improves.
Long-term forecasts are even more bullish, with price targets of $14 by 2030 and as high as $77 by 2040, reflecting confidence in Petco’s strong market position and growth prospects.
2. Resilient Business Model in a Growing Pet Care Market
Petco operates in the resilient pet care and wellness industry, which benefits from secular trends such as increased pet ownership, premiumization of pet products, and growing consumer spending on pet health.
The company’s omni-channel approach—combining e-commerce with physical stores and veterinary services—positions it well to capture multiple revenue streams.
Petco’s focus on health and wellness services, including veterinary care and pet insurance, provides higher-margin growth opportunities that can drive profitability improvements.
3. Technical Signs of Stabilization and Potential Reversal
After the recent selloff, WOOF’s stock price has found some support near the $2.40–$2.50 level, with increased trading volumes indicating growing investor interest.
The stock’s recent modest gains and stabilization suggest that selling pressure may be easing, setting the stage for a potential technical rebound.
Options market activity and analyst upgrades reflect improving sentiment.
4. Improving Operational Execution and Financial Health
Petco has been investing in expanding its veterinary services and digital capabilities, which are expected to contribute to revenue growth and margin expansion.
The company’s recent earnings calls and financial reports highlight progress in cost management and customer engagement initiatives.
Strong cash flow generation and manageable debt levels provide flexibility to invest in growth and weather macroeconomic uncertainties.
5. Market Sentiment and Analyst Support
While some analysts remain cautious, the overall sentiment is shifting toward a more constructive outlook, with several price target upgrades and “hold” to “buy” rating adjustments.
The combination of attractive valuation, improving fundamentals, and sector tailwinds is likely to attract renewed institutional interest.

Fomo is bullish, gold could hit 3480⭐️GOLDEN INFORMATION:
Gold prices extended their rally for a second consecutive session on the back of weaker-than-expected inflation and labor market data in the United States (US), with XAU/USD climbing to $3,386—just below the key $3,400 threshold—amid mounting geopolitical tensions in the Middle East.
The overall market sentiment remains buoyant, fueled by consecutive soft US inflation prints that have amplified pressure on the Federal Reserve (Fed) to begin easing monetary policy. Meanwhile, signs of fragility in the labor market persist, as jobless claims exceeded 240,000 for the second week in a row, underscoring concerns about the broader economic outlook and lending further support to the safe-haven appeal of gold.
⭐️Personal comments NOVA:
War, a factor that helps gold prices grow, towards 3480
⭐️SET UP GOLD PRICE:
🔥SELL GOLD zone: 3478- 3480 SL 3485
TP1: $3462
TP2: $3450
TP3: $3435
🔥BUY GOLD zone: $3375-$3377 SL $3370
TP1: $3389
TP2: $3400
TP3: $3412
⭐️Technical analysis:
Based on technical indicators EMA 34, EMA89 and support resistance areas to set up a reasonable BUY order.
⭐️NOTE:
Note: Nova wishes traders to manage their capital well
- take the number of lots that match your capital
- Takeprofit equal to 4-6% of capital account
- Stoplose equal to 2-3% of capital account

Stay liquid my friend $HYPEI am going to enjoy GETTEX:HYPE , it is very liquid, a great mover. Price discovery will be amazing when it comes. But right now we are in the accumulation phase
With a nice WXY #elliotwavepattern

BEST XAUUSD M30 BUY SETUP FOR TODAYGold (XAU/USD) is showcasing strong bullish momentum after breaking above the key resistance zone near $3,404, now acting as fresh support. 🔄 The price formed a bullish structure with clean higher highs and higher lows on the 30-minute chart, confirming buying strength. 🟣 The marked demand zone around $3,392–$3,404 is critical—if price retests and holds this level, we can expect a continuation toward $3,420 and beyond. 🚀📌 Traders should watch for bullish confirmations on pullbacks to this zone for potential long setups. 🧠⚡

Can gold price maintain the uptrend above 3400?⭐️GOLDEN INFORMATION:
Gold prices advanced by approximately 0.97% on Wednesday, buoyed by signs of easing inflation in the United States (US), which reinforced expectations that the Federal Reserve (Fed) could resume rate cuts as early as September. At the time of writing, XAU/USD is trading around $3,363.
The May Consumer Price Index (CPI) report shows a slowdown in price pressures compared to April, prompting a surge in demand for the yellow metal. In response, gold briefly rallied to an intraday high near $3,360 before paring back some of those gains, as investors recalibrated their outlook on the Fed’s policy path.
⭐️Personal comments NOVA:
Middle East concerns, along with information about influential high tariffs on countries without trade agreements. Gold prices have recovered, but there is no long-term stability.
⭐️SET UP GOLD PRICE:
🔥SELL GOLD zone: 3428- 3430 SL 3435
TP1: $3410
TP2: $3395
TP3: $3382
🔥BUY GOLD zone: $3345-$3343 SL $3338
TP1: $3355
TP2: $3367
TP3: $3380
⭐️Technical analysis:
Based on technical indicators EMA 34, EMA89 and support resistance areas to set up a reasonable BUY order.
⭐️NOTE:
Note: Nova wishes traders to manage their capital well
- take the number of lots that match your capital
- Takeprofit equal to 4-6% of capital account
- Stoplose equal to 2-3% of capital account

Pending Gap On Weekly Timefram, Buy Or Sell ? #defense #bdlIn this chart bdl is is going to fill the gap it made on weekly timeframe to collect more liquidity to bounce back up side. what should you do, buy or sell ? #bdl #defensestock #cochinship

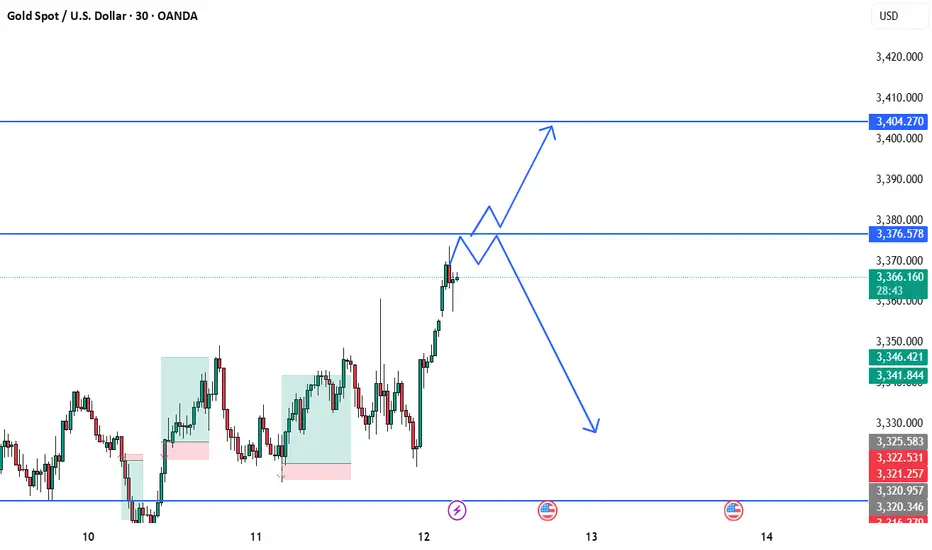
BEST XAUUSD M30 BUY AND SELL SETUP FOR TODAY Gold has shown a strong bullish push, breaking above recent consolidation and approaching a key resistance zone around $3,376. ⚔️ This area will be decisive — if price holds above it and confirms support, we could see a further rally toward $3,404. 📈✨ However, failure to sustain above this level could trigger a bearish rejection, pulling the market back toward the $3,330–$3,340 range. 📉🔄 Traders should wait for clear price action confirmation before entering. React, don’t predict! 🎯🧠
BEST XAUUSD M30 BUY SETUP FOR TODAYPrice is showing signs of bullish strength after reclaiming key demand zones near 3,310.926–3,315.098 🟦. The recent CHoCH (Change of Character) and strong bullish reaction from the demand block suggests a potential move toward the 3,360 resistance area 🔼. Buyers are likely stepping in with momentum, aiming for a break above previous highs 📉➡️📈. As long as price stays above the 3,315 support, the bullish scenario remains valid — watch for continuation toward higher highs. 🚀💹

BEST XAUUSD BUY AND SELL SETUP FOR TODAY 📉📊 Gold (XAU/USD) Analysis – Key Levels in Focus! 📈🧐
Gold is currently trading around the 3,326 zone after a recent pullback. Price is approaching the key support level at 3,310, where a potential bullish bounce may occur, targeting the next resistance near 3,350. 🛑 However, if price fails to hold above 3,310, we may see further downside movement towards the 3,293 support. 📉 Traders should watch for reaction and confirmation around these zones before taking entries. ⚠️💡 A bullish reversal could trigger strong buying momentum, while a bearish break may lead to deeper correction. 🎯💰

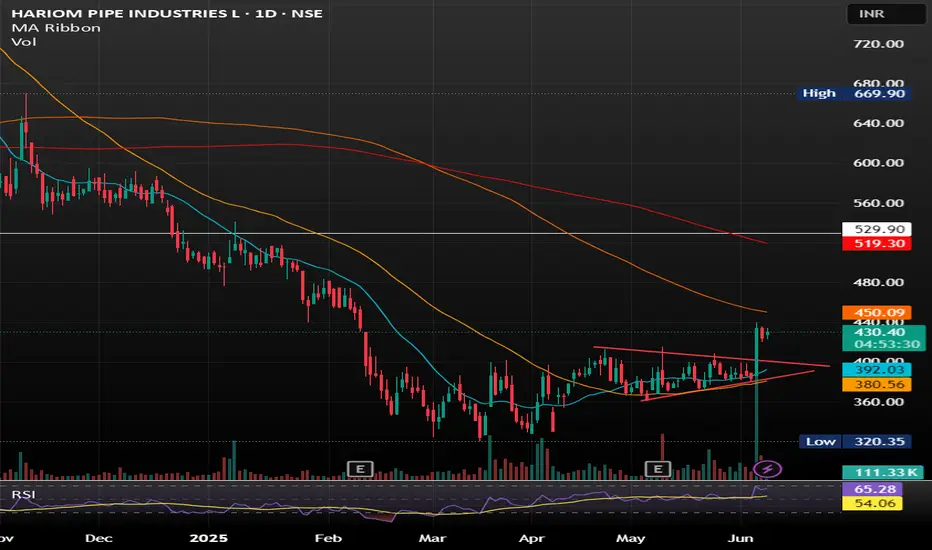
Hariom Pipes Industries Ltd Hariom Pipes Industries Ltd is a leading manufacturer of high-quality steel products, including HR Pipes, GI Pipes, GP Pipes, MS Pipes, HR Coils, and Billets. The company was established in 2007 and has grown into a major player in the iron and steel industry in India.
SYMETRIC TRIANGLE BREAKOUT WITH GOOD VOLUME SHOWING GOOD UPWARD MOMENTUM .
BUY IN ANY PULLBACK SUGGESTS.
Can the bulls help gold hit 3400 today?⭐️GOLDEN INFORMATION:
Gold prices surged more than 0.80% on Wednesday during the North American session, buoyed by disappointing U.S. economic data that signaled a slowdown in business activity and softer job growth. XAU/USD climbed to $3,382 after rebounding from a session low of $3,343.
Heightened tensions between the U.S. and China also contributed to bullish momentum in bullion. With uncertainty looming over upcoming trade negotiations between Washington and Beijing, investors sought refuge in safe-haven assets like gold.
Adding to market jitters, President Donald Trump signed an executive order doubling tariffs on steel and aluminum imports—from 25% to 50%—effective June 4. The move came just days ahead of a highly anticipated call between Trump and Chinese President Xi Jinping, further fueling concerns over escalating trade frictions.
⭐️Personal comments NOVA:
Buying power is continuing, will break out strongly in the US trading session
⭐️SET UP GOLD PRICE:
🔥SELL GOLD zone : 3435- 3437 SL 3442
TP1: $3420
TP2: $3410
TP3: $3400
🔥BUY GOLD zone: $3344- $3346 SL $3339
TP1: $3355
TP2: $3368
TP3: $3382
⭐️Technical analysis:
Based on technical indicators EMA 34, EMA89 and support resistance areas to set up a reasonable BUY order.
⭐️NOTE:
Note: Nova wishes traders to manage their capital well
- take the number of lots that match your capital
- Takeprofit equal to 4-6% of capital account
- Stoplose equal to 2-3% of capital account
