NUE Entry, Volume, Target, StopEntry: with price at or slightly above 174.74
Volume: with volume greater than 1.47M
Target: 408.78 area (this is an area, no guarantee it reaches this price, but you should be selling on the way up)
Stop: Depending on your risk tolerance; Based on an entry of 174.74 & target of 208.02, a stop at 163.65 gets you 2/1 Reward to Risk Ratio.
This LONG swing trade idea is not trade advice and is strictly based on my ideas and technical analysis. No due diligence or fundamental analysis was performed while evaluating this trade idea. Do not take this trade based on my idea, do not follow anyone blindly, do your own analysis and due diligence. I am not a professional trader.
Buysellsignal

CLH Entry, Volume, Target, StopEntry: with price at or slightly above 178.34
Volume: with volume greater than 272.5k. This stock trades too thin for my liking.
Target: 193.42 area (this is an area, no guarantee it reaches this price, but you should be selling on the way up)
Stop: Depending on your risk tolerance; Based on an entry of 178.34 & target of 193.42, a stop at 174.57 gets you 4/1 Reward to Risk Ratio.
This LONG swing trade idea is not trade advice and is strictly based on my ideas and technical analysis. No due diligence or fundamental analysis was performed while evaluating this trade idea. Do not take this trade based on my idea, do not follow anyone blindly, do your own analysis and due diligence. I am not a professional trader.

META Entry, Volume, Target, StopEntry: with price above 318.68
Volume: with volume greater than 21.7M
Target: 348.11 area (this is an area, no guarantee it reaches this price, but you should be selling on the way up)
Stop: Depending on your risk tolerance; Based on an entry of 318.69, 304.00 gets you 2/1 Reward to Risk Ratio.
This LONG swing trade idea is not trade advice and is strictly based on my ideas and technical analysis. No due diligence or fundamental analysis was performed while evaluating this trade idea. Do not take this trade based on my idea, do not follow anyone blindly, do your own analysis and due diligence. I am not a professional trader.

nifty can be short in given zonenifty short from 2 zone , if it does then surely come to next gap fill.

Bollinger Bands: Investment Guide 📊🚀📉 The Basics: Bollinger Bands consist of three lines – the middle line is the simple moving average (SMA), while the upper and lower bands are set at a certain standard deviation from the SMA. They act as dynamic support and resistance levels.
🌟 Long-Term Perspective: Bollinger Bands are highly versatile and well-suited for long-term investors. They provide valuable insights into Bitcoin's price volatility over time.
💡 The Buy Signal: One effective strategy for long-term investors is to consider buying Bitcoin when it retests the lower Bollinger Band. This can indicate that the asset is undervalued, and it may be a good entry point for a long-term position.
🔍 Risk Management: While Bollinger Bands are powerful tools, always complement them with risk management strategies. Diversify your portfolio, set stop-loss orders, and conduct thorough research.
🔮 The Future of Bitcoin: Bollinger Bands are just one tool in your investment toolkit. They can help you make informed decisions in the dynamic world of cryptocurrencies, but remember that no signal is foolproof.
In conclusion, Bollinger Bands offer a valuable perspective for long-term Bitcoin investors. Using them to identify buy signals during lower boundary retests can be a smart strategy. Combine this with proper risk management for a well-rounded approach to investing.
Stay analytical, stay patient, and remember – in the world of crypto, a long-term vision can be your greatest asset! 🌐💰
❗See related ideas below❗
Follow + Like this post and share your insights in the comments; your engagement fuels the creation of valuable content! 💚💚💚

SUPER/USDT strong demand zoneIt seems that we will see a reaction to this demand area in the future.
In the past, we saw a strong failure of the structure, and due to the creation of appropriate liquidity levels, we can expect the price to grow again from the specified area.

NSE:GREENPANEL Cup&Handle BO !!NSE:GREENPANEL formed beautiful Cup&Handle BO and looking good.
All the potential levels marked !!!

Bitcoin's Oversold - RSI for Trading Success 📊📉🔍 Understanding Oversold: Imagine a market where fear has taken over, prices are plummeting, and panic seems to be the driving force. This is the realm of oversold conditions – a state where selling pressure has pushed prices to levels that might be considered undervalued.
📊 The RSI Signal: Enter the RSI, a tool that can help you identify whether an asset, like Bitcoin, is in oversold territory. The RSI measures the speed and change of price movements, indicating potential overbought or oversold conditions.
📉 Interpreting RSI: When the RSI value drops to 30 or below, it's a sign that the asset might be oversold. This means the selling pressure has potentially pushed the price too low, creating an opportunity for a potential rebound.
💡 Tactical Insight: Recognizing oversold conditions using RSI is like spotting a light at the end of a tunnel. It doesn't guarantee an immediate reversal, but it suggests that a potential turning point could be on the horizon.
🚀 Trading Strategy: So, how can you utilize this RSI insight? When Bitcoin's RSI drops below 30, it might be an opportunity to consider buying. Remember, timing is crucial – combining RSI with other indicators and trend analysis can refine your strategy.
So, what's the bottom line when it comes to RSI and identifying oversold conditions? 📊 It's about using tools like RSI to gauge market sentiment and recognize potential opportunities. Remember that trading is a blend of art and science, and RSI is just one tool in your toolkit.
Stay curious, keep honing your skills, and remember – while oversold conditions might signal potential reversals, they're just one piece of the crypto puzzle. 🚀🧩
❗See related ideas below❗
Follow + Like this post and leave a nice comment, it will allow me to move faster and make more useful content! 💚💚💚

boshch long in geven zonethis given buy zone is good for longs to be created
a good stoploss will be red candle closing on day tf below the buy zone .
there this buy zone will be in validated and sellers will make a new resistance
till then one keep it as a good buying opportunity
also from ath to all time covid low this stock is near the .5 fibo retracement

How much should the order amount be in quantitative trading ?First, you need to determine how your strategy calculates the order quantity, which can be based on:
1. Quantity of shares
2. Amount of money
3. Percentage
This article elaborates on the points of using "Fixed Order Amount" .
The amount of margin required for a trade depends on your risk tolerance.
Using "BOT | Trend" as an example,
In the backtested performance, a fixed "initial capital leveraged by 1x" is used as the order amount for each trade,
with a maximum drawdown of 25%, meaning the assets decrease by 25% from the "peak performance point" to the subsequent lowest point (1000 ➡️ 750).
Therefore, there are two key points to note here:
* The amount of margin required should consider “How much risk you can bear? ”
Assuming you currently have 1000 to operate "BOT | Trend," and you can tolerate a maximum loss of 500 (-50%), then the total amount of each trade (margin * leverage) can be set as 2000, and so on.
Example: Now you have 2000, and you can tolerate a maximum loss of 400 (-20%), then the total amount of each trade (margin * leverage) is 1600.
Practice: Now you have 5000, and you can tolerate a maximum loss of 2000 (-40%), then the total amount of each trade (margin * leverage) is ______ (Hint: What is 25% of 2000?).
* Timing to start running quantitative trading.
Running a "trend-following" quantitative trading strategy should not start during a continuous profitable period but rather when the strategy incurs losses (relative low point of equity). This is because for trend strategies, sideways market conditions can cause the strategy to go long at highs and short at lows, resulting in a depletion of funds during this period. Starting during a continuous profitable period is likely to encounter fund depletion right after entering because markets alternate between trending and ranging phases.
Answer: 8000

AUBANK Almost 3rd Target 🎯🎯🎯 !! Trail 👍NSE:AUBANK shared @ 707 and reached to 752 crossed 2nd Target,
almost 6.5% in equity and 30k/Lot in Options,
Trail your profits and enjoy free trades, Show some love and like for more Potential charts like this !!
Enjoy your Profits !!!

nzdusd buy . Don't forget about stop-loss.
Write in the comments all your questions and instruments analysis of which you want to see.
Friends, push the like button, write a comment, and share with your mates - that would be the best THANK YOU.
P.S. I personally will open entry if the price will show it according to my strategy.
Always make your analysis before a trade

TSLA Entry, Volume, Target, StopEntry: with price above 299.29
Volume: with volume greater than 142.36M
Target: 359.29 area (this is an area, no guarantee it reaches this price, but you should be selling on the way up)
Stop: Depending on your risk tolerance; Based on an entry of 299.30, 279.30 gets you 3/1 Reward to Risk Ratio.
This LONG swing trade idea is not trade advice and is strictly based on my ideas and technical analysis. No due diligence or fundamental analysis was performed while evaluating this trade idea. Do not take this trade based on my idea, do not follow anyone blindly, do your own analysis and due diligence. I am not a professional trader.

US30 - 25th Aug - Bear or Bull momentum expected?What a week - Us30 stayed within a range majority of the week until yesterday..
If you followed my Analysis posted on Monday you would see that I gave all areas of interest and probability of where the market most likely will go to
Yesterday the Sellzone was triggered(4h flipzone) and we caught the entire move after NYC Market opened. Total 600 ticks, +1,73%, Zero drawdown..
Today is interesting (apologies for the messy charts)
- Monday, Tuesday, Wednesday buyside liquidity swept
- 4hr flipzone respected
- 4hr eq lows taken and 4hr SP taken
- PWL low taken
im expecting the market to close on the Liquidity Gap created and push higher for the correction.
- We may also see price push towards PWL and selloff again
What goes down must come up and vice versa. Powell normally causes this.
Be on the lookout - i will update if my rules are met.

EUR/CHF bullish trend is more strong for 1 or 2 next hoursIn 15min or 5 min timeframe today we would see an
strong uptrend for about two hours...
Adjust your risk when you went in profit...
Buy as much as you want, but nottice the entery and exit prices on my chart... Don't worry, buy as much as you would like...
-----
About the analyst:
Gerald Mann was born Mr. Peiman Ghasemi on February 16, 1988. After a long while of diplomatic cooperations as an adviser to Barack Obama, and as a veteran; but, finally, unfortunately he got deported from Turkey to Iran. While, in fact, he was praised by Barack Obama in 2014, but they refused to help him to become an American resident, and he never achieved his true right of being a U.S. citizen.
Lately, not too much unusual, he was bothered by a group of traitor high ranked officers... And, lately, in fact, he is threatened nowadays by a few groups of international rebellion and unmerciful officers, and several pretty high ranked international officers... And he was confronted to those nasty agents whom their's usual and everyday desire is to sue people because their self (individual) hatred and grudge. Using remote-sensing advancements...
But, however, in the country of the residency (in Iran), as a waiver for punishment, fortunately the exit ban penalty omited about him, by Iranian organizations... And he can leave the country...
He holds several certificates of participation, majoring political science and business communications, from the Harvard University and the University of British Columbia.

HASH RIBBONS - Bullish Indicator 📈🐂Understanding the HASH RIBBONS Signal:
The HASH RIBBONS signal is based on the interplay of two essential moving averages: the 30-day Simple Moving Average (SMA) and the 60-day SMA. When these moving averages cross in an upward direction, it generates a bullish HASH RIBBONS signal.
The Strength of HASH RIBBONS Signal on Weekly Time Frame:
The HASH RIBBONS signal's significance amplifies when observed on the weekly time frame. Here's why it's considered a potent bullish indicator:
Confirmation of Bullish Momentum: A bullish HASH RIBBONS signal on the weekly chart confirms the presence of strong bullish momentum. This suggests that the cryptocurrency's price may experience a sustained upward trend.
Long-Term Perspective: The weekly time frame provides a broader view of market trends, filtering out short-term noise. A bullish signal here reflects a potential shift in long-term sentiment, which can be a precursor to a substantial price rise.
Market Sentiment Reversal: A HASH RIBBONS crossover indicates a possible reversal in market sentiment. This shift can attract more buyers, resulting in increased demand and upward price movement.
Conservative Traders' Choice: Many conservative traders rely on signals from longer time frames like the weekly chart to validate their trading decisions. A strong HASH RIBBONS signal can provide the necessary confirmation for these traders.
Potential Entry Point: A bullish HASH RIBBONS signal on the weekly chart often serves as a compelling entry point for traders seeking to ride a prolonged bullish trend.
Conclusion:
The HASH RIBBONS signal on the weekly time frame holds immense potential as a bullish indicator. Its confirmation of bullish momentum, long-term perspective, and ability to signal market sentiment reversals make it a formidable tool for traders and investors alike. However, like all indicators, it's essential to combine the HASH RIBBONS signal with other forms of analysis and maintain proper risk management practices.
As you navigate the dynamic cryptocurrency market, keep in mind that signals provide guidance, but market conditions can change rapidly. Staying informed, adapting your strategies, and using reliable indicators like the HASH RIBBONS on the weekly time frame can empower you to make more informed and confident trading decisions.
❗See related ideas below❗
Follow + Like this post and leave a nice comment, it will allow me to move faster and make more useful content! 💚💚💚

FTCH Farfetch Limited Options Ahead of EarningsIf you haven`t bought FTCH`s Double Bottom here:
Then analyzing the options chain and the chart patterns of FTCH Farfetch Limited prior to the earnings report this week,
I would consider purchasing the 5usd strike price at the money Calls with
an expiration date of 2024-1-19,
for a premium of approximately $1.06.
If these options prove to be profitable prior to the earnings release, I would sell at least half of them.
Looking forward to read your opinion about it.

Potential of Gooner EMA Crossovers in Bull Markets 📈🐂The Gooner EMA crossover strategy revolves around the interaction of two Exponential Moving Averages – a short-term EMA and a long-term EMA. When the short-term EMA crosses above the long-term EMA, it generates a bullish signal. Conversely, when the short-term EMA crosses below the long-term EMA, a bearish signal emerges.
The Influence of Gooner EMA Crossovers in Bull Markets:
Gooner EMA crossovers carry substantial implications, particularly in bull markets. Here's why they matter:
Trend Confirmation: A bullish crossover, where the short-term EMA crosses above the long-term EMA, confirms the presence of an emerging bullish trend. This indicates potential upward momentum and the possibility of sustained price appreciation.
Entry Point Identification: Gooner EMA crossovers offer traders an opportunity to pinpoint entry points in bull markets. When the bullish crossover occurs, it signifies that the asset's momentum is shifting positively, making it an ideal moment to consider initiating a long position.
Visual Clarity: Crossovers are visually evident on price charts, making them easy to identify. Their clear representation provides traders with a straightforward signal for making informed trading decisions.
Timing Advantage: Gooner EMA crossovers offer traders timely insights into market shifts. Acting promptly upon the occurrence of crossovers enables traders to capitalize on the evolving market conditions effectively.
Supporting Technical Analysis: While Gooner EMA crossovers are strong indicators, combining them with other technical tools can enhance your analysis. Confirming crossovers with additional indicators or patterns adds another layer of confidence to your trading decisions.
Conclusion:
In the realm of trading, Gooner EMA crossovers are a powerful tool, especially in bull markets. They serve as robust signals for confirming bullish trends and identifying potential entry points. As you navigate the dynamic landscape of trading, integrating Gooner EMA crossovers into a comprehensive trading strategy alongside other technical indicators and analysis tools can elevate your decision-making prowess and empower you to seize opportunities effectively. Remember that successful trading involves a holistic approach, discipline, and continuous learning. 🚀📈
❗See related ideas below❗
Follow + Like this post and leave a nice comment, it will allow me to move faster and make more useful content! 💚💚💚

XAUUSDGold closed at a strong support level. Perhaps a new trend is about to start (short-term). Looking for BUYS at this level. However, if it breaks this level on Daily TF to the downside, it invalidates my bias and looks to SELL, at a confirmed pullback for downward continuation.

CASTROLIND 40% up 🚀🚀🚀🚀NSE:CASTROLIND shared @ 110 and now Trading @ 155.
Enjoy your Profits by book or Trail your SL.

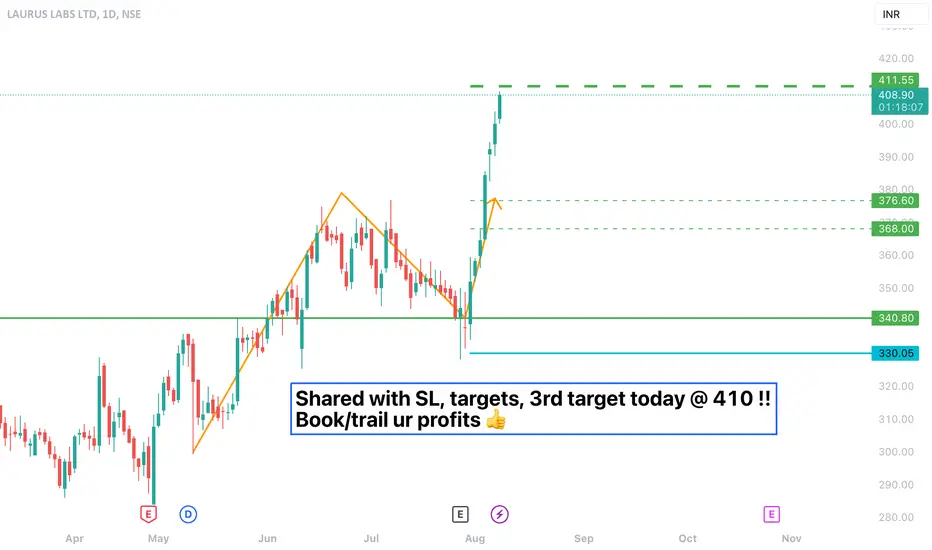
LAURUSLABS 3rd target !!!NSE:LAURUSLABS shared with all the potential levels including SL,
Now trading @ 3rd target today, Enjoy your profits by book or trail ur SL....
AAPL Entry, Volume, Target, StopEntry: with price above 194.48
Volume: with volume greater than 85M (or 203M on the weekly chart)
Target: 203.77 area (this is an area, no guarantee it reaches this price, but you should be selling on the way up)
Stop: Depending on your risk tolerance; Based on an entry of 194.49, 189.86 gets you 2/1 Reward to Risk Ratio.
This LONG swing trade idea is not trade advice and is strictly based on my ideas and technical analysis. No due diligence or fundamental analysis was performed while evaluating this trade idea. Do not take this trade based on my idea, do not follow anyone blindly, do your own analysis and due diligence. I am not a professional trader.

USD CHF H4 BUY AND SELLIt is expected to increase in the opposite direction and continue the main yield trend.
