Crude oil futures Trade the range In this video I look at the current range that we are in and I have laid out a plan in the scenario that we break that range to the upside and what we could possibly expect .
I have given some reaction zones where I anticipate price to react when we reach there .
I have used Fibonacci, volume profile, and vwap in this video .
Thankyou for your support
Buysellsignal

BTC Scalping / Intraday Signal – Entry, Stop & Target Ready!🕒 Timeframe: 15min / 5min
⚠️ Note: Manage your risk — intraday volatility is high.
This is a short-term opportunity, not a long hold.
Disclaimer: This is our personal analysis and not financial advice. Always do your own research before making any investment decisions.
💬 What’s your take on this? Drop your thoughts in the comments and feel free to share this with your friends! ❤️

ETH Scalping Signal – Entry, Stop & Target Ready!🕒 Timeframe: 15min / 5min
⚠️ Note: Manage your risk — intraday volatility is high.
This is a short-term opportunity, not a long hold.
Disclaimer: This is our personal analysis and not financial advice. Always do your own research before making any investment decisions.
💬 What’s your take on this? Drop your thoughts in the comments and feel free to share this with your friends! ❤️

BEST XAUUSD M30 BUY SETUP FOR TODAY 📈 Gold (XAU/USD) is showing bullish momentum on the 30-min chart, trading within a rising parallel channel. Price has recently bounced from lower support and is aiming for the resistance zone near $3,331. 🔼 A breakout above this level could signal further upside, continuing the bullish wave structure. Traders should watch for pullbacks to the lower trendline as potential buying opportunities. 🧠💡 As long as price stays above the $3,251 support, the bullish bias remains intact. 📊✨

Gold price recovers above 3300, tariff impact⭐️GOLDEN INFORMATION:
Gold prices (XAU/USD) edged higher to around $3,310 during early Asian trading on Monday, buoyed by renewed demand for safe-haven assets amid lingering tariff uncertainty and heightened geopolitical risks.
Investors remain cautious following fresh tensions between the United States and China, after President Donald Trump accused Beijing of breaching the terms of their trade agreement. This has rattled global markets and lent support to the precious metal. Market participants now turn their attention to the upcoming US ISM Manufacturing PMI report for May, scheduled for release later in the day, which could offer further direction for gold.
⭐️Personal comments NOVA:
US raises tariffs on EU steel, a reminder of quickly negotiated deals, gold prices positive above 3300
⭐️SET UP GOLD PRICE:
🔥SELL GOLD zone : 3335- 3337 SL 3342
TP1: $3328
TP2: $3315
TP3: $3300
🔥BUY GOLD zone: $3289- $3287 SL $3282
TP1: $3297
TP2: $3308
TP3: $3318
⭐️Technical analysis:
Based on technical indicators EMA 34, EMA89 and support resistance areas to set up a reasonable BUY order.
⭐️NOTE:
Note: Nova wishes traders to manage their capital well
- take the number of lots that match your capital
- Takeprofit equal to 4-6% of capital account
- Stoplose equal to 2-3% of capital account

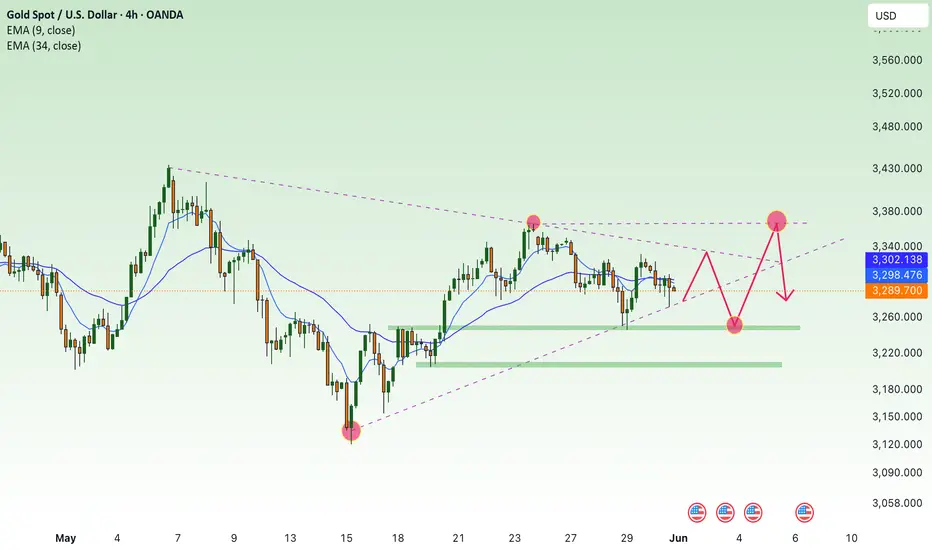
Continue to maintain stability above 3300, next week✍️ NOVA hello everyone, Let's comment on gold price next week from 06/02/2025 - 06/06/2025
🔥 World situation:
Gold prices declined on Friday, pressured by a rebound in the US Dollar, even as US Treasury yields dipped in response to a robust inflation report. Despite the yield pullback, expectations remain firm that the Federal Reserve could begin easing policy in 2025. At the time of writing, XAU/USD is down 0.83%, trading around $3,289.
Market sentiment turned more risk-averse after US President Donald Trump sharply criticized China, accusing Beijing of breaching the trade agreement reached during talks in Switzerland. In a post, Trump wrote, “China, perhaps not surprisingly to some, HAS TOTALLY VIOLATED ITS AGREEMENT WITH US. So much for being Mr. NICE GUY!”—a statement that reignited geopolitical tensions and added to market uncertainty.
🔥 Identify:
Gold price is in great competition between buyers and sellers around the price range of 3200 - 3300. Tariff policies are coming back, the trump administration is putting pressure to get favorable tariffs.
🔥 Technically:
Based on the resistance and support areas of the gold price according to the H4 frame, NOVA identifies the important key areas as follows:
Resistance: $3332, $3365
Support: $3244, $3204
🔥 NOTE:
Note: Nova wishes traders to manage their capital well
- take the number of lots that match your capital
- Takeprofit equal to 4-6% of capital account
- Stoplose equal to 2-3% of capital account
- The winner is the one who sticks with the market the longest
BTCUSDT.P | Multi Timeframe AnalyseHello to my dear friends.
Everything is told in the video.
Enjoy the trading fam.

BTCUSD HTF cycle analysis
Hi, I’m from Phoenix FX, and today I’ll be sharing my perspective on Bitcoin (BTC) price action based on the higher timeframes.
I’ll also give you my outlook on potential trade setups for today and tomorrow. Please remember that this is not financial advice—use this information as a guide only. If you find it helpful, don’t forget to like and share it with your like-minded communities.
Higher Timeframe Analysis
In my view, BTC tends to follow clear bullish and bearish cycle zones. Typically, we see a pump to new all-time highs (ATH), followed by the formation of resistance and a retracement down to a key support level. Our trading approach focuses on identifying those critical support and resistance levels, with some interim trades based on shorter-term analysis—occasionally even counter-trend, depending on the day’s market bias.
Over the past eight years, BTC has respected a major trend resistance line. The most recent ATH, around $112K, reconfirmed the relevance of this trendline. This makes it a valuable tool for projecting future ATH levels.
Looking ahead, I expect a move towards the $115K level in the coming weeks. This would likely act as a point of resistance, at which stage we might see a reversal and a drop back down to a key support zone.
Trade Setup
The chart I'm referencing highlights what I would consider the first premium buy zone, identified using a 4-hour Fair Value Gap (FVG).
The 50% level of this zone sits at $99,450. If this zone fails to hold, we may drop further to the secondary premium buy zone, which aligns with our higher timeframe (HTF) trend support and a weekly FVG. The 50% level of this deeper zone is around $89,150.
A potential long entry at $92,550, with a stop loss around $88,000, offers an excellent risk-to-reward (RR) ratio, targeting a move up to the $115K level.
Intraday Outlook
For today, I see bearish price action, with potential rejection around the $104,300–$105,000 range. Go short around the $104,750 to $105,000 zone
This could lead to a move down toward the lower key zones highlighted in the HTF analysis.
I recommend taking partial profits (TP) at every $1,000 increment and setting your stop loss to breakeven (BE) after hitting the first target.
Final Thoughts
Price action analysis is always subjective, so I’d love to hear your thoughts and ideas in the comments—each one, teach one.
Thanks for giving me some of your time.
From the Phoenix FX team, have a great weekend!

NEAR to $45? The Signs Are All There…Just imagine traveling through time.
Many people look back with regret, wishing they had invested in cryptocurrencies before previous bullish cycles. We've all heard phrases like "If only I had bought Bitcoin at $100, I'd be a millionaire by now."
But the real question is: Will you have the courage to make the right decision when the moment comes?
You might think I'm crazy for presenting these targets today — and that's okay. But trust me, in a few months, you'll witness the phenomenal power of our analysis system. The market is fractal by nature; what happens on lower timeframes inevitably plays out on higher ones.
NEAR is one of the most promising blockchains, and all signals are aligning for a move toward $45.
The question is: Do you have the courage to take action now?

Winter Is Coming — And LINK Is Leading the Charge (x25) Chainlink acts as a bridge between blockchain and the real world.
This asset has been on our radar for years, silently building strength. Its fundamentals are rock-solid, and the current price action is highly favorable for a strategic buy.
📈 On November 12, 2023, LINK officially confirmed its journey to $400 by breaking through our algorithmic confirmation zone. Since then, it’s shown a modest price increase… and right now, it's retesting one of the best buy zones we've seen.
But here's the catch:
In the coming weeks, we expect explosive rallies — the kind that won’t allow for optimal entries anymore.
✅ We are currently positioned long on LINK, and it’s proving to be one of our strongest investments to date.
And remember:
The assets we publish on TradingView have already confirmed their trajectory toward our predicted targets.
🎬Not even Trump... not even a world war could stop what’s coming.
🚀 Buckle up... because winter is coming.
And LINK is ready to lead the storm.
🔍 Disclaimer: This is our personal analysis and not financial advice. Always do your own research before making any investment decisions.
💬 What’s your take on this? Drop your thoughts in the comments and feel free to share this with your friends! ❤️

SOL/USDT"Solana, like the other two coins, is also poised for growth and is currently in the best possible position. What do you think, my friend? Do you think Solana can go up?

EUR/USD - BUY BUY BUY!Here in my personal Opinion I can see a few potential reasons to buy with high confidence.
Firstly- Weekly timeframe is showing a Bullish movement with us closing last week with a strong volume candle.
Secondly- On the Daily time frame we can see this is a high possibility of a 5th leg of elliots wave to finish this Bullish run.
Thirdly- The Daily has pushed out of the 71% level from the first demand zone. Following this on the 4H Time frame we can notice this previous push has also giving a strong Liqudity Grab into the new 71% level telling me Buyers are still highly in control.
I will be looking to trade into Buy side Liquidity after this Volume gap has been filled
Follow along for more updates

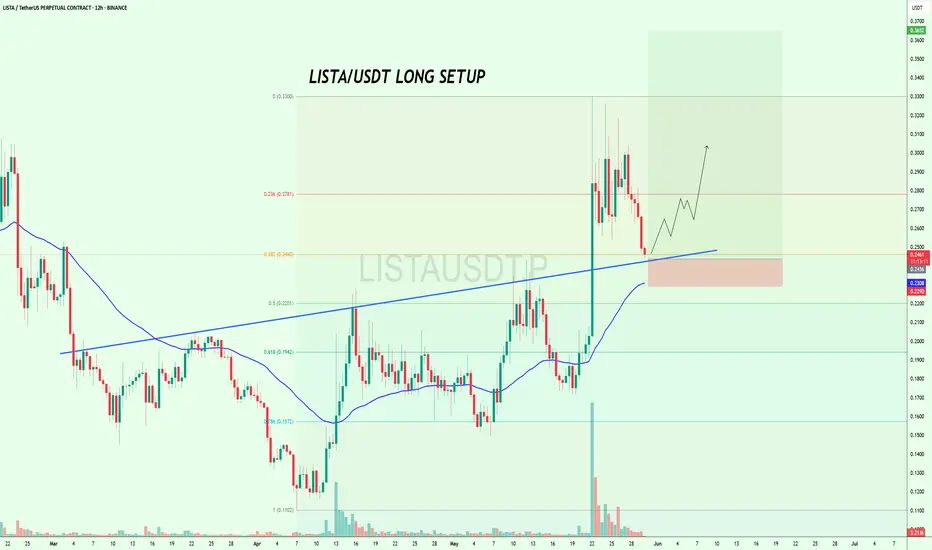
$LISTA at Key Support – Long Opportunity Loading?$LISTA looks good to long here with a short SL🚀
It is approaching a key confluence support zone right at the 0.382 Fib level (~0.2460), the rising trendline, and the 100EMA on the 12H chart.
This level held well in the last move and could once again act as the launchpad for a bullish breakout toward $0.30–$0.33.
But if it breaks below this support zone, short-term momentum could shift.
Watch how the price reacts here👀
BINANCE:LISTAUSDT
BEST XAUUSD M30 BUY & SELL SETUP FOR TODAY 📉📊 Gold (XAU/USD) Technical Outlook – Key Decision Zone Incoming! ⚠️📈
Gold prices are currently testing a crucial support zone around 3,251, following a strong bearish momentum. As shown on the M30 chart, the market is now at a make-or-break level, where two potential scenarios could unfold: either a bullish reversal toward the 3,280–3,300 area if price holds and confirms support ✅, or a bearish continuation if the level breaks, pushing price lower toward 3,220 or beyond ❌. Traders should watch for price action signals and wait for a clear breakout or strong bounce confirmation before entering any trades 🧠🔍. This is a high-volatility reaction zone — trade smart! 🎯📉📈

BEST GOLD M30 BUY SETUP FOR TODAY📉 Gold is currently showing signs of a potential pullback towards the key demand zone around 3,290–3,285 marked in purple. This area has previously acted as a strong support and could trigger a bullish reversal if price reacts positively here. 🟪 Once the price enters this zone and forms a bullish confirmation (like a rejection wick or bullish engulfing candle), we could see a strong upward move targeting 3,320+ 📈. Traders should stay alert for buying opportunities from this zone and avoid chasing the price before a clear confirmation! 🎯⚡

$BUSDT Ready to Explode? Breakout Could Send It Flying#BUSDT is demonstrating strong potential for a pennant breakout.
A successful breakout could trigger a +60% bullish rally in the coming days. 🚀
#Altseason2025

BNB/USDT"Binance, like Ethereum, is in its best condition right now. Do you think it will go up or down?"

BTC breakout soon and return to ATH💎 Update Plan BTC (May 29)
Notable news about BTC:
The overall cryptocurrency market capitalization has remained relatively stable over the past 24 hours, hovering near the $3.42 trillion level. Digital assets appear largely indifferent to the recent rally in equities, as gains in traditional markets are driven by corporate earnings and tariff-related developments rather than shifts in monetary policy or liquidity conditions. Meanwhile, the US Dollar is strengthening for a third consecutive session, adding further pressure.
Bitcoin (BTC) has pulled back from the upper end of its recent trading range near $110,000, settling closer to the $107,000 mark. This pause near previous highs has helped ease short-term market overheating. As institutional participation in Bitcoin deepens, its price behavior is increasingly mirroring that of traditional financial instruments like equities and commodities—marked by more tempered momentum and fewer fear-driven surges.
Technical analysis angle
It is still a 107k bumper area that brings profits to Buyer. But the worrying thing here is that the vertices of BTC are lower.
We will have two scenarios for BTC:
) First within the next 1 week, the organizers still go in this flag model and gradually narrow towards the top. If the price line follows this model, it will be negative for BTC and investors
) Secondly: BTC price will breakout area 109k, the target will go straight to 113k-115k and lower boundary if Breakout area 107k will return to 102k-100k
🔥BTC 4H is currently in the adjustment phase, this time will cause a lot of traders, Future - Margin to lose money, this rhythm will last long
At this time, whether new or old, should spend more time to practice, load more knowledge about the PTKT, as well as find knowledge posts at the channel ..., to strengthen the solid foundation, as well as avoid losing money at this time offline
==> Comments for trend reference. Wishing investors successfully trading

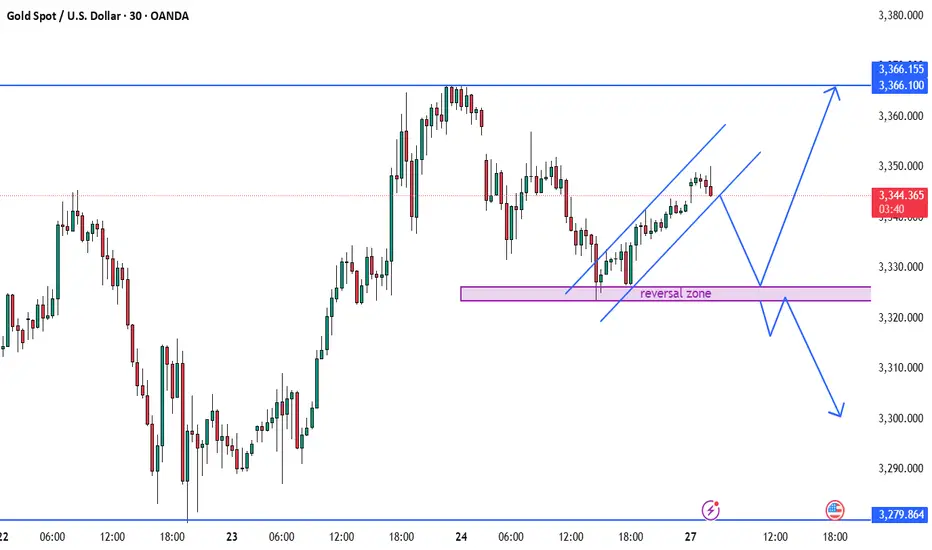
BEST XAUUSD M3 BUY AND SELL SETUP FOR TODAY 📊✨ Gold (XAU/USD) Technical Outlook – 30-Min Chart ✨📉
Price is currently trading within a rising channel after a bounce from the marked reversal zone 💜, suggesting a short-term bullish trend 📈. However, the chart outlines two key scenarios: if price breaks out upward, we may see a move towards the 3,366 resistance zone 🔼. Conversely, if the channel fails and price breaks downward, a retest of the reversal zone could trigger a deeper bearish move 📉, potentially targeting the 3,300 area or lower. Traders should watch for confirmation at key levels and react accordingly — not predict impulsively. 🧠⚖️📍
XAUUAD UPDATE 28 - 5 - 2025This is a technical analysis chart for Gold (CFDs on Gold, USD/OZ) on a 45-minute timeframe from TradingView. Here's a breakdown of the key elements:
Chart Summary (as of May 28, 2025):
Current Price: $3,321.640 (up +0.64%)
Chart Timeframe: 45 minutes
Highlighted Zones:
Resistance Zone (Top Yellow Area): Around 3,355–3,360
Support Zones (Middle to Bottom Yellow Areas):
~3,280
~3,240
~3,200
Chart Annotations:
Blue Arrows: Indicate a projected price movement:
1. Short-Term Bullish Move: A rise toward the resistance area near 3,360.
2. Followed by Bearish Reversal: A sharp drop expected after reaching the resistance zone, possibly down to the 3,280 or lower support zone.
Volume Bars: Shown at the bottom, giving insight into trade activity. A noticeable spike in volume supports the prior price drop and recovery pattern.
Interpretation:
The analyst expects a bullish continuation in the short term, reaching the resistance zone around 3,360.
After testing resistance, a rejection and bearish reversal is anticipated, targeting the support zone around 3,280 or even 3,240.
This strategy appears to rely on support/resistance trading and reversal patterns.
Would you like an assessment of the likelihood of this move or suggestions for entry/exit points?

$EGLD Gearing Up for Next Leg – Bull Flag in PlayCRYPTOCAP:EGLD is forming a clean bull flag on the 6H chart after a strong move up.
Price is holding the trendline, and a breakout above $19.7 could target $27 that’s a 47% potential move.
This setup appears solid, incorporating confluence from Fib levels and volume zones.
Eyes on this breakout that could be explosive.
Flag breakout incoming?
DYOR, NFA.
#EGLDUSDT #Altseason2025

$AXIBT Breakout Confirmed – 2x Potential Ahead?$AXIBT just broke above a key accumulation zone after days of consolidation.🚀
Strong volume, bullish Ichimoku support, and a clean breakout above resistance suggest this could be the start of a major move.
If this rally continues, we could see a sharp push toward the $0.50+ zone, nearly 2x from here.
Reclaiming and holding above the $0.22–$0.24 zone is crucial for confirmation.
Eyes on this one.

Symmetrical Triangle Breaks – $ETHFI Targets $2+CRYPTOCAP:ETHFI just broke out of a strong symmetrical triangle on the 2H chart finally escaping a long consolidation phase.
Price surged above resistance and reclaimed key EMAs, showing clear bullish momentum. If this breakout sustains, the next leg could take us toward $2.00+
Risk is tight below $1.27 the breakout zone and previous resistance-turned-support.
This move could be the start of something big.
Watch closely!
