Gold bull cycle continues, 3400✍️ NOVA hello everyone, Let's comment on gold price next week from 04/21/2025 - 04/25/2025
🔥 World situation:
Gold prices are poised to close the week on a strong footing, gaining over 2.79% as the precious metal surged nearly $90 amid continued US Dollar (USD) weakness driven by lingering global trade uncertainties. At the time of writing, XAU/USD is trading around $3,326.
Despite touching a fresh all-time high of $3,358, the rally has cooled slightly as traders lock in profits ahead of the extended Easter weekend, with both European and US markets closed. Meanwhile, real yields have ticked higher, offering a modest headwind. On the policy front, San Francisco Fed President Mary Daly noted that the US economy remains resilient, though some segments are showing signs of slowing. She emphasized that monetary policy is still restrictive enough to keep inflation in check, while also suggesting that neutral rates could be on the rise.
🔥 Identify:
Gold price is still in a big uptrend, short-term corrections only make gold price accumulate more and continue to reach new ATH, tariffs are tense, gold price continues to increase strongly: 3382, 3400
🔥 Technically:
Based on the resistance and support areas of the gold price according to the H4 frame, NOVA identifies the important key areas as follows:
Resistance: $3357, $3382, $3400
Support : $3284, $3236, $3155
🔥 NOTE:
Note: Nova wishes traders to manage their capital well
- take the number of lots that match your capital
- Takeprofit equal to 4-6% of capital account
- Stoplose equal to 2-3% of capital account
- The winner is the one who sticks with the market the longest
Buysellsignal

Global Market Overview. Part 2 — U.S. Stock Indices Start of the series here:
Indices? What about the indices?
When the market isn’t an economy, but a chessboard riddled with landmines.
As much as we’d like to see rationality reflected in index charts, indices are not the economy.
They are derivative instruments that track the capital flow into the largest publicly traded companies. In our case — they serve as a mirror of the U.S. stock market. But here’s the thing:
There’s one core principle that most analysts love to forget:
Once interest rates are cut — the game flips bullish.
Cheap money doesn’t lie idle. It flows straight into corporate balance sheets. And one of the first strategies that gets deployed? Buybacks.
Share repurchases are the fastest way to inflate stock prices — without changing the product, the market, or even the strategy. It’s an old Wall Street tune. And it’ll play again the moment Jerome Powell gives the signal to cut. Even if he says, “It’s temporary,” the market won’t care — it’ll act automatically.
But what if the cut doesn’t come?
What if the Fed drags its feet, and U.S.–China relations fully descend into trade war?
What if instead of cheap money, we get a recession?
That scenario benefits neither the U.S. nor China. Despite political theatrics, the two economies are deeply intertwined. Much more so than their leaders admit.
The unspoken threat from China
If Beijing wanted, it could cripple the U.S. economy overnight —
Nationalizing all American-owned assets on Chinese soil, from Apple’s factories to Nike’s logistics chains.
If that happens, dozens of U.S. corporate stocks would be worth less than toilet paper.
But China doesn’t make that move. Because blackmail is not the tool of strategists.
Beijing thinks long-term. Unlike Washington, it counts consequences.
And it knows: with Trump — you can negotiate. You just have to place your pieces right.
Want to understand China? Don’t read a report — read a stratagem.
If you truly want to grasp how Beijing thinks, forget Bloomberg or the Wall Street Journal for a minute.
Open “The 36 Stratagems” — an ancient Chinese treatise that teaches how rulers think.
Not in terms of strong vs. weak — but when, through whom, and against what.
You’ll see why no one’s pressing the red button right now: the game isn’t about quarterly wins — it’s about future control.
The economy is built for growth. That’s not ideology — that’s axiomatic.
Argue all you want about bubbles, fairness, or who started what.
One thing never changes: the global economic model is based on growth.
No ministry or central statistical agency can stand before a microphone and say, “We want things to fall.”
Markets reflect future expectations. And expectations are, by definition, based on belief in growth.
Even crashes are seen as temporary corrections, paving the way for recovery.
That’s why people always buy the dip.
Not retail. Smart money.
Because no panic lasts forever — especially when the whole system is backed by cash.
The U.S. controls the market through headlines
This logic fuels Washington’s strategy.
Today, Powell “waits.”
Tomorrow, the White House stirs panic with tariff threats.
The day after — surprise! “Constructive dialogue.”
And just like that:
Markets rally, dollar corrects, headlines flip from “crisis” to “hope.”
It’s not coincidence. It’s perception management.
Markets crash fast — but they rebound just as fast, once a positive signal drops. Especially when that signal touches the U.S.–China trade front.
One line — “talks are progressing” — and by nightfall, S&P 500 is back in the green.
Why? Because everyone knows:
If there’s de-escalation — it’s not a bounce. It’s a new cycle.
The recovery scenario
Here’s what happens if negotiations progress:
The dollar weakens — capital exits safe havens
S&P 500 and Nasdaq spike — driven by tech and buybacks
Money flows back into risk assets — especially industrials and retail, exposed to international trade
Gold and bonds correct — as fear fades
We don’t live in an era of stability. We live in an era of narrative control.
This isn’t an economic crisis.
This is a crisis of faith in market logic.
But the foundation remains: capital seeks growth.
And if growth is painted via headlines, buybacks, or a surprise rate cut — the market will believe.
Because it has no other choice.
In the markets, it’s not about who’s right —
It’s about who anticipates the shift in narrative first.

3382 , next ATH number today, GOLD⭐️GOLDEN INFORMATION:
Gold price (XAU/USD) enters a phase of consolidation on Thursday, trading within a narrow range near its all-time high reached during the Asian session, as investors digest conflicting market signals. Stronger-than-expected US Retail Sales figures and hawkish remarks from Federal Reserve (Fed) Chair Jerome Powell have lent support to the US Dollar (USD), curbing some of gold’s upside momentum. Meanwhile, the upbeat sentiment across equity markets and mildly overbought technical conditions are prompting traders to remain cautious, limiting fresh buying interest in the precious metal for now.
⭐️Personal comments NOVA:
Gold price continues to increase today, the fomo still has no end, pay attention to the new ATH price zone 3382
⭐️SET UP GOLD PRICE:
🔥SELL GOLD zone : 3381- 3383 SL 3388
TP1: $3370
TP2: $3355
TP3: $3333
🔥BUY GOLD zone: $3302 - $3300 SL $3295
TP1: $3310
TP2: $3320
TP3: $3330
⭐️Technical analysis:
Based on technical indicators EMA 34, EMA89 and support resistance areas to set up a reasonable BUY order.
⭐️NOTE:
Note: Nova wishes traders to manage their capital well
- take the number of lots that match your capital
- Takeprofit equal to 4-6% of capital account
- Stoplose equal to 2-3% of capital account

Bajaj Elec Buy trendDown trend changed to buy now 731 target for now.
on 5th earnings announcement there so may be it will touch on that date probably

#Bitcoin is bouncing again!#Bitcoin is bouncing again!
The weekly 50 EMA is holding strong as support.
Every time this happens, a big move follows.
Are we about to see a new rally? 👀
Retweet if you're bullish
#BTC #Crypto

continue to grow, conquer new ATH, XAU⭐️GOLDEN INFORMATION:
US economic data delivered mixed signals. Import prices stayed subdued, while the New York Fed Manufacturing Index outperformed expectations, with several internal components also showing strength. However, inflationary pressures resurfaced as prices paid climbed back into expansionary territory, and the six-month business outlook showed signs of weakening.
Looking ahead, gold traders will closely monitor March Retail Sales and remarks from several Federal Reserve officials, particularly Fed Chair Jerome Powell’s speech on Wednesday. Additional focus will be on upcoming housing figures and weekly Initial Jobless Claims to gauge the broader economic landscape.
⭐️Personal comments NOVA:
After accumulating at the beginning of the week, gold price started to grow strongly reaching 3275 and will continue to move towards the new ATH zone.
⭐️SET UP GOLD PRICE:
🔥SELL GOLD zone : 3288- 3290 SL 3295
TP1: $3270
TP2: $3250
TP3: $3235
🔥BUY GOLD zone: $3167 - $3165 SL $3160
TP1: $3180
TP2: $3200
TP3: $3220
⭐️Technical analysis:
Based on technical indicators EMA 34, EMA89 and support resistance areas to set up a reasonable BUY order.
⭐️NOTE:
Note: Nova wishes traders to manage their capital well
- take the number of lots that match your capital
- Takeprofit equal to 4-6% of capital account
- Stoplose equal to 2-3% of capital account

Long Coinbase as a proxy bet on Crypto until end of yearUntil proven otherwise I must be under the assumption that the worst is behind us for the time being. That being said, more debasement is infinitely more likely than less, so long risk assets.
-looking for a lovely retest of the broken downtrend, coinciding with a nice support level within the next 30 days. This has to be a buy for me (in the green box).
-looking to close position late this year (likely December)

BTC/USDTbitcoin hit our target of 85k from the 77k entry.
a small correction is expected here to 82k-84k due to resistance from the 200 day and 50 day emas before rise.
next target:95K

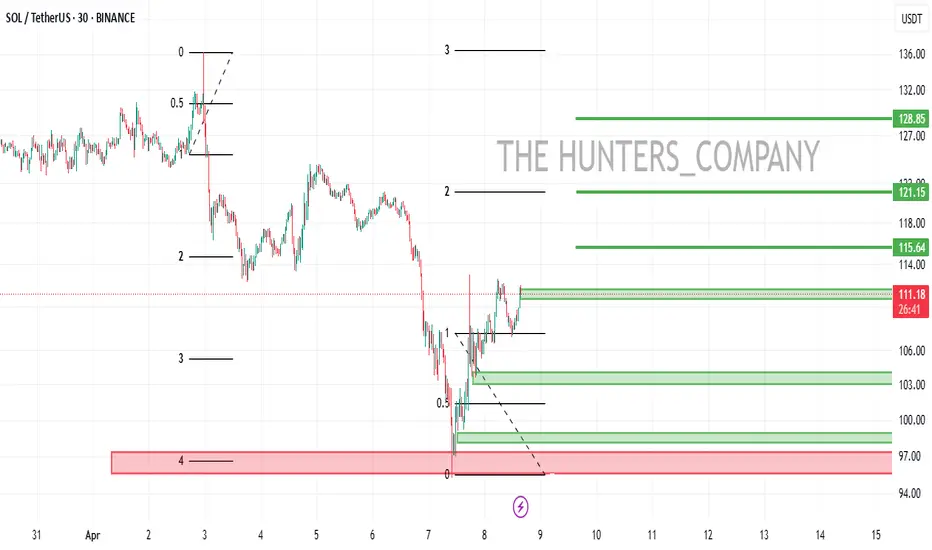
SOL/USDT:BUY...Hello friends
Due to the heavy price drop we had, the market fell into fear and at the specified support, buyers supported the price, which is a good sign that we should buy within the support ranges with capital and risk management and move with it to the specified targets.
Always buy in fear and sell in greed.
*Trade safely with us*
EHT/USDT:BUY...Hello friends
Due to the heavy price drop we had, the market fell into fear and at the specified support, buyers supported the price, which is a good sign that we should buy within the support ranges with capital management and move with it to the specified targets.
(Always buy in fear and sell in greed)
*Trade safely with us*

keep aiming for new ATH next week✍️ NOVA hello everyone, Let's comment on gold price next week from 04/14/2025 - 04/18/2025
🔥 World situation:
Gold extended its remarkable rally for a third consecutive session on Friday, surging to a fresh record high of $3,245 amid intensifying US–China trade tensions. The precious metal posted impressive gains of over 2% as fears of a prolonged trade war and its potential fallout on the global economy sent investors flocking to safe-haven assets. At the time of writing, XAU/USD is trading around $3,233.
The North American session saw China retaliate with a 125% tariff on US imports, following President Donald Trump’s move to raise tariffs on Chinese goods to 145%. The heightened geopolitical strain triggered a flight to safety, propelling Gold higher. Further fueling the rally was a sharp decline in the US Dollar, which tumbled to a near three-year low, with the US Dollar Index (DXY) falling to 99.01.
🔥 Identify:
The huge growth shows no signs of stopping, gold prices continue to benefit from tariff policies, continue to find new ATH early next week
🔥 Technically:
Based on the resistance and support areas of the gold price according to the H4 frame, NOVA identifies the important key areas as follows:
Resistance: $3255, $3280
Support : $3157, $3070
🔥 NOTE:
Note: Nova wishes traders to manage their capital well
- take the number of lots that match your capital
- Takeprofit equal to 4-6% of capital account
- Stoplose equal to 2-3% of capital account
- The winner is the one who sticks with the market the longest

XAUUSD Alert: Critical Zones in Play — Trade Smart, Trade Safe!📊 XAUUSD Market Insight 🌍
Gold is heating up once again, currently testing a tight range between 3160 and 3174. A breakout in either direction could set the tone for the next big move.
🔻 If price breaks below, we may see a slide toward 3150 and 3130—potential areas to watch for bearish momentum.
🔺 However, a strong push above 3174 could spark bullish energy, aiming for short-term targets at 3200 and 3227.
💡 Trade Smart
The market is full of opportunity, but don’t forget: risk management is key. Use proper position sizing, set clear stop-losses, and never overexpose your capital. Stay sharp, trade safe, and let the market come to you. 🧠💼

ETH/USDTbtc $85k is high liquidation and cme gap zone.
once these tariff headlines slow down bitcoin will be pulled toward these magnet levels

XAUUSD Outlook: Bull or Bear Move Ahead? Manage Risk📊 XAUUSD Market Insight 🌍
Gold is heating up once again, currently testing a tight range between 3080 and 3095. A breakout in either direction could set the tone for the next big move.
🔻 If price breaks below, we may see a slide toward 3060 and 3050—potential areas to watch for bearish momentum.
🔺 However, a strong push above 3095 could spark bullish energy, aiming for short-term targets at 3115 and 3127.
💡 Trade Smart
The market is full of opportunity, but don’t forget: risk management is key. Use proper position sizing, set clear stop-losses, and never overexpose your capital. Stay sharp, trade safe, and let the market come to you. 🧠💼

BTC Bullish Setup Incoming? Watch This Key Level!15-Minute Timeframe Analysis
Hey Traders!
#Bitcoin has just formed a potential harmonic pattern on the 15-min chart, signaling the early stages of a bullish setup.
What we're seeing:
Harmonic pattern completion
Possible Bullish Divergence building up
Price approaching a strong resistance level
Plan of Action:
We’re watching closely for a clear breakout above the resistance—that’s our confirmation signal for a bullish trend continuation. Once confirmed, we’ll be looking to enter a long position with strict risk management in place.
Pro Tip: Patience pays! Wait for confirmation to avoid false breakouts.
What do you think? Will #BTC break resistance or get rejected? Drop your thoughts in the comments!
Follow me for more real-time trade ideas, technical setups, and risk-managed strategies!
#Bitcoin #BTCUSD #Crypto #TechnicalAnalysis #HarmonicPattern #BullishDivergence #PriceAction #BreakoutStrategy #CryptoTrading #RiskManagement #TradingView

WILL GOLD PUMP AGAIN IN FOMC NEWS ALERT🚨 XAUUSD Market Update! 🚨
Gold is on the move, battling key levels between 3040! Will we see a breakout soon? 🔥
Bearish Watch: If the price drops below this range, we could target 3015 and 3020. ⚠️
Bullish Opportunity: A break above 3042 could signal a buying surge, with targets set at and 3100. 🚀
💬 What’s Your Move? Join the conversation and share your thoughts! Let’s navigate this golden opportunity together and aim for new highs! 💰

WOO Price Action Update – Major Breakout Incoming?Current Market Structure:
🔹 #WOO is trading in a perfect Accumulation Phase after a prolonged downtrend. Smart money seems to be accumulating, and a strong breakout could be on the horizon!
Bullish Confirmation:
🔹 A bullish divergence is forming on the 4-hour timeframe, signaling potential upside momentum. However, confirmation will come when #WOO breaks out and closes above the Accumulation Phase.
Trade Plan:
🔹 Wait for a break and retest above the accumulation zone.
🔹 Look for a strong bullish candle closure to confirm momentum.
🔹 Target key resistance zones while maintaining proper risk management.
Key Levels to Watch:
🔹 Resistance: $0.14 (Breakout Zone)
🔹 Support: $0.1350 - 0.09 (Accumulation Support)
What’s Your Take?
Are you bullish or bearish on #WOO? Drop your analysis in the comments below! Let's discuss.

ADA Poised for a Bullish Breakout? Key Levels to Watch!🔹 Current Market Structure: #ADA is moving sideways in an accumulation phase on the 1-hour timeframe, indicating potential strength for an upcoming bullish move.
🔹 Bullish Confirmation:
We are closely monitoring a breakout above the resistance level. A confirmed candle close above the accumulation zone with a successful retest would signal a strong buy opportunity.
🔹 Trading Plan:
🔹 Wait for a break and retest above the resistance.
🔹 Enter a long trade with proper risk management.
🔹 Target key resistance zones for potential profits.
🔹 What’s Your Take? Will #ADA break out or get rejected? Drop your thoughts in the comments!
🔹 Like, Comment & Follow for more real-time updates!

TONUSDTHello friends
Due to the price drop, we reached a good support area where good buyers supported the price.
Now we can buy in steps and with capital management in the specified support areas and move to the specified targets.
Always buy in fear and sell in greed.
*Trade safely with us*

US500 CHANNELHello friends
Given that the price is in an ascending channel, now that we have a strong wave to the channel ceiling, we have corrected the price by 50%, after which we can expect the price to succeed in hitting a higher ceiling again.
*Trade safely with us*

ZETA: Bullish Setup with Harmonic Pattern & Breakout Retest! Timeframe: 15-Minutes
Pattern: Harmonic Formation
Breakout & Retest Confirmation
#ZETA has formed a bullish harmonic pattern and successfully broken above resistance. Currently, it's retesting the breakout zone, a classic confirmation for a strong upside move!
Why This is a High-Probability Long Trade?
Harmonic pattern aligns with bullish momentum
Resistance breakout & retest—a textbook entry signal
Strong confluence of technical factors confirming the uptrend
Entry: At CMP 0.27 - 9.2750
Targets: 0.2890 - 2950
Stop-Loss: 0.2490
What’s your take on this setup? Are you taking this trade? Drop your thoughts in the comments!
Follow for more high-quality trade setups & insights!

XAUUSD UNEMPLOYEMENT CLAIM BREAKOUT ALERT!🚨 XAUUSD Update 🚨
🔥 Price Action: XAUUSD is locked between 3144 and 3151—breakout imminent?
📉 Bearish View: If it drops below this range, watch for targets at 3130 and 3120. Stay sharp!
📈 Bullish View: A break above 3151 could set up buying opportunities. Target 3165 and 3200.
💬 Join the Discussion: Drop your thoughts and strategies below! Let’s ride the golden wave together! 💰🚀

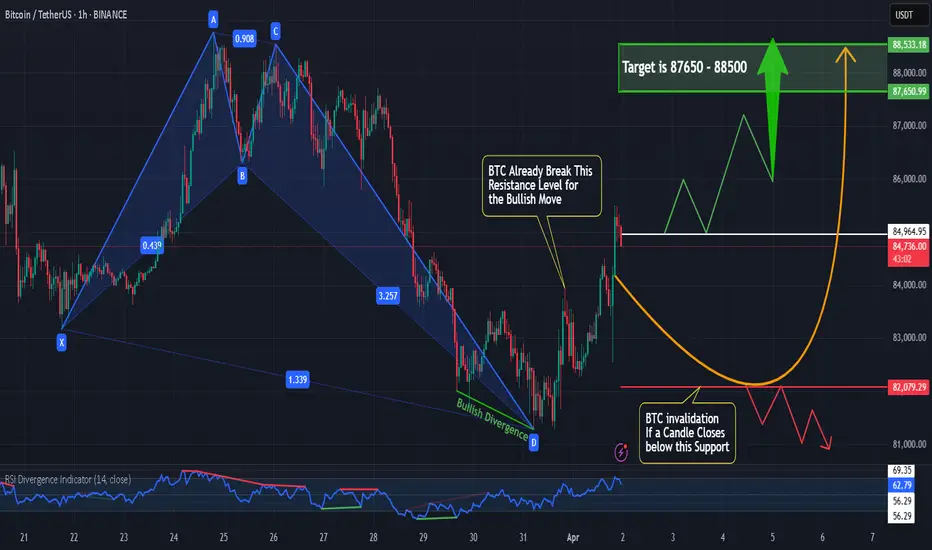
BTC Bullish Breakout Alert!🔹 Harmonic Pattern Formation on the 1H time frame
🔹 Resistance Breakout with strong bullish divergence
🔹 All signals align for a bullish trend confirmation!
Trade Idea: Enter a long position at CMP with proper risk management.
Targets: 87600 - 88500
Stop-Loss: 82000
Are you riding this move? Let me know in the comments!
#BTC #CryptoTrading #Bitcoin #PriceAction #HarmonicPatterns #BullishTrend