Bitcoin Breaks All-Time High: What’s Next?Bitcoin (BTC) has once again captured the world’s attention by smashing through its previous all-time high (ATH). This milestone has sparked excitement and speculation across the crypto community and beyond. But the key question remains: Will BTC continue its upward trajectory, or is a correction on the horizon?
Long-Term Outlook: The Bullish Case
In the long run, the fundamentals for Bitcoin remain strong. Several factors support a positive outlook:
Institutional Adoption: More institutional investors are entering the market, providing greater liquidity and legitimacy.
Scarcity and Halving Cycles: Bitcoin’s fixed supply and periodic halving events historically drive long-term price appreciation.
Macro Trends: Ongoing concerns about inflation and fiat currency devaluation continue to make BTC an attractive hedge.
Given these dynamics, we believe Bitcoin’s long-term trajectory remains upward.
Short-Term Caution: A Correction May Be Coming
While the long-term view is optimistic, the short-term picture may be less rosy:
Overheated Market Indicators: Rapid price surges often lead to overbought conditions, increasing the likelihood of a pullback.
Profit-Taking: After breaking ATH, some investors may lock in gains, adding selling pressure.
Technical Resistance: Historical patterns suggest that corrections often follow major breakouts.
We anticipate a potential correction, possibly pulling BTC back to the $90,000 range. This adjustment could unfold in the coming week or weeks as the market digests recent gains.
What Should Investors Do?
Stay Calm: Volatility is part of the crypto landscape. Corrections are healthy for sustainable growth.
Focus on Fundamentals: Remember why you invested in BTC in the first place.
Consider Dollar-Cost Averaging: Spreading out purchases can help mitigate the impact of short-term swings.
Conclusion
Bitcoin’s break above its all-time high is a testament to its enduring appeal and the growing confidence of investors. While a short-term correction may be likely, the long-term case for BTC remains compelling. As always, prudent risk management and a focus on fundamentals are key to navigating the exciting—and sometimes turbulent—world of crypto.
Do not consider it as investment advice.
#crypto #bitcoin #analysis
Buysellsignals

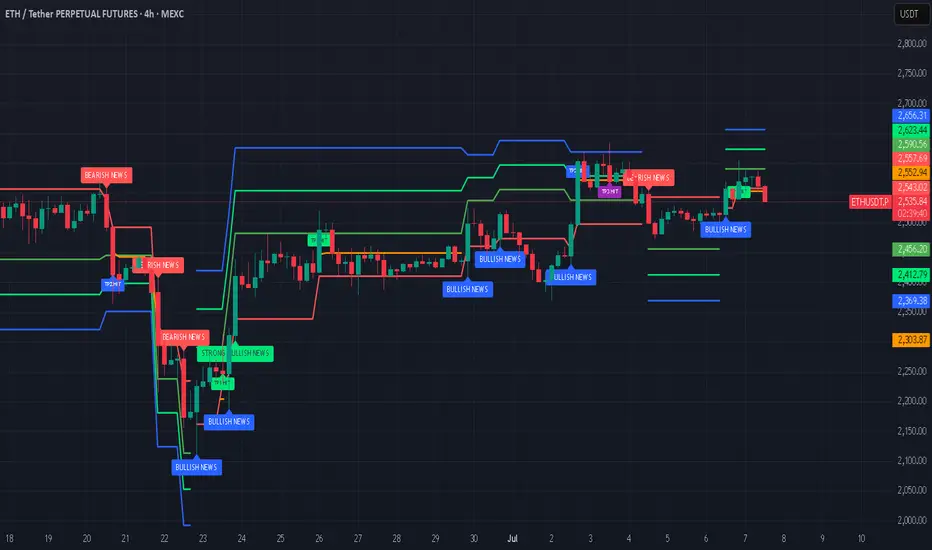
ETH - Should I go long?Ethereum (ETH) is currently positioned at a critical juncture, with multiple technical and fundamental indicators suggesting the potential for a significant move ahead.
Current Price and Momentum: As of the latest real-time data, ETH is trading at $2,549.97, having recently started a fresh increase above the $2,520 zone. The price is above both the $2,550 level and the 100-hourly Simple Moving Average, indicating short-term bullish momentum.
Key Resistance Levels: The immediate resistance is near $2,600, followed by $2,620 and a major barrier at $2,650. A decisive break above $2,650 could open the path toward $2,720 and potentially $2,800 in the near term.
Support Levels: On the downside, $2,520 is a key support zone. A sustained drop below this could trigger declines toward $2,500 or even $2,420, but as long as ETH holds above $2,520, the bullish structure remains intact.
On-Chain and Institutional Signals: Long-term holders have been accumulating ETH, and institutional inflows have surged, with over $750 million invested recently. This accumulation, alongside strong ETF inflows and rising staking activity, points to growing confidence and could act as a catalyst for a major price move.
Technical Patterns: ETH is consolidating above critical moving averages and within bullish chart formations (such as ascending triangles and coiling structures). These patterns often precede significant breakouts, especially when accompanied by increasing trading volumes and improving momentum indicators.
Market Sentiment: While short-term indicators show some cooling, the broader trend remains bullish. Analysts note that if ETH can break above the current resistance cluster, it could ignite a new wave of bullish momentum and set the stage for a broader breakout.
In summary: Ethereum is at a pivotal resistance zone. If it can break and hold above $2,600–$2,650, analysts expect a strong move higher, with targets at $2,800. Institutional inflows, strong on-chain accumulation, and bullish technical setups all support the case for a significant upside move in the coming weeks or months, provided key support levels are maintained.
Note that a possible correction of Bitcoin (which essentially will result in a drop of the entire crypto market) is possible in the next weeks.
#crypto #eth #btc #bitcoin #ethereum #analysis #trading #portfolio #long #algorithm #buysellsignals #tradingsignals #bullrun
BTC: Long Position1W buy signal at $109K. Entered Long Position & currently 10 per cent in profit. BTC is going for a new ATH in the next days.
#crypto #bitcoin #trading #buysellsignals #algorithm #bot

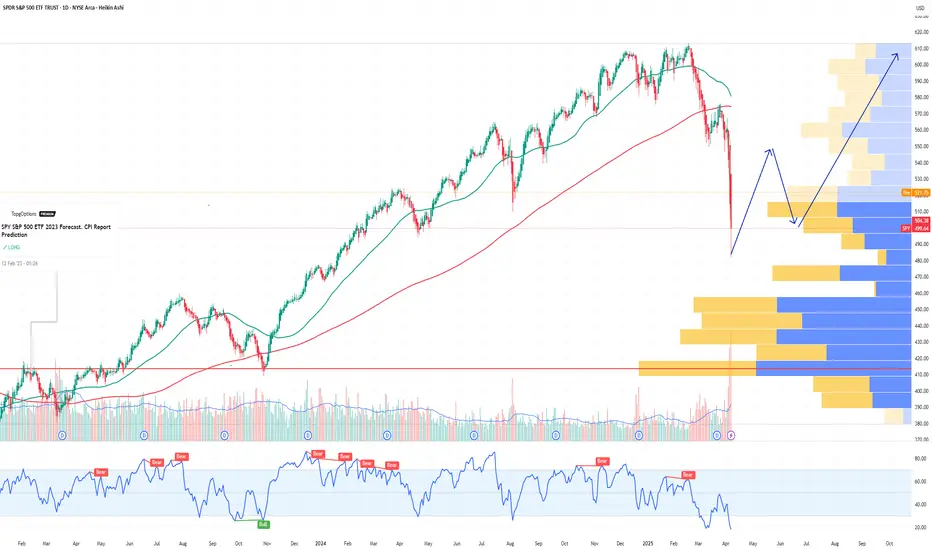
SPY S&P 500 ETF Potential W-Shaped Recovery Forming We may be witnessing the formation of a W-shaped recovery on the SPY (S&P 500 ETF) – a classic double-bottom structure that often signals a strong reversal after a period of correction or volatility. Let’s dive into the technicals and what this could mean in the sessions ahead.
🔍 The Technical Setup:
SPY recently tested key support around the $485-$500 zone, bouncing off that area twice in the past few weeks. This gives us the left leg of the W and the first bottom. After a modest relief rally to ~$520, we saw another pullback – but this second dip failed to break below the first bottom, a hallmark of the W-pattern.
As of today, SPY is starting to reclaim ground toward the $517-$520 resistance zone. If bulls can push through this neckline area, especially with volume confirmation, we could see a breakout that targets the $530-$535 area in the short term.
🔑 Key Levels to Watch:
Support: $490-$500 (double-bottom support zone)
Neckline/Resistance: $530
Breakout Target: $550 (previous highs)
Invalidation: A break below $490 with volume could invalidate the W-recovery idea and shift bias bearish.
📊 Momentum & Volume:
RSI is climbing back above the 50 level – bullish momentum building.
MACD shows a potential crossover forming, hinting at a shift in trend.
Watch for increasing buy volume as SPY approaches the neckline – that’s where the bulls will need to step up.
🧠 Macro & Earnings Angle:
Don’t forget – we’re entering a heavy earnings season and rate cut expectations are still a wildcard. A dovish tone from the Fed and strong corporate results could be the fuel that sends SPY higher to complete this W-shaped recovery.
🧭 Final Thoughts:
This is a high-probability setup if neckline resistance is broken cleanly. Wait for confirmation before going heavy – fakeouts are common in double-bottom scenarios. If we do get the breakout, we may be looking at a broader market rebound going into summer.
🔔 Set alerts near $525. A confirmed breakout could mean the bulls are back in charge.
Instructions on how to potentially use the SIG[TP/SL (1H-4H-1D)]It's a HF algorithm for the 1H,4H,1D Time-Frames. Which means whenever the instrument reaches the open price, the algo might give a lot of signals and sometimes it might give plenty of reverse signals. In order to use the specific algo in the best possible way, here's a helpful guide on how to potentially use it:
1)Wait for the instrument to reach the open price.
2) ALWAYS, Follow the signals, e.g: We are at the open price. If it indicates buy signal, then open a long position. If for example 5 seconds later (again at the open price) it indicates a sell signal, then reverse the long position into a short position, and keep doing it until it gives a signal, that will be followed by a good sized candle.
3) The safest way is to close the trade when the price reaches the potential TP1.
4) Happy Trading!
*The text above is not an investment advice, and it does not guarantee any profit.

WOOF Petco Health & Wellness Company Potential Bullish ReversalIf you haven`t sold WOOF before this major retracement:
WOOF Petco Health and Wellness Company has experienced a notable selloff recently, with its stock price declining to around $2.47 as of mid-June 2025. However, several fundamental and technical factors suggest that WOOF could be poised for a meaningful reversal and upside recovery in the near to medium term.
1. Attractive Valuation and Upside Potential
Despite the recent pullback, Petco’s stock is trading at a compelling valuation relative to its long-term growth potential.
Price forecasts for 2025 indicate an average target of approximately $3.55, representing a 43.7% upside from current levels.
More optimistic scenarios project highs up to $7.05 within this year, suggesting significant room for a rebound if market sentiment improves.
Long-term forecasts are even more bullish, with price targets of $14 by 2030 and as high as $77 by 2040, reflecting confidence in Petco’s strong market position and growth prospects.
2. Resilient Business Model in a Growing Pet Care Market
Petco operates in the resilient pet care and wellness industry, which benefits from secular trends such as increased pet ownership, premiumization of pet products, and growing consumer spending on pet health.
The company’s omni-channel approach—combining e-commerce with physical stores and veterinary services—positions it well to capture multiple revenue streams.
Petco’s focus on health and wellness services, including veterinary care and pet insurance, provides higher-margin growth opportunities that can drive profitability improvements.
3. Technical Signs of Stabilization and Potential Reversal
After the recent selloff, WOOF’s stock price has found some support near the $2.40–$2.50 level, with increased trading volumes indicating growing investor interest.
The stock’s recent modest gains and stabilization suggest that selling pressure may be easing, setting the stage for a potential technical rebound.
Options market activity and analyst upgrades reflect improving sentiment.
4. Improving Operational Execution and Financial Health
Petco has been investing in expanding its veterinary services and digital capabilities, which are expected to contribute to revenue growth and margin expansion.
The company’s recent earnings calls and financial reports highlight progress in cost management and customer engagement initiatives.
Strong cash flow generation and manageable debt levels provide flexibility to invest in growth and weather macroeconomic uncertainties.
5. Market Sentiment and Analyst Support
While some analysts remain cautious, the overall sentiment is shifting toward a more constructive outlook, with several price target upgrades and “hold” to “buy” rating adjustments.
The combination of attractive valuation, improving fundamentals, and sector tailwinds is likely to attract renewed institutional interest.

FCEL FuelCell Energy Options Ahead of EarningsAnalyzing the options chain and the chart patterns of FCEL FuelCell Energy prior to the earnings report this week,
I would consider purchasing the 5usd strike price Calls with
an expiration date of 2025-7-3,
for a premium of approximately $1.10.
If these options prove to be profitable prior to the earnings release, I would sell at least half of them.

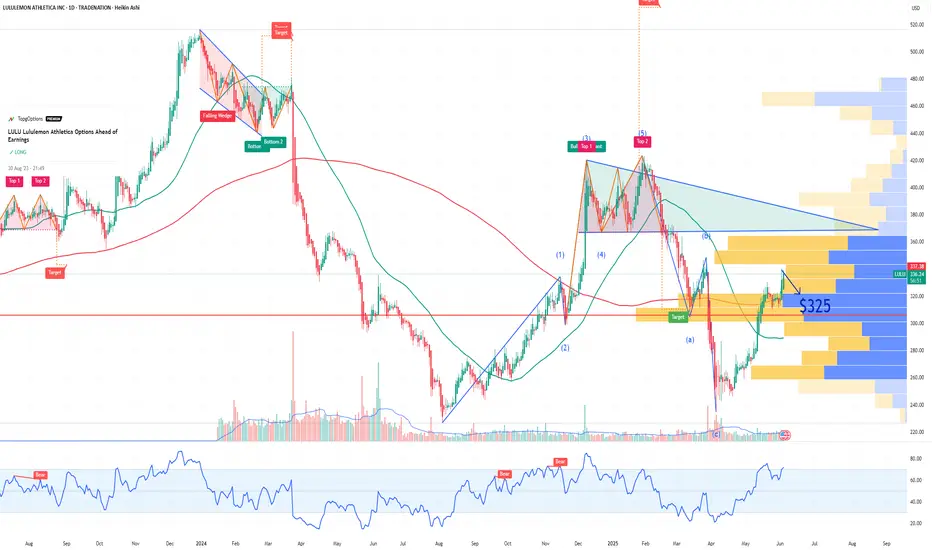
LULU Lululemon Athletica Options Ahead of EarningsIf you haven`t bought LULU before the previous earnings:
Now analyzing the options chain and the chart patterns of LULU Lululemon Athletica prior to the earnings report this week,
I would consider purchasing the 325usd strike price Puts with
an expiration date of 2025-6-6,
for a premium of approximately $10.05.
If these options prove to be profitable prior to the earnings release, I would sell at least half of them.
Disclosure: I am part of Trade Nation's Influencer program and receive a monthly fee for using their TradingView charts in my analysis.
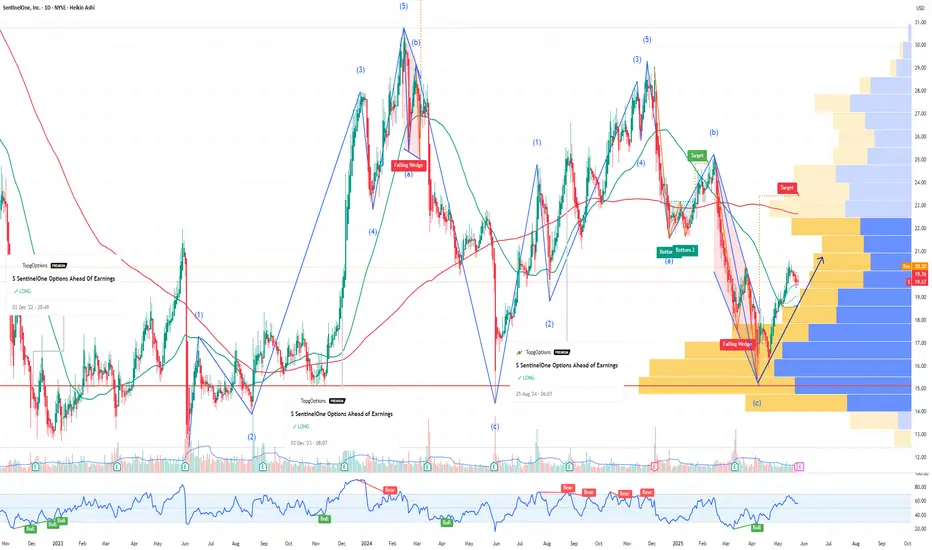
S SentinelOne Options Ahead of EarningsIf you haven`t bought S before the recent rally:
Now analyzing the options chain and the chart patterns of S SentinelOne prior to the earnings report this week,
I would consider purchasing the 20usd strike price Calls with
an expiration date of 2025-9-19,
for a premium of approximately $2.50.
If these options prove to be profitable prior to the earnings release, I would sell at least half of them.
$CHILLGUY is holding strong!$CHILLGUY is holding strong!
Price is respecting the ascending trendline and gearing up for a breakout.
A move above that top resistance could open the gates to $0.13
Entry zone: $0.086–$0.088
Stop-loss: $0.080
Looks like a clean setup with a good risk-reward.
Just manage your risk properly and don’t chase.
DYOR, NFA
#chillguy #cryptocurrency

Critical Test for $DOGS – Launchpad or Breakdown?SEED_ALEXDRAYM_SHORTINTEREST1:DOGS Update
SEED_ALEXDRAYM_SHORTINTEREST1:DOGS is heading towards an important confluence support area resting precisely at the 0.382 Fib (~0.0000184), the rising trendline, and the 50EMA on the 12H chart.
This area has maintained support in the last rally and may again serve as the launchpad for another bullish run towards 0.000022–0.0000239.
A dip below this level, though, could change short-term bias.
Be on the watch for the reaction. 👀
#DOGS #cryptocurrency

$METIS Breakout Complete – Retest in Progress!!SEED_DONKEYDAN_MARKET_CAP:METIS just completed a massive breakout and is now cooling off!
The downtrend is now over. The price broke through resistance and is currently re-testing important levels.
Two clear scenarios from here:
A bounce at the $21 level will initiate the next wave up.
A dip at $18–19 will provide a golden entry before a strong rally next.
Focusing on $25+ soon with increasing momentum.
The staging is tidy and the repositioning is only just starting.
DYOR, NFA

KLV Breakout Confirmed: Ready for the Next Leg Up!$KLV appears to be prepared for the next big move! 🔥
The breakout has occurred, and the resistance has been converted to support.
A tiny pullback at this level can set up a strong bounce.
Everything looks good; volume is building, momentum is strong, and there’s an unobstructed path to upper targets.
The subsequent crucial zone is around $0.0042+
Still early… don’t ignore this chart 👀
#KLV #CRYPTOMOJO_TA

MARA Holdings Options Ahead of EarningsIf you haven`t bought MARA before the recent rally:
Now analyzing the options chain and the chart patterns of MARA Holdings prior to the earnings report this week,
I would consider purchasing the 13usd strike price Calls with
an expiration date of 2025-5-30,
for a premium of approximately $1.38.
If these options prove to be profitable prior to the earnings release, I would sell at least half of them.

BBAI BigBear ai Holdings Options Ahead of EarningsIf you haven`t bought BBAI before the massive rally:
Now analyzing the options chain and the chart patterns of BBAI BigBear ai Holdings prior to the earnings report this week,
I would consider purchasing the 3usd strike price Calls with
an expiration date of 2025-12-19,
for a premium of approximately $1.35.
If these options prove to be profitable prior to the earnings release, I would sell at least half of them.

INTC Intel Corporation Options Ahead of EarningsIf you haven`t bought INTC before the recent rally:
Now analyzing the options chain and the chart patterns of INTC Intel Corporation prior to the earnings report this week,
I would consider purchasing the 25usd strike price Calls with
an expiration date of 2026-1-16,
for a premium of approximately $1.83.
If these options prove to be profitable prior to the earnings release, I would sell at least half of them.

MRK Merck Options Ahead of EarningsAnalyzing the options chain and the chart patterns of MRK Merck prior to the earnings report this week,
I would consider purchasing the 80usd strike price Calls with
an expiration date of 2026-1-16,
for a premium of approximately $8.50.
If these options prove to be profitable prior to the earnings release, I would sell at least half of them.

LMT Lockheed Martin Corporation Options Ahead of EarningsIf you haven`t bought LMT before the recent rally:
Now analyzing the options chain and the chart patterns of LMT Lockheed Martin Corporation prior to the earnings report this week,
I would consider purchasing the 490usd strike price Calls with
an expiration date of 2025-9-19,
for a premium of approximately $18.35.
If these options prove to be profitable prior to the earnings release, I would sell at least half of them.

Gold (XAUUSD) – Technical Analysis for April 7, 2025 (1H)After a sharp drop, price reached the key demand zone around 3025-3030. This area forms a potential buy zone from which a rebound toward 3080–3100 may occur. The chart suggests a possible W-shaped recovery. A breakout above 3100 could unlock further upside toward 3127 and then resistance at 3167.
However, a breakdown below 3015–3020 could increase bearish pressure and lead to a decline toward 2997 support. Indicators are showing signs of local oversold conditions, hinting at potential technical recovery.
Main scenario – reversal from 3025-3030 with a move toward 3080–3100.
Alternative – breakdown to 2997.

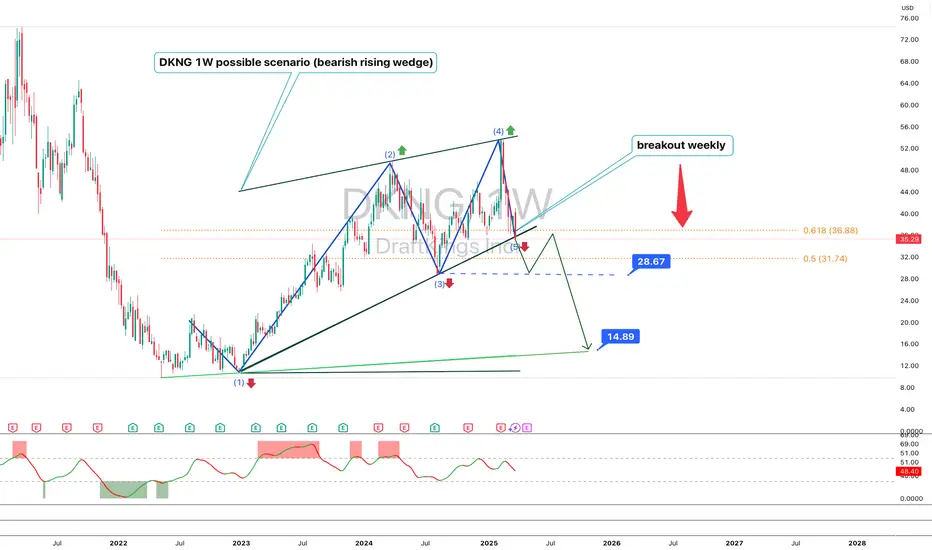
DKNG 1W – Technical and Fundamental AnalysisDKNG shares have broken a rising wedge on the weekly chart, reinforcing a bearish signal. The price is testing the $35.29 level after failing to hold above $36.88. A breakdown below $31.74 could accelerate a decline toward $28.67 and $14.89. RSI indicates weakening bullish momentum, MACD shows a bearish crossover, and EMA 50 and EMA 200 confirm a long-term uptrend but signal correction risks.
Fundamentally, DraftKings remains a leader in online gambling, but its stock is sensitive to Fed rate decisions and macroeconomic conditions. The upcoming earnings report could also impact price action. Correlation with the Nasdaq and S&P 500 increases its dependence on overall market sentiment.
A confirmed break below $31.74 could lead to further downside toward $28.67 and $14.89. If the price holds above $35.29, a recovery toward $36.88 is possible.
SEI Poised for a Breakout After Bold 23andMe Acquisition Bid !Sei (SEI), the innovative layer-1 blockchain designed for high-speed trading and decentralized finance (DeFi), is flashing strong bullish signals both fundamentally and technically. The recent news that the Sei Foundation is exploring the acquisition of 23andMe, the leading personal genomics company, has sparked excitement in the market. If successful, this strategic move could position Sei at the forefront of the multi-billion-dollar genomic data industry — combining blockchain’s security and transparency with the rapidly growing demand for data privacy.
Why This Is Huge
23andMe recently filed for Chapter 11 bankruptcy protection, opening the door for a potential buyout. The Sei Foundation’s plan to migrate genetic data onto the blockchain would give individuals direct control over their data, allowing them to decide how it’s used and even monetize it. This taps into a massive and underserved market where data security and privacy are becoming critical issues.
Bullish Chart Setup
From a technical perspective, Sei’s chart is showing signs of a major breakout:
✅ Double Bottom: SEI has recently formed a clear double bottom pattern, signaling a strong reversal from recent lows. This is a classic bullish pattern that suggests the selling pressure has been exhausted and buyers are stepping in.
✅ Falling Wedge: SEI is also breaking out of a falling wedge, a high-probability bullish formation. Falling wedges typically lead to strong upside moves as downward momentum fades and buying pressure builds up.
✅ Volume Increasing: Recent spikes in volume confirm that smart money could be accumulating in anticipation of a breakout.
Perfect Storm for a Rally
With a bullish technical setup aligning with a game-changing fundamental catalyst, Sei could be on the verge of a major breakout. A successful acquisition of 23andMe would not only give Sei real-world utility in the health data sector but also drive increased adoption and network activity. If SEI clears key resistance levels, this combination of technical strength and strategic growth could send the token to new highs.
Sei isn’t just another DeFi project — it's positioning itself to be a leader at the intersection of blockchain, health data, and privacy.
This could be the beginning of a powerful new trend for SEI. 🚀

INTC Intel Price Target by Year-EndIntel Corporation (INTC) has been trading near a key technical support level, forming a triple bottom on the chart—a bullish reversal pattern that suggests a potential upside move. The stock currently trades with a forward price-to-earnings (P/E) ratio of 20.44, which reflects moderate valuation levels compared to industry peers.
Intel’s turnaround strategy, focused on rebuilding its foundry business and strengthening its position in the AI and data center markets, is starting to show signs of progress. The company’s push into advanced chip manufacturing and strategic partnerships with major tech firms have positioned it for improved revenue growth in the coming quarters.
Technically, the triple bottom pattern indicates strong buying interest at current levels, reinforcing the case for a potential breakout. Combined with the improving outlook for chip demand and Intel’s strategic shift toward AI, a price target of $28 by the end of the year appears achievable. This would represent approximately 15% upside from current levels.
Investors should monitor Intel’s progress in its foundry business and AI initiatives, as any positive developments in these areas could accelerate momentum toward the $28 target.

breakout - gold price rebounds 3045⭐️GOLDEN INFORMATION:
Gold prices remained stagnant late in the North American session, constrained by a rebound in the US Dollar Index (DXY), which initially dipped to 104.18 before recovering. The turnaround came after the White House confirmed that President Donald Trump would unveil new automobile tariffs around 22:00 GMT. As of writing, XAU/USD is trading at $3,019, showing little change.
Despite reports from The Wall Street Journal suggesting that Trump may introduce limited tariff measures, including on automobiles, bullion traders struggled to find momentum. Meanwhile, the DXY, which measures the Greenback against a basket of six major currencies, climbed 0.32% to 104.55, further weighing on gold’s appeal.
⭐️Personal comments NOVA:
Gold price recovers, breakout of H1 frame. With the latest 25% car tax policy, gold price reacts strongly and increases again.
⭐️SET UP GOLD PRICE:
🔥SELL GOLD zone: $3045 - $3047 SL $3052
TP1: $3038
TP2: $3030
TP3: $3020
🔥BUY GOLD zone: $3023 - $3021 SL $3016
TP1: $3030
TP2: $3040
TP3: $3057
⭐️Technical analysis:
Based on technical indicators EMA 34, EMA89 and support resistance areas to set up a reasonable BUY order.
⭐️NOTE:
Note: Nova wishes traders to manage their capital well
- take the number of lots that match your capital
- Takeprofit equal to 4-6% of capital account
- Stoplose equal to 2-3% of capital account
