GoldViewFX - Daily Chart UPDATE and TARGETSThis is an update from our previous Daily chart update.
We were observing the challenge on the 1818 Goldturn Level last two days to see how EMA5 locks on this location. EMA5 has failed to cross above the 1818 Goldturn level. A rejection here, we can see from historical challenges can follow with movement down and open target to 1801.
Although we remain buying dips, as the structure for our setup remains Bullish, we will expect some movement down. Signals activated here we will take both ways and risk manage this range 1801 -1818.
Please don't forget to Like, comment and follow to support us, we really appreciate it!
GoldViewFX
XAUUSD TOP AUTHOR
Buysetup

$SOFISoFi Technologies, Inc. company announced that the OCC and the Federal Reserve approved its applications to become a Bank Holding Company through its proposed acquisition of Golden Pacific Bancorp and operate its bank subsidiary as SoFi Bank, National Assoc
Acquisition expected to close in February, Morgan Stanley Maintains Overweight price target 20, Rosenblatt Maintains Buy price target 28
SoFi Receives Regulatory Approval to Become a National Bank
SAN FRANCISCO, January 18, 2022--(BUSINESS WIRE)--SoFi Technologies, Inc. ("SoFi"), the digital personal finance company, today announced that the Office of the Comptroller of the Currency (OCC) and the Federal Reserve have approved its applications to become a Bank Holding Company through its proposed acquisition of Golden Pacific Bancorp, Inc., and operate its bank subsidiary as SoFi Bank, National Association. SoFi expects the acquisition to close in February, subject to completion or waiver of the remaining customary closing conditions.
"This incredible milestone elevates our ability to help even more people get their money right and realize their ambitions," said Anthony Noto, CEO of SoFi. "With a national bank charter, not only will we be able to lend at even more competitive interest rates and provide our members with high-yielding interest in checking and savings, it will also enhance our financial products and services to ensure they efficiently meet the needs of our members, business partners, and communities across the country, while continuing to uphold a high bar of regulatory standards and compliance. This important step allows us to add to our broad suite of financial products and services to better be there for our members during the major financial moments in their lives and all of the moments in between. I’m incredibly proud of our team and excited about the opportunities ahead to help even more people achieve financial independence."
Last year, in a key strategic step in SoFi’s path to obtaining a national bank charter, the company announced a definitive agreement by its subsidiary Social Finance, Inc. to acquire Golden Pacific Bancorp, Inc. (OTCPK: GPBI) and its wholly owned subsidiary Golden Pacific Bank, N.A. (together, "GPB"). SoFi plans to contribute $750 million in capital and pursue its national, digital business plan while maintaining GPB’s community bank business and footprint, including GPB’s current three physical branches. At the time of the announcement, SoFi submitted a revised business plan for GPB to the OCC and an application to become a bank holding company and for a change of control to the Federal Reserve for approval. After completing the acquisition of GPB, SoFi Technologies, Inc. (NASDAQ: SoFi) will become the parent company of SoFi Bank, National Association.
About SoFi
SoFi helps people achieve financial independence to realize their ambitions. Our products for borrowing, saving, spending, investing and protecting give our nearly three million members fast access to tools to get their money right. SoFi membership comes with the key essentials for getting ahead, including career advisors and connection to a thriving community of like-minded, ambitious people. SoFi is also the naming rights partner of SoFi Stadium, home of the Los Angeles Chargers and the Los Angeles Rams. For more information, visit SoFi.com or download our iOS and Android apps.

$PSTIBiotechnology Company Pluristem, and Israel’s Largest Food Producer Tnuva, Launch Landmark Collaboration to Establish Cultured Food Platform
Eyal Malis, CEO, Tnuva Group
Collaboration uniquely combines Pluristem’s technological expertise in mass-scale, cost-effective, consistent cell production with Tnuva’s power multipliers in consumer-packaged goods, research and development (R&D), consumer branding marketing, and sales and distribution with the goal to accelerate time to market
Tnuva Group is Israel's largest food conglomerate, founded 96 years ago, with over $2 billion dollars in annual revenues
The collaboration aligns with Pluristem’s strategy of leveraging its cell-based technology platform in key partnerships
Pluristem to host online investor and analyst call on January 11 at 9:00 am EST (4:00 pm IST)
HAIFA, Israel, Jan. 10, 2022 (GLOBE NEWSWIRE) -- Pluristem Therapeutics Inc. (Nasdaq: PSTI) (TASE: PSTI) (“Pluristem” or “the Company”), a leading biotechnology company, and Tnuva Group (“Tnuva Group" or “Tnuva”), Israel’s largest food producer, (together, “Parties”) today announced the launch of an innovative collaboration to develop, manufacture and commercialize cultured cell-based products for the food industry. The collaboration started with the incorporation of a new company (“NewCo”), that will receive exclusive, global, royalty bearing licensing rights to use Pluristem’s proprietary technology, intellectual property and knowhow, to be used in the field of cultured meat.
Tnuva Group will invest $7.5 million in NewCo, according to a pre-money valuation of $40 million, with the option to invest up to an additional $7.5 million over a period of 12 months following the closing. NewCo will use its own funding and resources to promote its mission with a dedicated management team and staff, and Pluristem will support the establishment, research and development activities of NewCo pursuant to a services agreement. Tnuva will provide the R&D platform to develop consumer products and will receive preferred marketing rights of any developed NewCo’s products in Israel.
Pluristem has the industry-leading capacity to design, develop, and manufacture cells for commercial use. Over the last two decades, the Company developed a proprietary three-dimensional (3D) expansion platform that can produce high-quality cells in a cost-effective manner with batch-to-batch consistency. According to both Parties’ estimates and plans, NewCo intends to present its technology Proof of Concept in 2022, with the goal of launching its first raw cultured meat product in 2023.
As part of the collaboration, the Parties may expand the collaboration to include cultured dairy and cultured fish products by establishing separate, new ventures.
Haim Gavrieli, Chairman of Tnuva Group: “Our collaboration with Pluristem is part of the execution of Tnuva Group’s strategy and vision. Tnuva strives to lead the alternative protein industry in Israel and to continue to expand in the industry on a global scale. We chose to collaborate with Pluristem because we believe it owns one of the most advanced cell production technologies in the world. We expect the collaboration between the companies to revolutionize the cultured food industry and develop the next generation of alternative proteins.”
Zami Aberman, Chairman of Pluristem: “Both Parties are leading companies in their fields, each with proven experience and tremendous capabilities, and the collaboration between us holds vast potential to lead towards a better future for the food industry. The collaboration with Tnuva supports Pluristem's strategy to establish partnerships that leverage its cell-based technology platform. As we embark on this collaboration with Tnuva, Pluristem is still dedicated to its core business of developing cell therapy products."
Yaky Yanay, CEO & President of Pluristem: "Over the years, Pluristem has developed one of the most advanced cell manufacturing platforms. During the last year, we made our strategy more precise, with the goal of leveraging our technology and expertise through partnerships and collaborations. Today, we are proud to join forces with a market leader, Tnuva Group, as they bring 96 years of experience in consumer food brands and innovation to the table. We believe that Tnuva’s and Pluristem’s vast experience will support fast and effective development of large-scale cultured meat products, relying on our existing infrastructures and talented teams. This collaboration is the first showcase of Pluristem’s intention to expand its business to verticals that need superior cell expansion proprietary technologies."
Eyal Malis, CEO of the Tnuva Group: "Tnuva Group has decades of experience developing and marketing innovative products for the Israeli market. Tnuva leads the alternative protein market in Israel and has recently taken its expertise globally. Just as Tnuva made the field of alternative proteins accessible to every Israeli home, we intend to make cultured food products available to all. The collaboration between two proven pioneers in their fields, each of which with proven experience and tremendous abilities, can create a better future for the food industry.”
Alternative meat is one of the fastest growing industries in the world and is estimated to be a $140 billion market by 20301. Affordable cultured food will require mass-produced, high-quality cells at competitive costs.
Pluristem to host online investor and analyst call on January 11, 2022 at 9:00 am EST (4:00 pm IST). Click here to register: veidan.activetrail.biz
About Tnuva Group
Tnuva Group is the largest food producer in Israel, as well as the Israeli leader in the field of alternative dairy and protein products. Tnuva Group has annual revenues of over $2 billion, 6,000 employees in 32 sites country wide. The Tnuva brand can be found in almost every home and every meal in Israel, with the country's largest distribution network for chilled and frozen products, including a wide range of dairy products, meat, eggs, fish, frozen vegetables, pastries and frozen and chilled food. Tnuva holds Israel's leading and most loved food brands in Israel, with approximately 4 million of Tnuva Group's products sold daily.
Tnuva takes part in the establishment of advanced food tech platforms in Israel, including 'FRESH START,' an innovative food tech incubator in Northern Israel with the goal of future development of the Israeli food industry. The incubator, established in collaboration with the Israel Innovation Authority, Tempo Beverages Ltd, the investment platform Our Crowd, and the American investment fund Finistere, specializes in locating and accompanying groundbreaking Israeli food technologies. Tnuva also supports innovative startups food companies, and academic researchers in Israel. Tnuva has recently signed a know-how licensing agreement with Swiss retail giant "Migros", under which Tnuva will help the Swiss company produce dairy alternatives.
About Pluristem
Pluristem is pushing the boundaries of science and engineering to create cell-based products for commercial use. The Company’s cell therapies advance the field of regenerative medicine, with potentially groundbreaking applications for treating ischemia, damaged muscle, hematology deficiencies, and inflammation. Pluristem sources its therapeutic cells from the placenta, an ethically accepted and potent source. The Company’s manufacturing platform is a patented and validated state-of-the-art 3D cell expansion system. Pluristem’s method is uniquely accurate, cost-effective, and consistent from batch to batch. The collaboration with Tnuva supports Pluristem’s strategy to establish partnerships leveraging Pluristem’s cell-based technology platform.
Safe Harbor Statement
This press release contains express or implied forward-looking statements within the Private Securities Litigation Reform Act of 1995 and other U.S. Federal securities laws. For example, Pluristem is using forward-looking statements when it discusses the expected contributions of each of the Parties with respect to the collaboration and NewCo, the expected timing of the presentation of the proof of concept and the goal for the timing of the launch of the first cultured meat product, the potential benefits to be realized by the collaboration and the potential for expanded collaboration with respect to cultured dairy and cultured fish products. These forward-looking statements and their implications are based on the current expectations of the management of Pluristem only and are subject to a number of factors and uncertainties that could cause actual results to differ materially from those described in the forward-looking statements. The following factors, among others, could cause actual results to differ materially from those described in the forward-looking statements about Pluristem or NewCo or the collaboration: changes in technology and market requirements; either may encounter delays or obstacles in launching and/or successfully completing its clinical trials, if necessary; their products may not be approved by regulatory agencies, their technology may not be validated as they progress further and their methods may not be accepted by the scientific community; they may be unable to retain or attract key employees whose knowledge is essential to the development of their products; unforeseen scientific difficulties may develop with their processes; their products may wind up being more expensive than they anticipate; results in the laboratory may not translate to equally good results in real clinical settings; their patents may not be sufficient; their products may harm recipients or consumers; changes in legislation with an adverse impact; inability to timely develop and introduce new technologies, products and applications; loss of market share and pressure on pricing resulting from competition, which could cause the actual results or performance of Pluristem, NewCo or the collaboration to differ materially from those contemplated in such forward-looking statements. Except as otherwise required by law, Pluristem undertakes no obligation to publicly release any revisions to these forward-looking statements to reflect events or circumstances after the date hereof or to reflect the occurrence of unanticipated events. For a more detailed description of the risks and uncertainties affecting Pluristem, reference is made to Pluristem's reports filed from time to time with the Securities and Exchange Commission.

$SNDR to head higher after breaking from cup and handle?* Great earnings quarter over quarter
* Breaking out of IPO base (also shaped like cup and handle on the monthly chart)
* Very high 3-month relative strength of 8.43 in the Industrial sector
* Breaking out of an 18 month base with higher than average volume that recently created a cup and handle
* The red horizontal line indicates previous all time highs which was retested as support just recently
Trade Idea:
* Now's a great time to enter as the price is very close to the broken level.
* Due to current market conditions I wouldn't be surprised if we break back below $26.91 to around $26.52 before heading higher.

GoldViewFX - 3H CHART UPDATE & TARGETS$Another awesome day of trading for TEAM GOLDVIEW!!
1806 Goldturn axis was hit, as per our post on the 16th December (see related post below). We identified this as a target and a strong level of support. Price was rejected at 1806 and failed to break down so we saw a retest back to 1820 level. Our buy entries from 1806 were all banked at 1819 and now we see price hover in between.
Its interesting to see, resistance levels like 1806 are now turning into strong support levels. This is a key example of the Bullish structure that gives us confidence to buy dips.
We will now wait to see 1806 break to confirm movement to the lower levels and if so we will change up our plans and update you all accordingly. There is room for price to challenge the lower part of the channel, however MA200 is also providing support here and this can give the momentum needed for a challenge back to 1817 and then 1825.
A bull flag formation is also inline with the upper part of the channel flagpole target at 1850.
All signals we took have TP'd and we are proud to say with a 100% hit rate for January. (See related post below on H1 targets)
Please dont forget to like, comment and follow to support us.
GoldViewFX
XAUUSD TOP AUTHOR

GoldViewFX - H1 UPDATE and TARGET$This was posted yesterday and the levels are playing out. Price moved up during Tokyo market open and found resistance again at 1823 Goldturn, followed with movement down.
EMA5 has now crossed below 1817 with a candle body close, confirming further movement down and a gap to 1806, however price found support at 1810, which is a historical Goldurn from December, which we have highlighted now.
Our setups remain same until we see a break below 1795 with EMA lock and confirmation.
Please dont forget to like, comment and follow, we appreciate it.
GoldViewFX
XAUUSD TOP AUTHOR

GoldViewFX - H1 Update and Targets$Quick update on yesterdays post on the HOURLY CHART (see link to related post below).
We identified a range of 1817.42 - 1828.99 and expecting price to play in this range.
EMA5 broke 1817.42 down with a candle body close, which opened up the lower levels. 1806 being the strong Goldturn level, however price went and HIT the recent 1814 Goldturn and found support. Anyone who noticed this break, which we highlighted could have caught 30pips here.
The price then broke back up into 1817 Goldturn with a candle body close, which opened the upper levels, 1828 being the strong Goldturn, however price went and HIT the recent 1823 Goldturn and found some resistance; another easy catch, if anyone caught it to the next Goldturn. We had a buy signal activate here, confirmed with all our parameters, which we took and banked!!!
We have also identified a Bull flag formation here and the potential target of the pole is inline with our overall 1828 Target. We continue to buy dips and should this change, we will be sure to update you all.
Please don't forget to like, comment and follow, we really appreciate it.
GoldViewFX
XAUUSD TOP AUTHOR

AUDCAD Bulls will take over, LONG!AUDCAD has been in a downtrend for a while sellers are now exhausted because we can see the decrease in volume. price is now ranging in a bearish flag and we can anticipate a break to the upside. In this week I will be monitoring this pair for a buying opportunity around 0.925 level.

xauusdDepending on the correction mode, one can expect oscillation in a triangular channel
Re-testing the canal floor is not far off But due to the waves formed, this will not happen soon.
I expect an upward movement But this move will not be long.
Positive and negative news will confirm this price suffering.
You can wait if the pattern is formed to enter the purchase in the invalid cast doubt phase (a.b.c)

USDCAD Potential Bullish Reversal, LONG!USD has been in a downtrend for a while now it seems that the bears are exhausted and price is breaking lower Tf structures to the upside. In the upcoming week i will looking for a buying opportunity around 1.249 demand zone.
If you don't understand the structure do not trade.

Reviewing my last trade for 2021: $TRT 25%ish gainLuckily, I ended up 2021 with a win. It was a modest one but given how tough the trading environment was back in December for the long side (likewise in the start of 2022), I'm thankful that I was able to pull off a W. Let's review it
$TRT is the ticker of the trade.
First entered the trade back in December 7, 2021 (1st Green Arrow) at $9, when it proved strength. Cut was $7.20
Was a little challenged by this trade given it didn't move right away as I expected it to. When it retraced, I gave myself two options: follow the original cut or exit the position early and buy it back in case stock proves me wrong. Decided to go for the latter and went out of the position last Dec 13, 2021. (1st Red Arrow)
I was proven wrong. I went back in TRT on Dec 15 (2nd Green Arrow), again when it showed strength and added more when it slightly corrected (Multiple Green Arrows). Me being proven wrong by the stock earlier gave me more confidence to size this bigger compared to the initial engagement.
Used the 5 Day Moving Average to trail my profit when I was ahead. Was initially targeting $15 but it never happened. TRT retraced to my trail profit, putting me out of the trade at $11.40 with a 25% gain (2nd Red Arrow). Expected more but can't complain. A nice end of year bonus.
Takeaways from this trade: Always be ready and be patient for your A+ setups to manifest.
Zooming out, the area pattern traded is an ascending triangle, a bullish area pattern
Hope you learned a thing or two.
Thanks and good luck out there!

Buy TINPLATEHigh Probability Trade
Timeframe Used:
Weekly
Trade Frame:
Few Weeks/Months
Why Buy ?
-> Simple Price Action, Price making HH-HL.
-> After reaching ATH, price retraced from 50% Fib levels and has given a nice breakout with Volumes
-> Nice CUP breakout on longer TF
For Swing:
Buy Above: 325
Stop Loss: 280
(Weekly Closing Basis)
Targets: 345, 375, 400 ++
Trail your SL above 350
For Midterm:
Buy Above: 325
Stop Loss: 250
Add More around 300 levels, add at every dip till 280
Ride this stock for long !!

$RHI to head higher after breaking out of a tight 3week range?* Great earnings
* Very strong up trend
* High 3-month relative strength of 1.41 in the Healthcare sector
* High U/D volume ratio of 1.51
* Breaking out of a very tight 3 week consolidation of ~3.85% with higher than average volume
* If you have access to Volume Profiles you can see that the $113.04 area has tonnes of volume.
* We can expect the $113.04 area to serve as support moving forward.
Trade Idea:
* Looking at the weekly, this seems like a great time to enter as it's recovering from the pull back.
* If you are looking for a better entry you can wait for an opportunity around the $113 area as that should serve as support moving forward.

TER will it continue to the up side?* Exceptional earnings
* Very strong up trend in the long term
* Very high 3-month relative strength of 6.35 in the Tech sector
* Pays out dividends
* I last discussed this early December 2021 when it broke out of an 11 month base.
* Since then it did move higher and due to recent market conditions it had a slight pull back.
* Used $163.03 as support before breaking below.
* Now it's breaking out of the pull back zone and showing signs of going higher.
Trade Idea:
* Given the market uncertainty you can wait to see how it behaves next week.
* You can enter at today's close
* Or if you're looking for a slightly better entry you can look for an opportunity near the $163.03 area.
* If you have access to Volume Profiles you can see that the $163 area did receive quite a bit of volume so I would expect it to serve as support moving forward.

GoldViewFX - UPDATE on TARGETS$$This was posted on the 12th of JAN. We called both targets top and bottom.
We identified a broken Goldturn 1823 with EMA5 crossing with candle body close and leaving a gap confirming a move to 1828. This played out perfectly!!
1828 was an area that has been rejected before more than once therefore the level has strengthened as resistance. We highlighted that should EMA5 fail to cross this with candle body close we will get the rejection to 1817. This played out perfectly too!
The Goldturn range is now 1817 to 1828. Price is now challenging 1817. We will look to see if EMA5 crosses this level to open up the lower levels. If we see a Goldturn created above 1817, then we can expect the price to go back to challenge the upper levels again.
We remain confident in our setups and will continue to share updates and ANY changes to our plans.
We have had another smashing week and now wish you all a great weekend. We will be sure to share our analysis for the coming week Sunday night, so don't forget to check in.
Please don't forget to like, comment and follow, it helps us to bring more updates to you, so keep supporting us!!
GoldViewFX
XAUUSD TOP AUTHOR

GoldViewFX - Daily Chart ProjectionSo far we have had an awesome week and our setups for the current market are performing perfectly.
Our plans to buy dips still remain and we are looking for price to target 1834. We are trading each level on the shorter time frames in stages but wanted to share the Daily chart view for an overall plan.
Should the price get rejected here, we will still remain bullish unless we see a break on the trendline at 1795 with EMA5. If this trendline breaks with EMA5 then we will slow down and lighten load on buying dips.
Should this trendline stay respected, we should get a breakout into 1834 and 1852 with plenty of retracements for entries.
We wait patiently and cherry pick where we need to.
Please don't forget to like, comment and follow to support us. It helps us, to bring more updates to you!
GoldViewFX
XAUUSD TOP AUTHOR


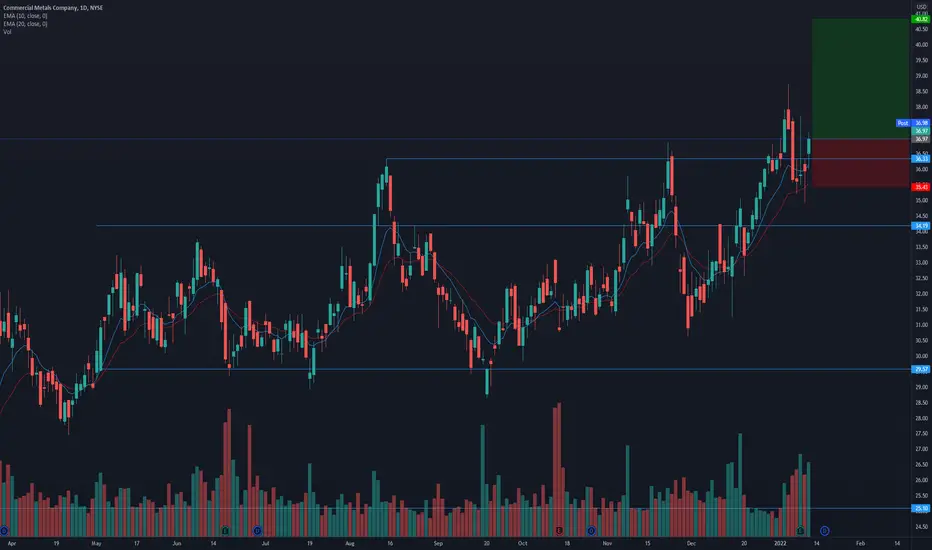
$CMC breaking out of a ~7 month base!* Great earnings
* Strong up trend in the long term
* High 3-month relative strength of 1.08 in the Basic Materials sector
* Pays out dividends
* Breaking out of a ~7 month base with higher than average volume
* Broke out earlier but due to current market conditions it did have a slight pull back and now is breaking out once again.
* It did, in the recent months, break out of a multi-year base
Trade Idea:
* You can look to enter at today's closing price.
* If you want a better entry you can look for an opportunity around the $36.33 area
WY breaking out of an 8 month base!* Great earnings
* Very strong up trend in the long term
* High 3-month relative strength of 1.12 in the Real Estate sector
* Pays out dividends
* Breaking out of a ~8 month cup formation with a depth of ~25.94%
* Attempted to break out a couple of weeks ago but due to current market conditions it had a slight pull back and now is breaking out once again.
* Maximum probable ROI is ~25.94%
Trade Idea:
* You can enter now at today's close if you want to stay in the market.
* Due to uncertain conditions it's better to enter with a small position if not in cash.
* If you're looking for a better entry, you can look for an opportunity around the $40.54 area.

KLAC ready to make new all time highs?* Exceptional earnings quarter over quarter
* Incredibly strong up trend over the long term
* High 3-month relative strength of 2.87 in the Tech sector
* Pays out dividends
* Breaking out of a base on base pattern
* First base lasted ~8 months before breaking out
* Second base formed immediately after the breakout and has been forming for the past ~9 weeks
* Current week is also forming a bullish engulfing candle
* It did try and break out of the second base earlier but due to current market conditions it had a slight pull back.
* Now it's breaking out for the second time with higher than average volume.
Trade Idea:
* You can enter now at today's close as a starter position if you want to stay in the market and set a closer target.

GoldViewFX 1H level update and TARGET$Quick update on the 1H chart setup.
We have 1823 Goldturn broken with EMA5 and candle body close confirming next stop to 1828.
1828 is a strong Goldturn level - if this fails to break with EMA5 then we expect retracement down to 1817 Goldturn.
If 1828 breaks open with EMA5 and candle body close then al the upper levels open up. We are still very much buying dips. Any changes to this plan we will continue to keep you all updated.
Please don't forget to like, comment and follow to support us.
GoldViewFX
XAUUSD TOP AUTHOR

Buy signal from many indicatorsOrigin protocol token $OGN is a very volatile coin.
It has a lot of interest in last days as shown by the Big Guy indicator.
Also, it holded the long time support zone of 0.45-0.46.
SL under 0.44 (to allow possible squizes)
Targets 1.2 - 1.4

LITE breaking out of a tight range with higher than average volu* Excellent earnings
* Strong up trend in the long term
* High 3-month relative strength of 2.61 in the Tech sector
* High 50 day U/D ratio of 2.11
* Breaking out of a 3.31% range
* During the consolidation the volume did dry up and as it started breaking out the volume picked up.
Trade Idea:
* You can enter now as the price is just breaking out of the tight range
* If you're looking for a better entry you may wait for an entry opportunity near the $105.61 area
