BTC accumulates above 104,300 zonePlan BTC today: 17 June 2025
Related Information:!!!
Bitcoin (BTC) price falls to around $106,000 at the time of writing on Tuesday following a mild recovery the previous day. The decline comes as investors continue to digest the escalation of the Iran-Israel conflict and after US President Donald Trump highlighted concerns and asked his security advisors to meet in the Situation Room. While institutional interest in Bitcoin remains robust, any further escalation in the Middle East could impact global risk assets.
The US steps in to resolve the Iran-Israel war
Bitcoin price action remained broadly resilient on Monday despite escalating tensions in the Middle East. The four-day-old war between Israel and Iran, which began on Friday, has so far failed to trigger a sharp correction. The largest cryptocurrency by market capitalization held above its key psychological threshold of 100,000 despite the initial shock — a contrast to April last year, when BTC fell more than 8% amid similar Iran-Israel turmoil.
The New York Times reported on Monday that US President Donald Trump has encouraged Vice President JD Vance and his Middle East envoy, Steve Witkoff, to offer to meet with the Iranians this week.
personal opinion:!!!
Gold price continues sideways and accumulates in 2 trend lines, support 104,300
Important price zone to consider :!!!
support zone : 104.300 - 104.100
Sustainable trading to beat the market
Buysignal

Accumulate, BTC back above 110K💎 BTC PLAN UPDATE (June 16)
NOTABLE BITCOIN (BTC) NEWS:
Bitcoin (BTC), Ethereum (ETH), and Ripple (XRP) are showing signs of stabilization around key support levels following last week’s correction. BTC is attempting to regain momentum after closing below a critical support zone, while ETH and XRP are hovering near technical thresholds that could determine their next directional move.
TECHNICAL ANALYSIS OUTLOOK:
Bitcoin could decline further if it closes below the 50-day EMA
Bitcoin closed below its daily support at $106,406 on Thursday, then bounced back after retesting the 50-day Exponential Moving Average (EMA) at $102,893 on Friday. BTC has since stabilized around the $105,000 level over the weekend. As of Monday, it continues to consolidate, trading near $105,788.
If BTC fails to close above the $106,406 resistance level and heads lower, it may extend its decline toward the psychologically significant $100,000 level.
The Relative Strength Index (RSI) on the daily chart is hovering around the neutral 50 mark, signaling indecision among traders. Meanwhile, the Moving Average Convergence Divergence (MACD) indicator shows a bearish crossover on the daily chart, indicating selling pressure and a possible downtrend continuation.
At this stage, whether you're new or experienced, it's wise to spend more time practicing, deepening your technical analysis knowledge, and exploring educational content shared on the channel. Strengthening your foundation will help you protect your capital in this volatile environment.
==> This analysis is for trend reference only. Wishing all investors successful trades!

BEST XAUUSD M30 BUY SETUP FOR TODAYGold (XAU/USD) is showcasing strong bullish momentum after breaking above the key resistance zone near $3,404, now acting as fresh support. 🔄 The price formed a bullish structure with clean higher highs and higher lows on the 30-minute chart, confirming buying strength. 🟣 The marked demand zone around $3,392–$3,404 is critical—if price retests and holds this level, we can expect a continuation toward $3,420 and beyond. 🚀📌 Traders should watch for bullish confirmations on pullbacks to this zone for potential long setups. 🧠⚡

MRK Merck On the Verge of a Breakout? Unusual Calls !!Merck (MRK) is setting up for what could be a high-probability breakout. The stock has been in a falling wedge pattern for several months — a classic technical formation that often precedes sharp upside moves. Price action has now compressed to the end of the wedge, and we may be on the brink of a bullish resolution.
🔍 Technical Setup
Falling Wedge Pattern nearing completion
Price currently hovering near long-term support ($78.25)
Strong bullish divergence forming on momentum indicators (RSI/MACD)
The falling wedge is typically a reversal pattern, and given how deep MRK has pulled back from its highs ($134+), the risk/reward here looks compelling.
🔥 Options Flow
Today’s options market added fuel to the fire:
48,000 call contracts traded expiring this Friday
This sudden surge in short-dated call buying signals aggressive positioning for an imminent move
This kind of volume is not retail-driven — it points to potential institutional interest
💡 The Bullish Case
With the technical breakout structure in place and strong confirmation from options flow, the case for a bullish reversal is growing. If MRK can close above wedge resistance with volume, it opens the door to a quick move toward $85+, possibly even higher in the coming weeks.
Disclosure: I am part of Trade Nation's Influencer program and receive a monthly fee for using their TradingView charts in my analysis.

BTC Scalping / Intraday Signal – Entry, Stop & Target Ready!🕒 Timeframe: 15min / 5min
⚠️ Note: Manage your risk — intraday volatility is high.
This is a short-term opportunity, not a long hold.
Disclaimer: This is our personal analysis and not financial advice. Always do your own research before making any investment decisions.
💬 What’s your take on this? Drop your thoughts in the comments and feel free to share this with your friends! ❤️

Gold price recovers above 3300, tariff impact⭐️GOLDEN INFORMATION:
Gold prices (XAU/USD) edged higher to around $3,310 during early Asian trading on Monday, buoyed by renewed demand for safe-haven assets amid lingering tariff uncertainty and heightened geopolitical risks.
Investors remain cautious following fresh tensions between the United States and China, after President Donald Trump accused Beijing of breaching the terms of their trade agreement. This has rattled global markets and lent support to the precious metal. Market participants now turn their attention to the upcoming US ISM Manufacturing PMI report for May, scheduled for release later in the day, which could offer further direction for gold.
⭐️Personal comments NOVA:
US raises tariffs on EU steel, a reminder of quickly negotiated deals, gold prices positive above 3300
⭐️SET UP GOLD PRICE:
🔥SELL GOLD zone : 3335- 3337 SL 3342
TP1: $3328
TP2: $3315
TP3: $3300
🔥BUY GOLD zone: $3289- $3287 SL $3282
TP1: $3297
TP2: $3308
TP3: $3318
⭐️Technical analysis:
Based on technical indicators EMA 34, EMA89 and support resistance areas to set up a reasonable BUY order.
⭐️NOTE:
Note: Nova wishes traders to manage their capital well
- take the number of lots that match your capital
- Takeprofit equal to 4-6% of capital account
- Stoplose equal to 2-3% of capital account

LONG ON USD/JPYUJ has given a choc (change or character) at a major demand zone.
JPY index structure is currently bearish.
I will buying UJ to the next swing high looking to catch 100-200 pips

LONG ON CAD/JPYCADJPY is rising off a major demand zone.
Us tariffs shaking up the JPY in a negative way.
I will be buying this pair looking to catch over 100 pips to the next fvg/supply area.

New BTC ATH, National FOMO💎 Update Plan BTC (May 22)
Notable news about BTC:
Gold prices climbed over 0.50% on renewed safe-haven demand, holding firm above the $3,300 threshold as investor anxiety grows ahead of the U.S. tax bill vote and mounting geopolitical tensions in the Middle East. At the time of writing, XAU/USD trades around $3,317, rebounding from an intraday low of $3,285.
Sentiment remains fragile, with U.S. equity markets slipping into negative territory and Treasury yields ticking higher. All eyes are on the impending vote on President Trump’s tax reform proposal, which the Congressional Budget Office (CBO) estimates could inflate the national debt by approximately $3.8 trillion. Uncertainty around the fiscal outlook continues to fuel demand for gold as a defensive asset.
Technical analysis angle
The question that investors most interested now is when BTC will have 120k?
After the breakdown of channel structure increases around the 108k area, the 113k landmark is the most expected milestone before the price approaches 120k
We still expect a slight adjustment to 108k to continue Long and Target are still 113k and 120k
🔥BTC 4H is currently in the adjustment phase, this time will cause a lot of traders, Future - Margin to lose money, this beat will last until 23-25/5
At this time, whether new or old, should spend more time to practice, load more knowledge about the PTKT, as well as find knowledge posts at the channel ..., to strengthen the solid foundation, as well as avoid losing money at this time offline
==> Comments for trend reference. Wishing investors successfully trading

Can BTC reach new high?Notable news about BTC:
A sudden sell-off in cryptocurrency markets late Monday wiped out earlier gains, with over $500 million in long positions liquidated as Bitcoin (BTC) retreated from weekend highs. The downturn followed easing U.S.-China trade tensions, which appeared to shift investor sentiment away from risk assets.
According to Coinglass, more than $530 million in leveraged long positions were liquidated over the past 24 hours. Bitcoin-related futures accounted for nearly $200 million of that total, while Ether (ETH) products saw around $170 million in liquidations.
Liquidations occur when an exchange forcefully closes a trader’s leveraged position due to a drop in collateral value, typically triggered by sharp market moves. This mechanism kicks in when traders can no longer meet the required margin to sustain their open positions.
Technical analysis angle
As analyzed earlier after the price of BTC breaking the 96k landmark has returned to the period over 100k
Currently, the BTC price is still passing in the 105k resistance stage and the important trend of the trend of increasing at 98k
About 98k continues to consume the trend of this currency
With the current news and price lines, it will still be supporting the increase in the trend
==> Comments for trend reference. Wishing investors successfully trading

HOOD daily chart: breakout or fakeout? Key zone approaching.Robinhood's stock has formed a falling wedge pattern on the daily chart, indicating a potential bullish reversal. The price has broken above the 0.618 Fibonacci level at $44.00, suggesting further upside potential. Next targets are $48.40, $52.79, $58.22, and $67.00. RSI and MACD indicators confirm bullish momentum.
Fundamental Factors:
Robinhood continues to show revenue and profit growth, supporting positive investor sentiment. The company is expanding its services and attracting new users, strengthening its market position.
Scenarios:
Main scenario: continued rise to $48.40, then to $52.79 and higher.
Alternative scenario: pullback to $39.71 with potential decline to $36.00.

LONG ON GBP/NZDGBP/NZD is respecting a major support zone and is currently ready to rise.
I will be buying GBP/NZD to the previous swing high looking to catch 200-300 pips throughout the rest of the week.

ENIC, 1W Trend Reversal Setup and Breakout AnticipationOn the weekly chart of ENIC, a broad expanding triangle formation transitioning into a base accumulation structure is visible. The price is now approaching a critical resistance zone around $3.90–$4.00, an area that previously triggered major reversals. Currently, the market is consolidating just below this resistance, forming a platform for a potential breakout and retest.
Technical structure:
- EMA 50, EMA 100, and EMA 200 are starting to converge, signaling the potential for a bullish crossover — a key indicator of mid-term trend reversal.
- The 0.618 Fibonacci retracement at $3.25 has been broken and price is stabilizing above it, reinforcing the bullish setup.
- Higher lows and higher highs have been established — a clear early sign of a new upward trend.
- Volume during the consolidation phase remains stable without signs of heavy distribution or capitulation.
Fundamental analysis of Enel Chile:
- Sector: Energy, Renewable Energy Transition
- Enel Chile is aggressively expanding into green energy, reducing its coal generation portfolio and investing heavily in solar and wind projects.
- Financials: The company maintains stable dividend payouts and holds a manageable debt-to-cash-flow ratio.
- Chile’s national energy policy shift towards renewable energy and international demand for clean energy solutions provide strong long-term tailwinds.
- Global trends favor companies with sustainable energy models, positioning Enel Chile strategically for growth.
Structural targets:
After a successful breakout above $3.90 and a retest confirmation, the next upside targets are:
- $4.61 (0.382 Fibonacci retracement)
- $5.45 (0.236 Fibonacci retracement)
- Extended channel and Fibonacci target: $6.81
Enel Chile (ENIC) is building a mature base structure for a long-term bullish reversal. A confirmed breakout above $3.90, combined with bullish EMA alignment, would unlock a strong upside scenario toward and beyond $6.00. Both technical formation and fundamentals strongly support this outlook. This is a structure you don't want to miss.

US30 – Monthly Market Structure Analysis (April 2025) – OLHC BUY
As we analyze the monthly structure of the US30 index for April 2025, several key technical developments and strategic insights are worth noting:
1. Monthly Low Established:
The price action for this month has thus far established a significant low, indicating a potential bottoming pattern that may signal the beginning of a bullish move.
2. Key Support Level and First Rejection:
A strong bullish rejection was observed at the 37,000 level, which has proven to be a substantial support zone. This level held firmly, suggesting strong buyer interest and institutional accumulation.
3.Target Projection:
My primary take-profit target for this upward move is projected at **41,834.42** , which aligns with higher timeframe resistance and Fibonacci extension levels. This offers a favorable risk-to-reward scenario for long entries.
4. Waiting for Confirmation:
At present, I am closely monitoring price behavior near a **minor support zone**, where I anticipate another rejection that could provide the ideal entry signal for initiating buy positions. Patience remains key as we await further confirmation.
5. Strategic Considerations:
- Risk Management: Traders are advised to apply proper risk management protocols. Avoid over-leveraging, and ensure your trade size is appropriate to your account equity.
- Discipline: Do not rush into trades. Wait for solid confirmation signals, such as bullish candlestick patterns or momentum shifts, before committing capital.
- Market Conditions: Be aware of upcoming economic events or fundamental news that may impact US indices, and adjust your strategy accordingly.
6. Community Engagement:
If you found this analysis insightful and aligned with your trading view, feel free to like, share, and follow for more structured market updates and trading ideas.
Let’s trade smart, stay patient, and manage risk with precision. All the best this month!

continue to grow, conquer new ATH, XAU⭐️GOLDEN INFORMATION:
US economic data delivered mixed signals. Import prices stayed subdued, while the New York Fed Manufacturing Index outperformed expectations, with several internal components also showing strength. However, inflationary pressures resurfaced as prices paid climbed back into expansionary territory, and the six-month business outlook showed signs of weakening.
Looking ahead, gold traders will closely monitor March Retail Sales and remarks from several Federal Reserve officials, particularly Fed Chair Jerome Powell’s speech on Wednesday. Additional focus will be on upcoming housing figures and weekly Initial Jobless Claims to gauge the broader economic landscape.
⭐️Personal comments NOVA:
After accumulating at the beginning of the week, gold price started to grow strongly reaching 3275 and will continue to move towards the new ATH zone.
⭐️SET UP GOLD PRICE:
🔥SELL GOLD zone : 3288- 3290 SL 3295
TP1: $3270
TP2: $3250
TP3: $3235
🔥BUY GOLD zone: $3167 - $3165 SL $3160
TP1: $3180
TP2: $3200
TP3: $3220
⭐️Technical analysis:
Based on technical indicators EMA 34, EMA89 and support resistance areas to set up a reasonable BUY order.
⭐️NOTE:
Note: Nova wishes traders to manage their capital well
- take the number of lots that match your capital
- Takeprofit equal to 4-6% of capital account
- Stoplose equal to 2-3% of capital account

sideway, keep waiting for new ATH 3271⭐️GOLDEN INFORMATION:
The US Dollar (USD) continues to face headwinds, failing to mount a meaningful rebound from its lowest level since April 2022, hit last Friday. Lingering concerns over the economic consequences of sweeping tariffs have fueled recession fears, while growing expectations that the Federal Reserve (Fed) will soon restart its rate-cutting cycle keep USD bulls on the back foot. This environment continues to favor the non-yielding Gold, offering support to XAU/USD. However, a temporary tariff reprieve announced by President Trump has helped lift overall market sentiment, potentially limiting further gains in bullion.
⭐️Personal comments NOVA:
No news at the beginning of the week, gold price is sideways waiting for price increase and continue to create new ATH
⭐️SET UP GOLD PRICE:
🔥SELL GOLD zone : 3271- 3273 SL 3277
TP1: $3260
TP2: $3250
TP3: $3240
🔥SELL GOLD zone : 3244- 3246 SL 3250 scalping
TP1: $3240
TP2: $3230
TP3: $3220
🔥BUY GOLD zone: $3189 - $3187 SL $3182
TP1: $3195
TP2: $3210
TP3: $3225
⭐️Technical analysis:
Based on technical indicators EMA 34, EMA89 and support resistance areas to set up a reasonable BUY order.
⭐️NOTE:
Note: Nova wishes traders to manage their capital well
- take the number of lots that match your capital
- Takeprofit equal to 4-6% of capital account
- Stoplose equal to 2-3% of capital account

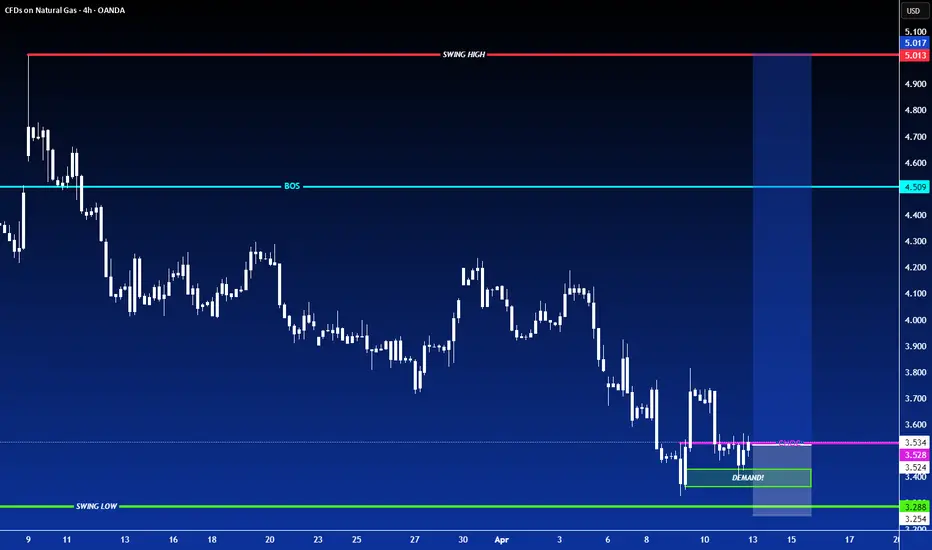
LONG ON NATURAL GASNATGASUSD
Natural gas has finished its pullback to the downside within its overall uptrend.
Price has given us a choc (change of character) to the upside and has also pulled back to a strong demand area.
I expect price to rise majorly on Gas to the next supply level.
keep aiming for new ATH next week✍️ NOVA hello everyone, Let's comment on gold price next week from 04/14/2025 - 04/18/2025
🔥 World situation:
Gold extended its remarkable rally for a third consecutive session on Friday, surging to a fresh record high of $3,245 amid intensifying US–China trade tensions. The precious metal posted impressive gains of over 2% as fears of a prolonged trade war and its potential fallout on the global economy sent investors flocking to safe-haven assets. At the time of writing, XAU/USD is trading around $3,233.
The North American session saw China retaliate with a 125% tariff on US imports, following President Donald Trump’s move to raise tariffs on Chinese goods to 145%. The heightened geopolitical strain triggered a flight to safety, propelling Gold higher. Further fueling the rally was a sharp decline in the US Dollar, which tumbled to a near three-year low, with the US Dollar Index (DXY) falling to 99.01.
🔥 Identify:
The huge growth shows no signs of stopping, gold prices continue to benefit from tariff policies, continue to find new ATH early next week
🔥 Technically:
Based on the resistance and support areas of the gold price according to the H4 frame, NOVA identifies the important key areas as follows:
Resistance: $3255, $3280
Support : $3157, $3070
🔥 NOTE:
Note: Nova wishes traders to manage their capital well
- take the number of lots that match your capital
- Takeprofit equal to 4-6% of capital account
- Stoplose equal to 2-3% of capital account
- The winner is the one who sticks with the market the longest


LONG ON GBP/CHFGBP/CHF Has a Perfect Double bottom pattern at a major demand area.
Price has broken the neckline of the double top and is currently pulling back to sweep liquidity and balance out price at any FVG's (Fair Value Gaps)
Liquidity sits behind the 2 wicks on the double bottom, so price may sweep that BEFORE rising.
Must give you stop loss space behind the wicks to survive the trade.
I have a buy limit order setup to take advantage of the pullback which will place me in the trade at discount price.
From there im looking to catch 300 pips to the previous swing high.

growth - new ATH - gold hits 3246⭐️GOLDEN INFORMATION:
Trump announced Wednesday that tariffs would be temporarily reduced for dozens of countries, offering a short-term reprieve. However, he simultaneously hiked tariffs on Chinese imports to 125% with immediate effect, following Beijing’s retaliatory move to impose 84% duties on US goods. The escalating trade conflict between the world’s two largest economies has reignited concerns over global growth, prompting investors to seek refuge in safe-haven assets like Gold.
“Gold is reclaiming its safe-haven status and appears poised to chart fresh all-time highs,” said Nikos Tzabouras, Senior Market Analyst.
Meanwhile, scaled-back expectations for aggressive Federal Reserve rate cuts could lend support to the US Dollar, potentially limiting gains for the USD-priced metal. That said, traders still anticipate the Fed will begin easing in June, with markets pricing in a full percentage point of rate reductions by year-end.
⭐️Personal comments NOVA:
Gold price continues to increase greatly, the fomo market and attention are focused on the gold investment channel: safe, continue to find new ATH zones
⭐️SET UP GOLD PRICE:
🔥SELL GOLD zone : 3245- 3247 SL 3252
TP1: $3230
TP2: $3210
TP3: $3190
🔥BUY GOLD zone: $3168 - $3166 SL $3163 scalping
TP1: $3175
TP2: $3183
TP3: $3190
🔥BUY GOLD zone: $3134 - $3132 SL $3127
TP1: $3145
TP2: $3160
TP3: $3175
⭐️Technical analysis:
Based on technical indicators EMA 34, EMA89 and support resistance areas to set up a reasonable BUY order.
⭐️NOTE:
Note: Nova wishes traders to manage their capital well
- take the number of lots that match your capital
- Takeprofit equal to 4-6% of capital account
- Stoplose equal to 2-3% of capital account

LONG ON GBP/AUDGPB/AUD Has dropped to a nice demand level and has given a change of character on the lower timeframe.
I will be buying GBP/AUD expecting it to reach the nearest supply level for 400-600 pips.

LONG ON CAD/JPYCAD/JPY is respecting a major demand area/zone
It has given a inverse head and shoulders in the recent pass, and now a double bottom at the same zone.
I will be buying this pair as a market order aiming for the next level of resistance/liquidity.
