XAUUSDOANDA:XAUUSD
I have been anticipating thing bullish move.I hope it goes beyond the 1860.00.
On the D1 TIMEFRAGOLD can reach the 1860s.
I hope the BUYERS will keep raising the price.
The bought low and SELLERS will have to dig deep to Sell this current price.
Buysignal

EURGBP - Trade Setupin todays LONDON session i like to Buy EURGBP again , and lets try my earlier EURGBP buy idea again this time .
Hope for the best ,
Do not excited , be careful of your Risk

GOLD SetUP (After FED)After the Fed speaker, we adjust the direction of gold positions.
I personally traded sells for buys.
Smooth DXY
Bullish stocks
Bullish GOLD

ETH Breaks Through Resistance! What's Next?In this post I'm going to cover important support/resistance levels on Ethereum and where I think we're going from here.
As you can see from our last post, ETH rejected perfectly off of the 1229 level and hit our support of 1150 to the tee on Nov 28th! Since then, it's been on a steady uptrend and recently broke that 1229 level and exploded to 1300!
The next big resistance I'm looking at is 1367. This was the previous resistance for most of Oct and I can see us rejecting there at least once. Right now we can see the Wave Fusion indicator flashed two Blood Moons which took us from 1315 to 1280. Right now I'm looking at 1274 as being the micro support on the hourly as it also coincides with the trendline support. If that breaks, I'm looking at 1229 to act as our new MAJOR support as it was resistance 3 times in the past week. If we end up breaking that, then I'm afraid we could go all the way down to 1150 again.
I'm waiting for a buy signal on Wave Fusion before pulling the trigger but closely watching the three support levels mentioned above.
If you have any questions on my technical analysis or indicators used, please leave a comment below or send me a PM :)
Thanks for reading!

PRADEEP PHOSPHATES Swing Up TrendNow 56.75
if Break Out Above 58
Next Swing Exit 68, Medium Exit - Hold
Risk Below 55

FTM Pumps Higher! What Levels Are Next? FTM has been quite the outperformer today pumping more than 15% and leading the charts on Coinmarketcap! Let's take a deep dive into some technical analysis and where my current targets lie:
1. Looking at the 12h chart for Fantom, we can see the Whales buy-sell indicator flashed a buy and combined with our RSI that was also over the signal line, that gave us our entry at 0.18. Since then, it's pumped over 33% :)
2. The next big resistance level for FTM is 0.245. This coincides with our previous resistance on Oct 31st. I'm watching this level closely and starting to take profits as we are very over-extended. I would look towards the 0.21 level if you're thinking of entering. That was key support on Oct 28th and was previous resistance turned support on Nov 11th. If it falls through that, then 0.19 is your next bet as it was previous resistance turned support on Nov 16th.
3. I believe FTM still has room to run this year as Andre (founder of Fantom) has been publishing various articles confirming it's longevity and continued progression in the space.
If you enjoyed my TA, please give this article a boost to help spread to the masses! And if you have any questions about my TA or indicators used, leave a comment please or send me a PM :)
Thanks for reading!

US Market – Long, Mid & Short-Term ViewHow to formulate investing and trading ideas for the long, mid and short-term within one single market? In this tutorial, we are using S&P.
What you are about to learn can be applied to all markets.
Markets are giving us many confusing signals with Dow Jones. According to CNN report, it enjoyed its best month in nearly a half-century in October and it’s up nearly another 3% in November.
Whereas Nasdaq and many other stocks are very much still in their negative zone for the year.
Also, the Fed’s policy is not very encouraging, with their priority to curb inflation with higher interest extending to next year than to pause it so as to revive the economy.
So, with all these confusing signals, we are going to learn how to derive:
Content:
• Long-term view with week
• Mid-term view with day
• Short-term view with 15min
E-Mini S&P
Minimum fluctuation
0.25 point = $12.50
1 point = $50
10 points = $500
I have started this trading series, the purpose is for “Investing & Trading into Longevity”. And again these strategies shared, they can be applied to most markets.
Disclaimer:
• What presented here is not a recommendation, please consult your licensed broker.
• Our mission is to create lateral thinking skills for every investor and trader, knowing when to take a calculated risk with market uncertainty and a bolder risk when opportunity arises.
CME Real-time Market Data help identify trading set-ups in real-time and express my market views. If you have futures in your trading portfolio, you can check out on CME Group data plans available that suit your trading needs www.tradingview.com

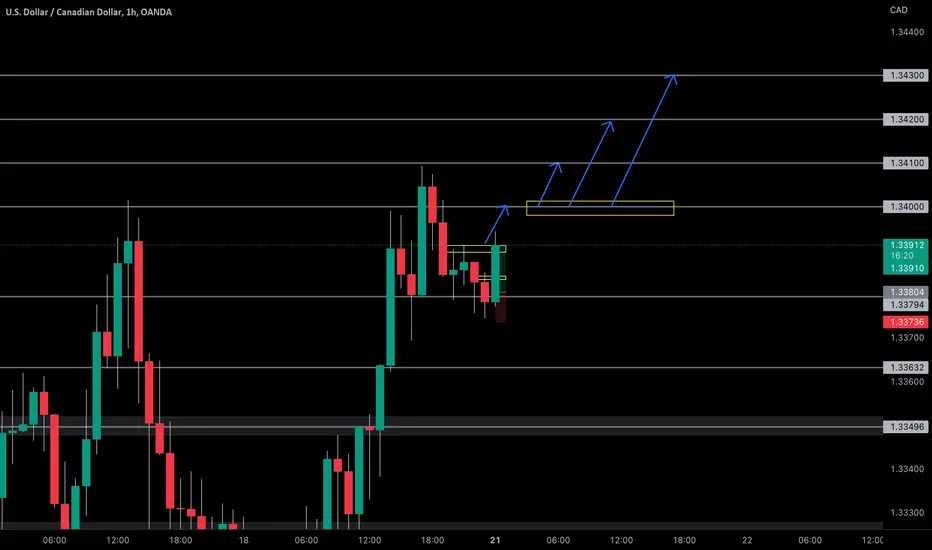
USDCAD - Trade SetupHello dear fellows , In todays session i might trade in USDCAD , as we saw yesterday it played v well against CAD , and chances are CAD might remain under pressure . we got nice discount in early Asian session . Risk is pretty affordable .
Trade with risk Management . Best of Luck !

EURGBP - Trade SetupHello dear fellows , i am planing to Buy EURGBP in todays trading session , i will try to keep in position till 2nd target at least and if this will move nicely then might be i close my some position at 3rd target . Trade is less risky and logical for buying .
anyways , you keep take care of your risk and trade sensibly not emotionally .
Best of Luck !

AUDUSD BULLISHIt has been oversold since last week , picking up some last minute wells. I see it pushing up as it has created a low that it’s refusing to break

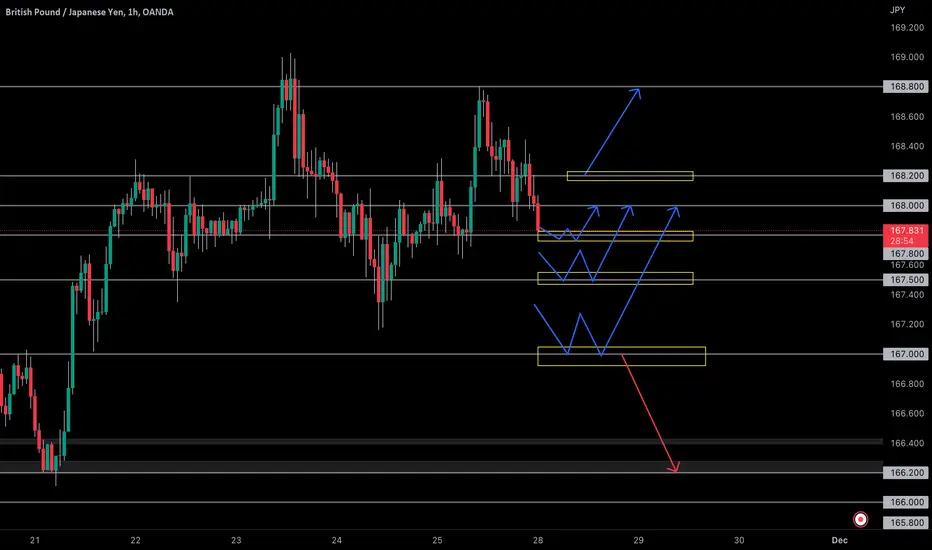
GBPJPY SetUPBuys above 167.000
+
JPY weakness
+
Also EURJPY strength
╔═╦╗╔╦╗╔═╦═╦╦╦╦╗╔═╗
║╚╣║║║╚╣╚╣╔╣╔╣║╚╣═╣
╠╗║╚╝║║╠╗║╚╣║║║║║═╣
╚═╩══╩═╩═╩═╩╝╚╩═╩═╝

Buy GBPUSDHello traders,
GBPUSD has also confirmed a possible bullish move by taking out the sell-side liquidity for Friday.
Grab some pips to the upside

Swiss Re (SREN.vx) bullish scenario:The technical figure Channel Down can be found in the daily chart in the US company Swiss Re (SREN.vx). Swiss Reinsurance Company Ltd, commonly known as Swiss Re, is a reinsurance company based in Zurich, Switzerland. It is one of the world's largest reinsurers, as measured by net premiums written. Swiss Re operates through offices in more than 25 countries and was ranked 118th in Forbes Global 2000 leading companies list in 2016.It was also ranked 313th on the Fortune Global 500 in 2015. The Channel Down broke through the resistance line on 24/11/2022. If the price holds above this level, you can have a possible bullish price movement with a forecast for the next 60 days towards 85.64 CHF. Your stop-loss order, according to experts, should be placed at 68.16 CHF if you decide to enter this position.
Swiss Re's stock is up by 2.9% over the past three months. Given that the markets usually pay for the long-term financial health of a company, we wonder if the current momentum in the share price will keep up, given that the company's financials don't look very promising.
Risk Disclosure: Trading Foreign Exchange (Forex) and Contracts of Difference (CFD's) carries a high level of risk. By registering and signing up, any client affirms their understanding of their own personal accountability for all transactions performed within their account and recognizes the risks associated with trading on such markets and on such sites. Furthermore, one understands that the company carries zero influence over transactions, markets, and trading signals, therefore, cannot be held liable nor guarantee any profits or losses.

GBPJPY SetUPGBPJPY SETUP
Continue WITH the BUYS
╔═╦╗╔╦╗╔═╦═╦╦╦╦╗╔═╗
║╚╣║║║╚╣╚╣╔╣╔╣║╚╣═╣
╠╗║╚╝║║╠╗║╚╣║║║║║═╣
╚═╩══╩═╩═╩═╩╝╚╩═╩═╝
COALINDIA1!27-11
Daily chart of COALINDIA1!
Manual trend and 200 EMA are bullish
Candles seem to be taking support on the manual trendline
support at 209.50 (manual) and 207.20 (200 EMA)
resistance at 239.80 and 263.90.
Can expect that the highs of 263+ will be tested if the resistance at 240 is breached.

USDCAD trade SetupToday i might buy in USDCAD pair , as we can see we have nice Higher Low formation and prev week support is near , dollar could pick some momentum in todays session ,
anyway trade with Risk Management , Best of Luck !

OIL : Long SetupIn todays trading session i will be looking for Buy Oil , If it makes any dip it will be better to increase volume, Trade idea based on Prev day closing , it is very good sign of taking Buy Risk now .
anyways , best of Luck . Take Risk affordable !

I'm bullish on Bitcoin This is my Bitcoin long entry.I called the top when bitcoin was trading at 67k & this is the Bottom 😊
You are welcome !!

USD/JPY Trade setup.Looking at this trade setup on USD/JPY is setting up for a buy opportunity if price continues to show strong buying momentum, pushing the sellers out of the equation. You will notice 4 to 5 touches that price makes from price creating support to price breaking it then re-testing that same area which then becomes resistance. Price was in a phase of consolidation/indecision before creating a minor area of support which adds more confirmations to my confluence for a long opportunity. Watching 140.700 area. Updates on this setup will be posted throughout the trading week or for each upcoming trading sessions.

USD / JPY Bullish PotentialBullish Idea:
Fundemental analysis shows that the USD is strong and JPY is weak accross the Daily Timeframe which gives us a reason to believe it has Bullish potential given the right circumstances on the Technical front; which it does.
The price broke through last weeks consistent 140.800 Resistance area on its third attempt and now i a looking for a retracement back to the line to test it for potential buyers to go Long.
If we get the buyers and push through to the upside (following the very long term trend ) we can hopefully see a push up to the next major resistance of the 145.000 Mark.
- Risk to Reward of 3.25 lending high returns and low risk.
- Trade should take across a majority of the trading week ahead.
- Break and Re-test of Resistance turned potential Support level.
- Note to never risk more than 1-3% of your account on any given trade.
Please form your own research but I hope this can give some advice or fuel for ideas to be generated.
Thanks for taking the time to read my idea <3 .

USDCAD BUYSHey everyone this is my first trade of the week I'm playing Dollar firm and CAD wicker.
I'm expecting dollar firm and USDCAD at 1.34-1.34100-1.34300
GBPUSD OLHC (BUYS) YEARLY STRUCTURE (NOVEMBER 2022)GBPUSD OLHC (BUYS)
YEARLY STRUCTURE
(NOVEMBER 2022)
YEARLY STRUCTURE ( MONTHLY TIMEFRAME )
Please support this idea with LIKE if you find it useful..
Three Important keys to look out for.
1. Market Structure (OLHC)
2. Bullish Divergence
3. TDI Cross ( Bullish Cross)`
GBPCHF in the monthly timeframe for the yearly structure is OLHC, Buy setup.
Bullish Divergence from 02 January 2017 to current yearly low.
TDI cross also indicates that Buyers are present in market. Find buy entries in lower timeframe. All runner Take Profit to Monthly Open 1.34256.
Trade with Caution. Wait for valid entries.
Please support this idea with LIKE if you find it useful.
P A T I E N C E + D I S C I P L I N E

US30 OLHC (BUYS) YEARLY STRUCTURE (NOVEMBER 2022)US30 OLHC (BUYS)
YEARLY STRUCTURE
(NOVEMBER 2022)
YEARLY STRUCTURE ( MONTHLY TIMEFRAME )
Please support this idea with LIKE if you find it useful..
Three Important keys to look out for.
1. Market Structure (OLHC)
2. Bullish Divergence
3. TDI Cross ( Bullish Cross)
Market structure for US30 for this current year 2022 in the monthly timeframe is OLHC (Buy Setup).
There's also a strong Bullish Divergence from 02 November 2020 to current yearly low.
TDI cross has also confirmed the presence of Buyers in markets. Find Buy entries in lower timeframe and hold runners till monthly open 35078 as Take Profit.
Trade with Caution. Wait for valid entries.
Please support this idea with LIKE if you find it useful.
P A T I E N C E + D I S C I P L I N E
