Buysignal

Possible Uptrend start on LTCUSDT I have a confirmation of BUY signal on LTC on Weekly chart
So its probable a new uptrend start

gold looking for update up trend soonwe are waiting gold to be little down to go up from support zone may be after few days it starts growing

BTC/USDT Buy at 21253Price pulled back to an important demand zone and then showed strong buying pressure.
Entry:
SL:
TP:
Will keep you guys updated on the progress

+159 % PROFIT DONE IN 48 HOURS 🔥SPOT TRADING
BAND-USDT
BUY : 1.24$
SELL : 3.17$
(((PROFIT: 159% DONE)))✅✅✅
all Targets hit successfully

Is $CPRX ready to break out of its cup and handle?Notes:
* Strong up trend
* Okay earnings track record
* Basing for the past ~8 weeks
* Pulled back to its 10 week line and managed to hold it as support creating a cup and handle pattern
* Printed a pocket pivot near its 50 day line offering an early entry and indicating institutional demand
Technicals:
Sector: Healthcare - Biotechnology
Relative Strength vs. Sector: 23.86
Relative Strength vs. SP500: 4.28
U/D Ratio: 1.21
Base Depth: 45.07%
Distance from breakout buy point: -18.82%
Volume 14.75% above its 15 day avg.
Trade Idea:
* You can enter now as the price is rising with higher than average volume off of its 50 EMA
* Another reason for entering would be that it printed a pocket pivot
* If you want to play it a bit safe you can wait for a break out of the indicated channel and the 14.3 area since that may serve as immediate resistance

AUDUSD BUYThis is a Fair Value Gap within a 5 minute Order Block. If price retraces back to this POI, I am expecting a short term rally to take out the buy side liquidity. This is a countertrend trade so I'll risk a fraction of what I normally risk for a trade.

ETHUSDTHi guys
It looks like Ethereum is ready to start an uptrend, doesn't it?
The price range is maintained at $1178.13. Pay attention to Qazmer Zang's flash. On the other hand, we have Gartley's harmonic pattern, which can be attractive by maintaining the support range!
If the descending channel is broken upwards, there is a high probability of forming an upward trend similar to the scenario.
Keep in mind that if we lose the support range, this mindset will be weakened!
What do you think?

EMini /ES Futures Spooky Long setupFellow traders,
If the full moon tonight excites the animal within - I propose taking a look at the S&P500 daily chart... (although this is a 2hr chart for detail ;) Full bullish structure, a balance day after Friday's strong push. MA's are strong and previous price structure resembles a possible strong move to 4000
This entry isn't prime quality - I would like to enter cheaper, in fact I may just wait for 3820, but price action doesn't look like it will allow it and I get a hunch we may move higher quickly. My confidence in the up move this week outweighs hesitation.
Lets not forget the ghastly Fed meeting on Wednesday. Any shift in the Fed's ominous tone on the plan to increase interest rates in the future could create a lot of supernatural buying pressure - in fact that is what the charts are resonating to me.
If it's a treat I'm in. I'll comment if I raise the order in the morning. The plan will be to leave it valid for 2 days, I'm sure we will get a quick flash lower to that level.. *nod to zombie news traders finding liquidity lower before the blast higher.
Happy Halloween 2022! Trick-er-treat ES, you got Reeses Cups or Candy Corn?


AUDCAD long BUYAUDCAD buy signal
Downtrend The END
retest lower line and break through upper big trendline

BUY PayPal LONGBUY BUY BUY paypal stock is in lowest price now
Stop Loss price is 76$
Take Profist so far from here, Itsd GREEN LINE
So BUY

EURUSD buy LONGEURUSD long entry from green support zone
Narrow stop loss, stop loss is under the 1h uptrend line

Is $PRCT ready to move higher from here?Notes:
* Steady up trend in a bear market
* Nice earnings for the past to quarters
* Recent IPO
* Looking to break above its IPO base
* Printed a pocket pivot, indicating institutional buying
* Offering an early entry relative to its 50 day line
* Sitting just above a pivotal level of 43.9 and holding it as support for the past several sessions
* IPO base resistance comes in around 47.7
Technicals:
Sector: Healthcare - Medical Devices
Relative Strength vs. Sector: 15.62
Relative Strength vs. SP500: 4.68
U/D Ratio: 1.1
Base Depth: 182.59%
Distance from breakout buy point: -4.82%
Volume 54.55% above its 15 day avg.
Trade Idea:
* You can enter now as the volume and price are indicating of it moving higher from here.
* If you want to be a bit more safe, you can wait till after earnings

BTCUSDT range zone breakout to the upside and heavy pump aheadAs we can see price is bounded here with the range zone but soon resistance will break and a heavy pump to the upside after that is expected.
targets and resistances are also mentioned on the chart.
((press like👍 if you enjoy + comment your opinion about the market or your thoughts, below this analysis))

BTC monthly candle going to close soon!BTC going to close its monthly candle above the all 4 months before, that's interesting... :)
I think 30k can get tested in the next months if that candle closes above the 20k.

Pharma Alert.! Another rally or Trap.?NSE:CNXPHARMA
According to my analysis this breakout in the nifty pharma sector can give a rally upto 11% in coming months which will overall help the pharma stocks to boost and bring back them in this market where evryone is underestimating the power of pharma sector in the long run. but this is how ever a short term view on the pharma sector. what is the mid term view on pharma sector?, it shows me that higher levels will be tested and there can be a fall in the name of recession period to the level of 7000's. all the best i hope it was helpfull.

BTC USDTAdam & Eve ı see an opportunity to take a bite from forbidden apple !! This is not a financial advisment only my thoughts
Dxy and Btc negatif corelation, Dxy gives better graphic formation much smooth than btc
Fed Decision near

AAPL: Time to buy!Today, AAPL just released its newest Q3 earnings report, beating both expectations for earnings and revenue. The company reported 1.29 earnings per share, compared to the prediction of 1.269 by analysts, and reported 90.14 Bil of revenue, beating expectations of 88.74 Bil. Although there was less growth in IPhone sales, all other aspects of the company look quite optimistic. In the face of a wave of earnings compression, Apple is doing surprising well. Now, I consider myself to be an investor and not a trader, but in order to fine-tune my entry, technicals are needed. As Apple's stock price just hit support at ~$145, boosted by positive earnings, we could see a buying wave in the next few months or so.
Boost this idea for it to reach other investors!

TOP US-Stocks: Buy-Signal DARDarling Ingredients - a stock on our watchlist - just moved through a well defined pivot point and triggered a buy signal. We have added DAR to our model portfolio.
DAR fulfills all requirements as defined in Minervini's Trend-Template and shows stable fundamentals. DAR is coming out of a long consolidation phase and a sound volatility contraction pattern. The entry at 78.7 is a low risk entry, the SL can be set just under the latest base at 72.7 (7.5% risk)

USDJPY at major support!!While the price to turn around as has approached a major support , so expect at least 100 pips long taking just 20 stop loss.
❤️ If you find this helpful and want more FREE forecasts in Trading View
Be sure to leave a comment; let us know how you see this opportunity and forecast.
❤️ Your support is very much 🙏 appreciated!❤️

EUR JPY strong buy signalHello, as you can see from the chart, we have a pretty strong level.The price repels him, and gives us the opportunity to buy.

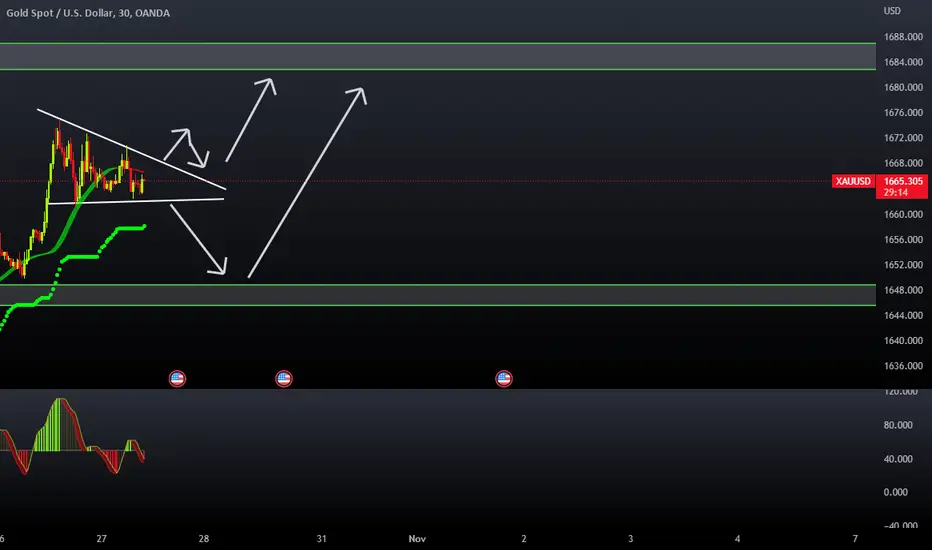
XAUUSD still in Buying zone!!While the price is above the support ,expecting the price to fail the triangle and move in upward direction and hit around 1684 or above. If it breaks the pattern we got major support around 1644-1648.
❤️ If you find this helpful and want more FREE forecasts in Trading View
Be sure to leave a comment; let us know how you see this opportunity and forecast.
❤️ Your support is very much 🙏 appreciated!❤️