Buythedip

$39,444 target for bitcoin in the next 24-72 hours If this breakout holds as support this is my target over the next 24-72 hours going into Friday, which I'll be selling going into Monday then buying the dip.
Promising Project Bad Timing To start this chart looks great, looks...
There are currently 46.6M coins in the circulating supply.
Starting tomorrow ~2 hours from now the remaining ~442M coins will be unlocked and distributed to SAFT Investors, Validators and Founders.
(The Solana team likes to say they are transparent, but information given here: solana.com is severly lacking)
A large portion of these coins will locked from trading for the upwards of two year, needless to say the coin supply will still be diluted starting tomorrow.
I personally will be entering a large position, after the market crashes, laddering into my position.
(I'm already in a small position presuming I've interpreted their transparency report incorrectly)
Good Luck and Safe Trading.

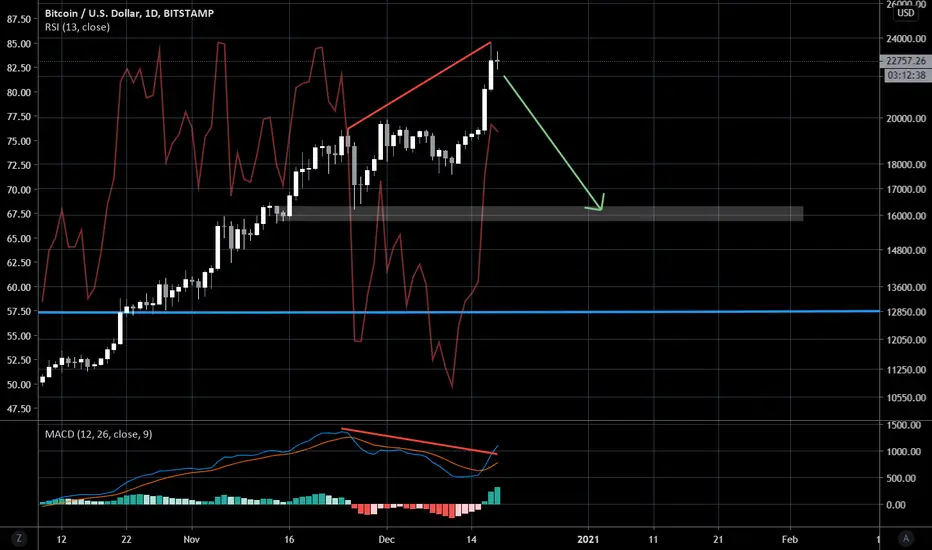
BITCOIN CRASH TODAY?? - Bearish setupHey there,
Please support this idea with your likes, follow me and
comment down below what you think.
Read the text on my chart for more information.
Bitcoin has heavy resistance around the 30k level and
eventhough I would normally not go short in a bull market,
I initiated a short position.
Risk to reward is just too good for shorting up here.
I WILL BUY THE DIP THOUGH!.
20k is final imo. Think we can bounce already in the 21-22k level!
Cheers,
Konrad

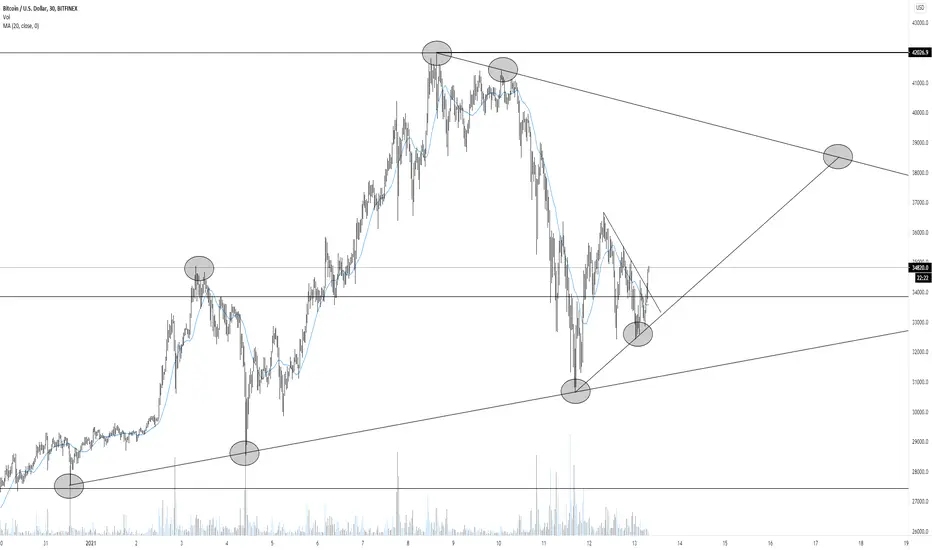
BTC will make a -30% correction ritual👀Historically, $BTC always made around -30% correction, even in a bull market
Buying All the DipsKraft Heinz chart screaming "buy our dips" !
This Buffet darling has taken a serious beating since inception, crashing as low as -80% off the all time high. Buying after an 80% crash is generally the right time to begin accumulating an asset if you believe it has long term potential. Evidence of accumulation is also bolstered by the clean H&S bottom forming with lots of volume being traded down at these levels, as evidenced by the volume profile visual range.
Other bullish developments include the 200 dma flattening and beginning to slope up for the first time since the multiyear downtrend began. Additionally, if we invert the chart, we see an incredibly clean topping pattern that is just begging to crash lower and fill the gap.
For these reasons I'm long looking for the gap fill and a move to the .382 fib of entire chart range. I took a position in some relatively cheap long calls, will update this post before they expire. Happy trading!

Ethereum headed down to $400-$500. Buying opportunities ahead.We've hit a weekly timeframe support level which price seems to be have a hard time going though. Dropping down to the 1-hour chart I've drawn in several tools to help determine best for my next course of action and that's to wait for ETH can reach the $400-$500 again so I can buy up.
Price since hitting the weekly resistance zone has present price reaction in a bearish patter as you can see within the channel in purple I've drawn in. Steam seems to be running out so I anticipate a quick drop down into my demand zone and then possibly moving back up from there.
I would love to hear your thoughts guys on this and let me know if I could add anything. Much love and peace to all of you.


VET Correction: The Bearish Gift That Keeps GivingMy Fellow Crypto Traders,
Appreciate you taking the time to view my analysis which I hope you may find beneficial. Please be sure to “LIKE” if you indeed find my analysis useful and/or find my analysis intriguing.
Cheers & Happy Trading!
-----------------------------------------------------------------------------------------------------------------------------------------
ANALYSIS:
The entire market is entering a phase of correction. However, VET could a solid BTFD swing trade as it has formed a parallel trading channel and has hit the lower wall. As VET keeps solving real-world problems with blockchain tech, thus broadening the possibility of top tier partnerships.

$BTC / USD 4H "Can chop longer than you can stay sane" ~$18K dip$BTC / USD 4H Chart
- no indicators
- support levels in green
- resistance levels in red
Bitcoin pushing a breakout of the historic $20K all time high. No need to fight the clear trend here, but try to avoid getting chopped up. I think there is potential for Bitcoin to range around $18K (white box on chart) for a little while before retesting the top of the channel. Chop trading plan - buy the dip around lower $18Ks, ideally play the ATH breakout with a retest of around $20K and then the real fun begins.

Yes, it is actually the start of the bull!Hello traders,
hello hodlers,
my last chart analysis got the title:
"Finally the end of the bear, start of the bull?"
And now, we can say for sure - it is the start of something big! :)
But, don´t get me wrong... Even in this bull market, which easy can take 12 - 18 month from now, we will see major rejections and downswings of 30 or even 40%.
Those times will be perfect to re-enter, if you want to.
The next few weeks, what i see in the chart and market sentiment:
- we are a little over extended, look at the RSI
- we are currently 38% above the 21 week EMA
- we are near the old ATH, just a few more percent (around 15%)
- we changed the massive resistance level of 14k to support - which is enormes good!
Iám not a trader, but if i had to choose the next good point to sell, i would wait until the weekly resistance of the ATH (red dotted).
And after that, i would buy at the next 21 week ema (yellow line, always rising) touch. This could be around 13,800 USD depending on how long it will take, until we see the next down move.
But yeah ... "buy the dip" :)
I´am will only buy. I will not sell, just for the simple reason, that there is no guarantee for a cheap re-entry.
I will not risk my position!
------------
This is no financial advice, iám not your financial advisor. Only my opinion, my thoughts.
Take your own risks, on your own choices.

ZM Buy the Dip PotentialOversold trend may be reversing. If Biden comes into office, potential for more near term lockdowns and continued work from home trends/companies to pick back up
DYOR and place your bets...

Bitcoin respects these two Weekly Moving Averages* In Bullmarkets we never close below the 21 Weekly EMA
* In the whole history of Bitcoin, we never closed below the 200 Weekly SMA
The simplest strategy to "buy the dips". Period.


TSLA ProjectionI think a buy the dip scenario is coming up soon on TSLA. I will be buying Nov 20 calls on any dip on Monday

The Finishing Moves For This WeekAfter putting up my initial buckshot for the next month, some movement has come into picture. I have Minor wave 1 ended on September 30 at 1400 which had it last just over 31 trading hours. This is 3 trading days earlier than my last forecast. This could mean I am wrong now, was previously, am still wrong, or most of my original forecast has slipped left and the marks will occur sooner than originally projected. A three day slide now brings the market top to the day of or day prior to Election Day 2020. This is absolutely possible with the likely unknowns set to occur November 3. We could be holding our breath for an outcome longer than we might have expected.
I have forecasted Minor wave 2's movement which are set to find its bottom before the end of this week. Minor wave 2's for the index tend to retrace the length of wave 1 by 33-68%. A 40% retracement is closer to the mean and average while remaining conservative. This conservative estimate would have Minor wave 2 last around 12 hours. Another significant statistic is that wave 1 is around 1.84 times the length of wave 2 which equates to roughly 14.5 hours for this wave 2. Lastly, Minor wave 1 tends to make up 22% of the length of the larger wave (Intermediate wave 5) it resides inside. Likewise, wave 2 makes up around 9.5% of that larger wave. Based on wave 1's length and possible contribution to the larger wave, Intermediate wave 5 could last around 145 hours and wave 2 could be 13 of them (SIDENOTE: 145 hours ends on October 22). I am projecting Minor wave 2 to last around 13.4 hours.
The movement for Minor wave 2 seemed much less complex to locate. A fairly common wave 2 retracement is around 38% which is also near the common Fibonacci retracement of 38.2%. This could have wave 2 drop 69.96 points. Wave 1's movement in relation to the total movement of its larger Intermediate wave is around 45% while wave 2 is around 17%. This could mean Intermediate wave 5 gains around 409.13 points and Minor wave 2 only drops 69.55 (SIDENOTE: 409.13 points puts the top around 3618.58). Lastly, wave 1 tends to move 2.37 times wave 2 which could see a 77.68 point drop for Minor wave 2. I am forecasting a drop of roughly 70.56.
Based on the forecasts, I have further attempted to identify the movement of Minute waves A, B, and C. Wave A tends to make up 35.54% of the larger wave's movement while B makes up 28.13% and C is 37.24%. Wave A tends to move 73.86% of the overall move, while B reverses course for 44.60% and C is 67.83%. I have placed the A, B, and 2 (Minor wave C) roughly when and where the waves should change course. This is setting up for a truly great entry point to "buy the dip."
Minor wave 3 begins next week and could make for a few weeks of major gains. The catalyst? COVID stimulus is not dead yet and could find an agreement before Congressional recess this weekend or early next week.

Path to NEW ATHs Before Election DayThis is the estimated track to election day. The downside should be behind us. Each Minor wave is based on its average make-up of the larger wave it is apart of. Each Minute wave inside of the Minors is the same concept. I will continue to publish and adjust as we complete each wave.
This is just the initial blueprint.

Natural Gas - Buy the BloodNatural Gas has no reason to not trade higher than $2.7. On long time frames, it has already long since turtle souped the $1.6 low. There's a nice fat previous high right below a big figure at $2.9.
$1.85 is where you want to see it, and expect to see it do what GBPJPY just did on the four hour. You even have the luxury of a tight stop and a huge RR.

Big dip in store for NIO?Still opportunity for NIO stock price to rise further before the RSI becomes oversold and the price dips below the 21 week average again at which point it will be another good opportunity to buy this well performing stock.

Buy the dip opportunity for Apple AAPLApple AAPL stocks could continue to dip before rising again giving buyers a good opportunity for profit over the coming months. There is a lot of volume waiting for the price to dip lower.

This is how the week should play out.My initial projection from last weekend had Minor Wave B ending by the lunch hour on September 17. With more data, my projection has moved to the right a bit.
It looks like the Fed press conference ending Minute wave A and we are in the early stages of Minute wave B. Fortunately it should be short lived. I project this to end with a bottom around 3360 with about 3 hours left to trade on September 17.
Based on hitting that specific mark, I am projecting Minute wave C and ultimately Minor wave B to end around 3470 about one day later. I am still projecting the next down swing to begin before the week ends.
Another looser projection is the end of Minor wave B based solely on Minor wave A's movement. This has Minor wave B ending near the close of trade on September 17. I no longer assess this spot to be the end.
I will write again this weekend, but I am still bearish for the next two weeks before we are ready to test the ATH in mid to late October.
Follow and stay tuned for more!

Buy the rumor sell the news!!EVFM Chart analysis. EVFM is currently at support, possibly a good swing idea up to resistance!
