BVSP
Correction on IBOVI've been wating for this correction for while, ibov has been overbought for at least 8 days. In those same last 8 days, following a trend of USA markets, ibov got caught in a range of 2%, which made trade on it very hard. But i think we are about to see a correction that will create a great opportunity to go long again. Targets are shown by the white lines (hope the price find support at orange 22 EMA), and "idea" stop is the red line. Don't want to trade this idea, but rather wait to it happen and then go long for a less risky trade.
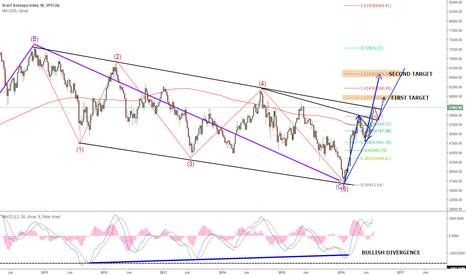
BOVESPA BREAKING MONTLY CORRECTION?Bovespa has completed a complex 5 wave structure to the downside and seems ready to break the montly correction. I'm expecting the completion of an ABC pattern to the upside to break the last trendline of that stucture. Bullish divergence on weekly. Look at the comment to see a snapshot for the monthly general structure.
Brazilian Bovespa Index: Long Term Fairly high probability we see the Bovespa index trade to the downside. This is a great trade because it presents us with multiple opportunities if the stop gets triggered (with a close on the weekly time frame).
Pay Attention to the correlation between USDBRL and Bovespa Index - extremely important as Brazil´s equity market has proven to be extremely sensitive to its currency (for now). Notice Brazil trades lower when BRL weakens ' quite the opposite with other markets, such as the Nikkei and the Yen.
If we see the 3.20´s get hit while the reaching resistance in the Bovespa it should indicate a great entry. (Though this is usually unlikely to occur at the same time.)
Downtrend Back Again on IBOVESPA After a nice rally (see related idea), downtrend back again on IBOVESPA
Signs:
-Hook and crossover on overbought region of StochasticRSI;
-MD down closed on RSI (white circles);
-Marubozu candle at top of rally, followed by bearish candle indicating exhausted rally;
-Price hit a conjunction of important trend lines, on a region of resistance;
Huge flag on ITUB4Simple idea. There is this big flag, and price is reaching the base of this sideways channel. Two entries are showed on the chart, in case of being stopped on entry 1. Im bullish on bovespa, so i think this is a great opportunity and ITUB4 is one my favourite stocks to watch and trade.
Thanks
Bovespa Symmetrical Downtrend Moves Back to a 1.618 Extension.The Bovespa has been forming a symmetrical downward trend followed by a 1.618 extension of the longer bull trend. You can see this in the chart by the first light blue fib retracement, and then I used a green arrow to indicate where the second retracement line is compared to the green 1.618 retracement line. The second to last move down is a bit tricky as it extended further than the previous downward moves (indicated by the dashed blue trend lines) and did not fully retrace back to its 1.618 extension of the larger trend. Instead it only retraced back to the .786 fib line and again made a downward move extremely similar to past downward moves (again indicated by the dashed blue lines.) It may be forming a double bottom, especially if it finishes out its symmetrical downward trend line, which is about where it’s at. If this is the case, expect a move again back to its 1.618 retracement. This mark is also important as it overlaps the much larger downward trend that started back in November of 2015. These retracement lines overlap almost perfectly and is indicates strong resistance.
Target Price: is 55975-56007 by early to mid-June. I would actually rate this quite conservative as the upward extensions seem to happen in a 5-ish day time cycle sometimes followed by a week of slowly moving bullish trends indicating indecision.
Make sure to give it time to play out its double bottom which Should be slightly higher than its first bottom of 49907.77 and be sure to use a smaller time frame chart for your entry. To play this index I may use a leveraged ETF like BRZU.
Please Like and share and follow for future symmetrical and perhaps non symmetrical analysis.
Thanks!
Conservative target for VALE5: 15,9 R$ (43,3%)Target for a Wave 4. BVSP in correction of a downtrend , a lot of opportunitys on it at this moment. Yesterday it went 5% up.
IBXL wave two of a kickoff wave one (Brazillian Index)Until Feb 2016, Bovespa still was on 2008 correction, believe me or not. But i do believe that correction has ended, and in the last days we had a kickoff for a longer uptrend. For now we will have a minor correction, for a wave two.
Again, sorry for those who don't care about bovespa.
FORA DILMA!
LEVE O PT E O PSDB JUNTO!
long for 2016 on BVSP (Bovespa)Well, a lot of stuff is going on here on Brazil, Political uncertainty and Economics fundamentals are terrible. The government, for sure, is being a problem more than a solution. But despite that i still believe in a good 2016 from here, based on this analysis and other analysis of major stocks that compose the index.
BVSP all the way downTogether with my last chart about the BVSP, this is more of a Swing-Trade leveraged position against this active (BOV11 in IBovespa and BVSP in NYSE), considering the following fundamental key points:
* The main stocks are being hammered, some of them: Petrobras, Vale, Sabesp.
* Brasil fiscal efforts to keep a good spending balance showed some ugly side effects on the economy.
* The Brasil's economy plans to grow by 0.3% this year, which basically means a recession.
Basically, in the near term there's no way you can be bullish in this scenario until all the changes on the fiscal politics stabilize the economy and produce long-term growth. It may not even begin this year.


