DOGE 1D: Missed PEPE? Don’t Miss DOGE 06/12/25BINANCE:DOGEUSDT
I’m expecting a continuation of the upward movement and a possible trend reversal.
There’s a chance we’ll revisit the 0.618 Fib level to shake out weak hands — a classic move before liftoff.
Looking at the chart, it really feels like altseason is closer than anyone expects. DOGE may lead the charge.
Entry Points (EP):
• Market
• $0.19357
• $0.18009
Take Profit (TP):
• $0.22787
• $0.25439
⚠️ My personal opinion only — not financial advice.
Do your own research and remember: all actions you take are your own responsibility. Practice solid risk management and avoid investing more than 2% of your total capital per trade.
DYOR.
Bybit

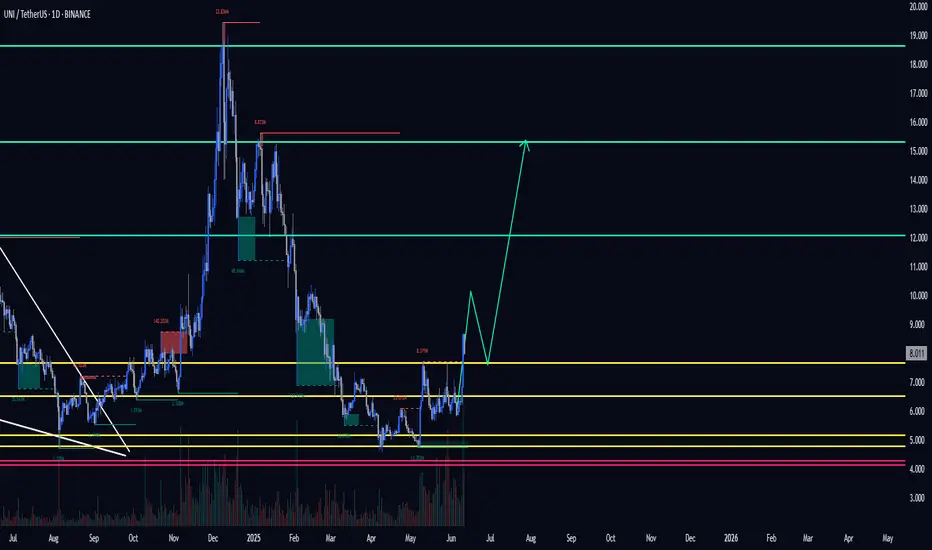
UNI 1D. Breakout Coming? Long-Term Setup Explained 06/11#UNI has been trading in a wide range between $4.072 – $18.634 for the past three years. This is known as an accumulation phase, where large players may be building positions ahead of the next major price move.
After a steep decline, the price bounced off the key support zone at $5.623 – $4.753. It then reclaimed and held above $6.325, a historically high-volume area — a bullish signal.
For short-term entries, I recommend waiting for confirmation above the 100-week moving average (MA100), which currently sits around $7.671. A break and close above that level would suggest a trend reversal.
🎯 Targets:
• $12.063
• $15.305
📥 Mid-term accumulation zone:
• $5.623 – $4.753
• If price drops to $4.072, it could be another solid buy opportunity.
DYOR.
PIXEL 1D. High-Risk, High-Reward Setup. Here's the Play. 06/11BINANCE:PIXELUSDT
Entry opportunity for the bold.
EP (Entry Point): 0.04215$ – 0.04020$
TP (Take Profit):
1️⃣ 0.14072$
2️⃣ 0.16076$
SL (Stop Loss): 0.02280$ or according to your personal risk management.
❗️No stop loss on spot — manage accordingly.
DYOR. Always know your risk.

#THETA 1D. Swing High Rejected – What's Next? 06/11/25We are currently in a consolidation range. After updating the swing high, price immediately faced seller pressure from the top of the structure.
Why did this happen?
Many participants were stuck in losses for a long time and decided to exit at breakeven as soon as price gave them the chance — totally understandable.
Key levels for the setup:
Yellow lines – potential entry points.
Red lines – stop-loss levels, depending on your risk appetite (marked two options).
Green lines – target areas.
Whether you go with spot or futures — the setup is there. Choose your strategy accordingly.
DYOR.

DEFI altcoin - The Trump Crypto ConnectionThe relationship between decentralized finance (DeFi), the Trump family, and Kevin O’Leary in 2025 centers around their public involvement in the crypto and blockchain space, particularly highlighted by their participation in events like DeFi World 2025 and specific DeFi projects tied to their names or influence.
The Trump family, notably Donald Trump Jr. and former President Donald Trump, has increasingly engaged with DeFi and cryptocurrency. Donald Trump Jr. spoke at the DeFi World 2025 Conference in Denver on February 26, alongside Kevin O’Leary, signaling a growing interest in blockchain’s potential to shape finance. Posts on X from DeFi confirm their appearances, with Trump Jr. scheduled at 3:00 PM and O’Leary at 3:45 PM, reflecting a shared platform to promote DeFi’s future. Beyond this event, the Trump family is linked to World Liberty Financial (WLFI), a DeFi project launched in September 2024. WLFI aims to democratize crypto lending and borrowing while reinforcing the U.S. dollar’s dominance, operating on Aave’s v3 protocol.
Kevin O’Leary, a Canadian investor and “Shark Tank” star, has been a vocal DeFi advocate since at least 2021, when he invested heavily in DeFi Ventures (later renamed WonderFi), targeting 4.5–8% yields on crypto assets. His participation in DeFi World 2025 alongside Trump Jr. underscores his ongoing commitment. O’Leary sees DeFi as a way to bypass financial middlemen, predicting it could transform trading within years. His practical involvement contrasts with the Trump family’s more symbolic and policy-driven engagement, though both share a bullish stance on crypto’s future.
Fully diluted Market Cap of only $2.64Mil.

Bitcoin Short to 97 K into cpi numbersIn this video I cover the recent drop and what might be a great short on the horizon . With the V shape recovery off the defended 100K level I anticipate that we continue the move up to 107/108K before hitting some resistance and pushing us back into the range leading into the midweek . With cpi news release this could be the catalyst needed to trap the late buyers and drop us into 96K zone .
This video provides context and theory for this short setup so I encourage you to watch .
Tools used Vwap , volume profile , Fibonacci pulls .
Thanks for watching
Any questions please leave in the comments
Safe trading

May 27 Bitcoin Bybit chart analysisHello
It's a Bitcoinguide.
If you have a "follower"
You can receive comment notifications on real-time travel routes and major sections.
If my analysis is helpful,
Please would like one booster button at the bottom.
This is the NASDAQ 30-minute chart.
There will be an indicator announcement at 11 o'clock.
The daily chart MACD dead cross is in progress.
*When the red finger moves,
it is a long position strategy.
I simply proceeded with the purple finger short -> red finger long switching
or the red finger long waiting strategy.
Today, if possible, it is advantageous for long positions because the weekly chart low point will not be broken even if you just move sideways without touching the gap section.
When the gap section is deviated, I marked the bottom -> section 2 at the bottom
and applied it to Bitcoin as it is.
This is a Bitcoin 30-minute chart.
At the bottom left is the gap retracement section that was performed on the 26th
The purple finger is the entry point for the long position at $108,233.5
It is connected as is.
*When the red finger moves,
It is a long position strategy.
1. After confirming the touch of the first section of the purple finger at the top
109,519.6 long position entry section / cut-off price when the green support line is broken
2. 111,883.3 long position 1st target -> Good 2nd target
Until the additional daily chart is created at 9 am tomorrow
Because the top section of the resistance line of the Bollinger Band daily chart can be a strong adjustment section
You should be careful.
If you touch after 9 o'clock, there is a possibility of additional increase, and
If the strategy is successful, you can use the 1st section indicated at the top as a long re-entry section after the first liquidation of the Top section.
Today, we will focus on long positions,
but it is important whether the main point touches the upper part of Nasdaq first and then
comes down immediately.
If it comes down immediately without touching the 1st section,
the final long waiting strategy is at 108,652.9 dollars in the 2nd section.
If the green support line breaks away, the stop loss price is the same.
Since the mid-term pattern is broken,
if you somehow manage to hold it within the 2nd section today, it is good for the long position.
If it breaks away, check the Bottom -> 3rd section at the bottom,
Since Bitcoin's new high is updated depending on the movement of Nasdaq this week,
it seems that a decline or continuous rise after the double top may be connected.
Up to this point, I ask that you simply use my analysis for reference and use only.
I hope that you operate safely with the principle of trading and cut-off price.
Thank you.

May 23 Bitcoin Bybit chart analysisHello
It's a Bitcoinguide.
If you have a "follower"
You can receive comment notifications on real-time travel routes and major sections.
If my analysis is helpful,
Please would like one booster button at the bottom.
Here is the Bitcoin 30-minute chart.
There will be a Nasdaq indicator announcement at 11 o'clock in a little while.
Yesterday was also a sideways market with no movement,
and the participation rate was low, so I will leave it as a brief analysis.
In the case of Nasdaq, today's daily chart MACD dead cross pressure
so I judged that a vertical rise would be difficult.
I made today's strategy based on the high possibility of a sideways move.
In the upper left corner, from the analysis article on the 22nd,
I moved the 1st section / 111,426.6 dollars as it is with a purple finger.
*Red finger movement path
One-way long position strategy
1. 109,917.6 dollars long position entry section / green support line breakout stop loss price
Since the 4-hour chart MACD dead cross pressure is in progress
Based on the 1+4 pattern,
At least 2 additional 4-hour candles are created
I think there will be a long position wait after 1:30 p.m.
2. Top section 113,701.9 dollars long position 1st target -> Good 2nd target
If it breaks through the orange resistance line at the top
It can be connected to a vertical rise,
So if you were short yesterday or are going to challenge today,
Use it as a stop loss price, but be careful.
If it goes up within the purple support line after 1->2 or after touching 2 times,
It can be a vertical rise or a strong rise.
At the bottom, Bottom -> 3 times -> 106982.3 dollars
I marked the support line.
In case of a strong rise over the weekend,
Good is the Great section hidden picture search.
Up to this point, I ask that you simply use my analysis for reference and use,
and I hope that you operate safely with principle trading and stop loss prices.
Thank you for your hard work this week.
Thank you.

May 22 Bitcoin Bybit chart analysisHello
It's a Bitcoinguide.
If you have a "follower"
You can receive comment notifications on real-time travel routes and major sections.
If my analysis is helpful,
Please would like one booster button at the bottom.
This is the Nasdaq 30-minute chart.
Where the mid-term pattern is restored
Blue finger short->long switching
Long waiting strategy up to section 1.
I marked the target price section at the top / the support line price at the bottom
I will try to apply it to Bitcoin as is.
Here is the Bitcoin 30-minute chart.
Nasdaq indicators will be announced at 9:30 and 11:00 shortly.
Nasdaq movement + short-term pattern is broken,
and the Tether Dominance short position operation method is applied to Bitcoin, which moves in the opposite direction.
* One-way long position strategy when the red finger moves
1. $109,917.6 long position entry section / When the green support line is broken,
or when section 2 is touched, stop loss price
2. $113,701.9 long position 1st target -> Good 2nd target price
Section 1 at the top is the last short position operation section of the day,
and when it breaks through, it can be connected to an upward trend,
so it seems advantageous for beginners to use it as a long waiting strategy in an upward wave.
If you touch the red finger long position entry section first among 1 or 109.9K,
You can go around and rise strongly.
If you succeed in rebounding without breaking the purple support line,
Vertical rise
Movement within the 1st section at the top and 2nd section at the bottom is sideways.
Because it is open from Bottom -> 3,
Be careful of Nasdaq fluctuations,
If you succeed today, you will have 4 consecutive perfects.
Please use my analysis articles for reference and use only
I hope you operate safely with principle trading and stop loss prices.
Thank you.

May 21 Bitcoin Bybit chart analysisHello
It's a Bitcoinguide.
If you have a "follower"
You can receive comment notifications on real-time travel routes and major sections.
If my analysis is helpful,
Please would like one booster button at the bottom.
This is the Nasdaq 30-minute chart.
There is no separate indicator announcement today.
After the red finger chase purchase,
I explained the main demand section drawing and price.
I applied it to Bitcoin as is.
This is a Bitcoin 30-minute chart.
At the bottom left, the purple finger
connects the strategy to the long position entry section that was entered on the 20th.
*When the red finger moves,
it is a one-way long position strategy.
1. $105,263.7 long position entry section / stop loss price when the sky blue support line is broken
2. $108,207.6 long position 1st target -> Top 2nd target -> Good 3rd target price
The 1st section at the top is the rising wave confirmation section,
and the strategy is more likely to succeed if the purple support line is broken after the touch.
(If it goes up right away, there is a possibility of a vertical rise)
Red finger long hold
If it goes down right away without touching, it is the final long hold strategy at 2.
From the 2nd section deviation, I marked Bottom -> 3
Since the mid-term pattern was broken yesterday,
you should succeed in rebounding within the green support line if possible.
Up to this point, I ask that you simply use my analysis for reference and use,
and I hope that you operate safely with principle trading and stop loss prices.
Thank you.

May 19 Bitcoin Bybit chart analysisHello
It's a Bitcoinguide.
If you have a "follower"
You can receive comment notifications on real-time travel routes and major sections.
If my analysis is helpful,
Please would like one booster button at the bottom.
This is the Nasdaq 30-minute chart.
There is no separate indicator announcement today.
The 12-hour chart MACD dead cross is in progress.
The blue finger is short->long or if it goes down right away,
the purple finger is a long waiting strategy.
Since the morning, the blind decline has been in progress,
and the short-term pattern is broken.
The bottom section is about 6+12 sections,
and it is today's major support line.
I applied it to Bitcoin as it is.
This is the Bitcoin 30-minute chart.
It is being adjusted strongly as it is coupled with Nasdaq.
Based on Tether dominance,
If the current low is broken,
It is a position where it can be pushed strongly.
* When the red finger moves,
It is a one-way long position strategy.
1. 102,192.1 USD long position entry section / stop loss price when the green support line is broken
2. 104,866.1 USD long position 1st target -> Top 2nd target
The 1st section of the purple finger at the top
Is the best short position entry section of the day.
If it does not touch, it will fall vertically,
So if it goes down right away without touching the 1st section
It can be pushed to the bottom -> 2.
The danger signal has passed, but the problem is when it couples with Nasdaq.
The 2nd section at the very bottom is the 12+ daily support section,
and will be today's major support line.
Last week, many people pressed the booster,
so I'm leaving it as a public post today as well.
Up to this point, I ask that you use my analysis for reference and use only,
and I hope that you operate safely with principle trading and loss cuts.
Thank you.

May 16 Bitcoin Bybit chart analysisHello
It's a Bitcoinguide.
If you have a "follower"
You can receive comment notifications on real-time travel routes and major sections.
If my analysis is helpful,
Please would like one booster button at the bottom.
This is the Nasdaq 30-minute chart.
There is no separate indicator announcement.
We proceeded with trend following.
After entering the 1st long position at the top,
If it does not break away from the purple support line, it goes up vertically.
*We proceeded along the red finger movement path in the next wave.
We expected the movement to be a strong rise.
From the bottom breakaway, it is open up to the 2nd section,
and we will omit the detailed explanation.
This is the Bitcoin 30-minute chart.
At the bottom left, with a purple finger,
I connected the long position entry section of 101,785.1 dollars that I had on the 15th.
The current position is the 30 + 1 section,
but since the 4 and 6-hour central lines were also touched at the same time,
the mid-term pattern is broken,
and the daily chart MACD dead cross is in progress.
The strategy is one-way, one-way,
I am explaining it only on one page of the 30-minute chart,
so it is limited, but I organized it as simply as possible.
*When the blue finger moves
Two-way neutral
Short->Long or long waiting strategy
1. 104,791.3 dollars short position entry section / stop loss price when orange resistance line is broken
2. 103,241.8 dollars long position switching / stop loss price when green support line is broken
After that, long position target price in the order of Good -> Great
-> Refer to pink finger simulation.
If it touches the top once or comes down right away from the current position,
it is the final long waiting strategy at the bottom section 2.
From the bottom section breakout,
it is open from 3 -> 99345.9 dollars.
Please use my analysis article so far only for reference and use
I hope you operate safely with principle trading and stop loss price.
Thank you for your hard work this week.

May 14 Bitcoin Bybit chart analysisHello
It's a Bitcoinguide.
If you have a "follower"
You can receive comment notifications on real-time travel routes and major sections.
If my analysis is helpful,
Please would like one booster button at the bottom.
This is the Nasdaq 30-minute chart.
There is no separate indicator announcement today.
I conducted a brief analysis with rough movements.
The 3-hour chart MACD dead cross pressure is in progress,
and from the purple finger at the top to number 1,
it is the best short position entry section of the day,
and from the orange resistance line breakthrough, it is an upward trend.
*The 21.1K red finger at the bottom is a long-term strategy,
and if there is a rebound within the purple support line without touching the entry point,
it will rise vertically.
The short-term pattern may be broken from the 2nd section,
and it is a downward sideways movement to the bottom -> the 3rd section is the 1+4 section.
I applied it to Bitcoin as is.
This is a 30-minute chart for Bitcoin.
Since there is no Nasdaq indicator announcement, we proceeded with trend following.
In the case of Bitcoin, the 12-hour chart MACD dead cross was engraved,
and the lower Bollinger band was touched first.
On the left, with the purple finger,
101.1K long -> 104.283.2 dollar short switching
I connected the strategy as it is.
*When the blue finger moves,
It is a two-way neutral
short->long switching strategy.
1. 104.326.6 dollar short position entry section / stop loss price when orange resistance line is broken
2. 103,278.1 dollar long position switching / stop loss price when green support line is broken
If the strategy is successful,
section 1 can be used as a long position re-entry section. (Purple parallel line maintenance condition)
I proceeded tightly up and down for fear of missing the entry point.
Instead, if I explain in detail,
The movement within 1 at the top and 2 at the bottom is a sideways section,
and it is a section where a trend can emerge when breaking out or breaking out.
For those who have been holding a short position since yesterday,
I think it would be good to operate with a stop loss price when breaking out of the orange resistance line, just like today's strategy.
If it comes down right away without touching the 104.3K short entry point,
the final long position is waiting in the 2nd section.
The stop loss price is the same.
If it breaks out of the bottom section today, it can be directly connected to the 3rd section at the bottom,
so those who are operating a long position should be careful.
Up to this point, I ask that you simply refer to and use my analysis,
and operate safely with principle trading and stop loss price. Please support the 4 consecutive perfect challenges
Thank you

May 9 Bitcoin Bybit chart analysisHello
It's a Bitcoinguide.
If you have a "follower"
You can receive comment notifications on real-time travel routes and major sections.
If my analysis is helpful,
Please would like one booster button at the bottom.
This is the Nasdaq 30-minute chart.
There is no separate indicator announcement today.
With the green support line maintenance condition, I created a strategy for a sideways market with a red finger long position strategy.
The main sections are indicated by price, so
Please refer to it.
This is a Bitcoin 30-minute chart.
At the bottom left, with a purple finger,
I just connected the 99,222.6 dollar long position strategy from the 8th analysis article.
*When the red finger moves,
One-way long position strategy
1. 102,536 dollar long position entry section / cut-off price when the green support line breaks
2. Top section 105,417.6 dollar long position 1st target -> Target price in order from Good to Miracle.
From Miracle, the report is updated,
and the possibility of the report being updated has greatly increased due to yesterday's movement.
The 1st purple finger section at the top
If it doesn't break through, it's a sideways market, but if it breaks through, it can be directly connected to an upward trend,
so it seems safer to operate it as a long position waiting rather than taking a short. (Horizontal range until convergence section 1, 2)
From the green support line deviation of section 2 at the bottom
Because of the full candle on the left, it can be pushed hard,
So you must follow the stop loss price.
This week, it is open from Bottom-> 3rd -> 97086.1,
So please use it well in real time.
Up to this point, I ask that you simply refer to and use my analysis
And I hope that you operate safely with principle trading and stop loss price.
Thank you for your hard work this week.
Thank you.

May 2 Bitcoin Bybit chart analysisHello
It's a Bitcoinguide.
If you have a "follower"
You can receive comment notifications on real-time travel routes and major sections.
If my analysis is helpful,
Please would like one booster button at the bottom.
Here is the Bitcoin 30-minute chart.
There will be an indicator announcement at 9:30 in a little while.
Unlike Nasdaq, Bitcoin touched the upper Bollinger Band first and is on the verge of an upward trend.
Since there is a possibility of missing the entry point at the current position,
I set the stop loss price short and proceeded aggressively.
*One-way long position strategy when the red finger moves
1. Pursuit purchase at $96,835.6 / When the purple support line is broken,
or when the bottom section is touched, stop loss price
2. Long position target price at $98,766.4 -> Good 2nd target -> Great 3rd target
If the Great section is broken at the top,
the probability of a new high price is high.
From the bottom touch, the mid-term pattern will be broken
(currently 6+12 in progress)
When looking at the candle shape, from the green support line bottom breakout
It can break out strongly, so please refer to the bottom 2, 3 times up to 93016.7 dollars, and if 93K breaks, a downward trend can be connected again, so
You should be careful.
I left the analysis article up to May 6th
and the main points and the drawing section on one page, so it's hard
Please just refer to and use my analysis article up to here
I will see you next week after the holiday.
Thank you.

April 30 Bitcoin Bybit chart analysisHello
It's a Bitcoinguide.
If you have a "follower"
You can receive comment notifications on real-time travel routes and major sections.
If my analysis is helpful,
Please would like one booster button at the bottom.
Here is the Bitcoin 30-minute chart.
There will be two Nasdaq indicator announcements at 9:30 and 11:00.
On the lower left, I marked the long position entry section that I entered on the 25th and 29th,
and created today's strategy based on the Nasdaq movement.
*Red finger movement path
Long position strategy
1. 94,698.2 dollar long position entry section / cut-off price when the green support line is broken
2. 95,784 dollar long position 1st target -> Good 2nd target
The 1st and 2nd sections at the top are sideways.
After the 1st touch, in the rising wave, if you enter a 94.6K long position,
the probability of the strategy succeeding increases.
If it comes down right away without touching the 1st section,
The final long position is waiting in the 2nd section, and the stop loss price is the same when the green support line is broken.
When the top section is touched, the long position re-entry utilization section and
I left a simulation with a pink finger on the upper right.
The bottom touch is a downward sideways movement
The 3rd section is the 6+12 support line where the mid-term pattern is restored.
Also, tomorrow is Labor Day,
So all countries around the world, including the US, are closed.
I also have work to do, so I will take a day off tomorrow.
I intentionally left the analysis article on the right until May 2nd.
Up to this point, please just refer to and use my analysis article,
And I hope you operate safely with the principle trading and stop loss price.
Thank you.

April 29 Bitcoin Bybit chart analysisHello
It's a Bitcoinguide.
If you have a "follower"
You can receive comment notifications on real-time travel routes and major sections.
If my analysis is helpful,
Please would like one booster button at the bottom.
This is the Nasdaq 30-minute chart.
There will be an indicator announcement at 11 o'clock in a little while.
After the 4-hour chart MACD dead cross was imprinted yesterday
Today, two things are clear
*Red finger strong rise or purple finger major rebound.
The main issue was whether the 6-hour chart MACD dead cross occurred
After writing the analysis, looking at the overall movement
The purple finger seems strong today.
Let's apply it to Bitcoin as it is.
This is a 30-minute Bitcoin chart.
At the bottom left, I connected the long position entry point of $93,046 that I entered in the analysis article on the 25th.
Bitcoin and Tether dominance are moving sideways.
Bitcoin is slightly more advantageous in terms of MACD signals or Ichimoku Kinko Hyo,
but it is not strange if one side skyrockets or plummets.
While moving sideways, I was watching Nasdaq,
and I paid attention to the Nasdaq movement.
*Red finger movement path
One-way long position strategy
1. 94242.4 dollar long position entry section / green support line breakaway stop loss price
2. 96005.1 dollar long position 1st target -> Top 2nd target -> Final Good
The 1st section at the top is the rising wave position
If you touch it first, the possibility of success of the strategy increases.
If the strategy is successful, it would be good to use it as the final long position re-entry.
Depending on the adjustment coming out of Nasdaq, it can be pushed up to section 2
Roughly, it is the support line of the Bollinger Band 6-hour chart.
If the rebound fails in Nasdaq
Bottom -> Please note that it can be pushed to section 3.
Up to this point, please use my analysis as a simple reference and use.
Thank you.

April 25 Bitcoin Bybit chart analysisHello
It's a Bitcoinguide.
If you have a "follower"
You can receive comment notifications on real-time travel routes and major sections.
If my analysis is helpful,
Please would like one booster button at the bottom.
This is the Nasdaq 30-minute chart.
There is no separate indicator announcement.
I bet on a red finger upward sideways movement or a strong rebound.
If the green support line is maintained,
the short-term pattern will be maintained and it is a safe zone, so it seems that there will be no big effect on Bitcoin.
The short-term pattern is broken from the bottom 2,
and the bottom section is the 1+4 section, so if it succeeds in rebounding without breaking away from the true blue support line,
it is good for a long position.
I just applied it to Bitcoin.
This is a Bitcoin 30-minute chart.
The purple finger section on the lower left is the section where the long position was entered in the analysis article on the 23rd.
*When the red finger moves,
it is a one-way long position strategy.
1. $93,046 long position entry section / stop loss price when the green support line is broken
2. $95,562.5 long position 1st target -> Top 2nd -> Good 3rd section,
and when the Good section is broken, the possibility of a new high is high.
The 1st section at the top is the rising wave confirmation section
The green support line 2nd section that I marked is the safe section.
The final match was held in the 1+4 section
If the strategy is successful, the 1st section on the right is the long position re-entry and utilization section
I left a simulation with the pink finger.
From the bottom breakout, until the additional weekly candle is created next Monday,
I have sequentially displayed the main prices and support lines,
so please refer to them,
and please use my analysis articles only for reference and use,
and I hope you operate safely with the principle trading and stop loss price.
Thank you for your hard work this week.
Thank you.

April 23 Bitcoin Bybit chart analysisHello
It's a Bitcoinguide.
If you have a "follower"
You can receive comment notifications on real-time travel routes and major sections.
If my analysis is helpful,
Please would like one booster button at the bottom.
Yesterday, after a long time, the participation rate on TradingView was good, so
I will continue with a series of full-public analysis articles.
At the top is the Nasdaq 30-minute chart.
There will be an indicator announcement at 11 o'clock in a little while.
Based on the gap section created at the top and bottom,
I predicted the movement of the blue finger movement path.
This is the Bitcoin 30-minute chart.
Recently, Bitcoin has been moving autonomously,
and Tether dominance is in a vertical decline.
I won't tell you the reason for the Nasdaq decoupling separately.
The core of today's strategy is trend following.
I have never talked about all possibilities up and down without a single entry point.
*One-way long position strategy when the red finger moves
1. 93,068.9 dollar long position entry section / cut-off price when the purple support line is broken
2. 96,784 dollar long position 1st target -> Good 2nd target
Please note that the possibility of a new high is very high when the Good section is broken.
From 1 to Gap 8 at the top,
if coupled with Nasdaq, it is an upward wave. (After touching the top, wait for a long entry at the bottom)
Since the success rate can be high, please consider it as a long wait without operating a separate short position
Up to section 2 is the maximum long position waiting section.
Bottom->3 is a downward sideways movement.
The reason why I set the stop loss price when the purple support line breaks today is
Because it is the place where the previous low of the daily candle created today is broken
If it is pushed hard, it can fall to the bottom 89,597 dollars (1+4) section.
Up to this point, please use my analysis article only for reference and
I hope you operate safely with principle trading and stop loss prices.
Thank you.

Symmetrical Triangle Breakout Attempt! 📈 OMXSTO:B3 - Symmetrical Triangle Breakout Attempt! 📐
✅ OMXSTO:B3 has broken out of a symmetrical triangle pattern.
🔴 Next hurdle: Needs to break and close above the red resistance zone for further upside.
🎯 Potential target: Green line level if the red resistance is broken! 🚀

April 22 Bitcoin Bybit chart analysisHello
It's a Bitcoinguide.
If you have a "follower"
You can receive comment notifications on real-time travel routes and major sections.
If my analysis is helpful,
Please would like one booster button at the bottom.
This is the Bitcoin 30-minute chart.
There is no Nasdaq indicator announcement.
Tether dominance is in a vertical decline.
First, I ignored Nasdaq and focused on Bitcoin based on my perspective on recent movements.
In the case of Bitcoin, I proceeded with a conservative strategy when the short-term pattern was broken.
*One-way long position strategy when the red finger moves
1. 88,211.9 dollars long position entry section / cut-off price when the green support line is broken
2. 90,418 dollars long position 1st target -> Top 2nd target
If the strategy is successful, the 1st section at the top
can be used as a long position re-entry section,
but from the Top section -> Good section, it is the center line of the weekly Bollinger Band chart,
so there is a possibility of a strong adjustment this week.
Section 1 at the top and section 2 at the bottom are extreme horizontal support sections.
If section 2 is broken, it is a section where the short-term pattern is broken,
and since the bottom touch at the bottom is the lowest point of the daily chart,
it is not good,
and since the support line is open, it can be directly connected to section 3.
Up to this point, I ask that you simply refer to and use my analysis,
and I hope that you operate safely with principle trading and loss cut prices.
Thank you.

April 17 Bitcoin Bybit chart analysisHello
It's a Bitcoinguide.
If you have a "follower"
You can receive comment notifications on real-time travel routes and major sections.
If my analysis is helpful,
Please would like one booster button at the bottom.
This is the Bitcoin 30-minute chart.
Nasdaq indicators will be announced at 9:30 in a little while.
The purple finger section on the left
is connected to the short->long switching section that was performed on the 16th.
* When the blue finger moves,
Bidirectional neutral
Short->long switching strategy or long waiting if it goes down right away.
1. 85,728.6 dollars short position switching / cut-off price when orange resistance line is broken
2. 84,595.8 dollars long position switching / cut-off price when green support line is broken
3. 86,871.5 dollars long position 1st target -> Good 2nd target
Today's 12-hour chart MACD dead cross is an ignoring strategy. Check if the purple support line deviates from the current position,
and from the 1st section of the green support line deviates,
even those who have been holding long positions since yesterday can operate at the same stop loss price.
If the short position entry section at the top comes down without touching,
the 2nd section at the bottom is the final long waiting section (6+12 pattern),
and if the rebound is not good in this section and it is pushed,
it may continue to fall to the 3rd section at the bottom due to the pressure of the 12-hour chart MACD dead cross.
Up to this point, please use my analysis article only for reference and use,
and I hope you operate safely with the principle trading and stop loss price.
Thank you.

April 14 Bitcoin Bybit chart analysisHello
It's a Bitcoinguide.
If you have a "follower"
You can receive comment notifications on real-time travel routes and major sections.
If my analysis is helpful,
Please would like one booster button at the bottom.
Here is the Bitcoin 30-minute chart.
There is no Nasdaq indicator announcement today.
I created a strategy based on the possibility of a strong decline in Tether dominance centered on the Gap section at the bottom of Nasdaq and Bitcoin.
*One-way long position strategy when the red finger moves
1. 83,690.8 dollars long position entry section / cut-off price when the green support line is broken
2. 85,772.3 dollars long position 1st target -> Top 2nd -> Good 3rd target.
If the strategy is successful, I have indicated the long position re-entry section.
Today, it is best to maintain the purple support line
because it maintains the mid-term pattern and the daily candle bottom section.
The mid-term pattern can be broken from the 1st section,
and it can be a sideways market until the 2nd section,
and it can decline step by step from the bottom -> 3rd section.
Up to this point, I ask that you simply use my analysis for reference and use only.
I hope that you operate safely with the principle of trading and cut-off price.
Thank you.
