December 7 Bitcoin Bybit chart analysis
Hello.
“Make it simple, make profit”
It’s BitcoinGuide.
Don’t forget to
“Follow” me and press “Likes”.
If you "follow" press,
Only 30 Min chart ,
In real time, you can check major sections and move,
Real-time "update I dea" can be checked.
I will begin BTCUSD Bybit Bitcoin Chart Analysis for December 7.
Bitcoin 4 hour chart.
There is no significant change from the drawing area left in the morning,
Focused on the Nasdaq movement.
Today's approximate Top Price and Bottom Price are displayed.
centered around the purple support line
Red upward / sky blue downward movement path check
I created today's trading strategy.
Bitcoin 30 minute chart, arrow one way long position strategy.
Nasdaq today has no important indicators announced,
Depending on the conditions, it becomes a major rebound section.
In the case of bits, when coupled with Nasdaq,
Touch the support line already in the rising pattern (6 +12 )
If you do not touch only the green support line, it becomes a condition that can rise strongly.
The 12-hour chart MACD dead cross is pushing
If the Nasdaq does not drop down to the right until dawn
Because it is a condition for a strong rebound,
12-hour chart MACD dead cross ignored, stop loss and aggressive operation.
*At the red arrow path
long position strategy
1. Entry into long position at $16803 / stop loss when breaking the green support line
The final target is according to the Nasdaq movement
The top price is $17303.5 in case of a strong rebound.
Even if there is a sideways or further correction today
As long as the green support line is not touched, the uptrend pattern is not broken.
Good moves can continue after tomorrow.
In the case of NASDAQ, if the bottom section of the previous low is broken again
Maybe the whole world is ruined.
now i have to upload it
In the United States, we will not necessarily let the Nasdaq fall.
Even if there is a sideways movement this week, don't be discouraged
Check the CPI on the 13th and the interest rate announcement on the 14th
It's good to look long.
Instead, if you upload it in advance, a better movement will come out as of December, right?
Please, I ask that you simply refer to and use my analysis.
Set your own standards
I hope you operate safely with principle trading / stop loss essential
thank you.
Bybit

December6 Bitcoin Bybit chart analysis
Hello.
“Make it simple, make profit”
It’s BitcoinGuide.
Don’t forget to
“Follow” me and press “Likes”.
If you "follow" press,
Only 30 Min chart ,
In real time, you can check major sections and move,
Real-time "update I dea" can be checked.
I will begin BTCUSD Bybit Bitcoin Chart Analysis for December 6.
Bitcoin 4 hour chart.
Today's approximate top price and bottom price are displayed.
around the red support line
Red upward / sky blue downward movement path check
I created today's trading strategy.
30-minute chart light blue finger movement path, one-way long position strategy.
Overall, it's a long-awaited strategy.
Nasdaq no important indicator announcement,
Up to now, because of the strong adjustment section and thick yang luck in the main section
If you do well, you will be able to rise strongly like last time.
#In the case of a beat, yesterday without a big adjustment, I was walking right and down
Because there was no touch in the danger zone (the last touch zone is the support line of the 1-hour chart)
#If the purple support line is maintained without breaking, it is best for a long position / maximum top price target
Note to those who are maintaining existing long positions.
#If there is a vertical decline and a strong correction on the NASDAQ
As it couples, Bitcoin could fall all the way to the bottom.
(Check if the pink resistance line is broken)
I proceeded with an upward rebound strategy in the 6 + 12 uptrend recovery pattern.
*In light blue finger movement path
long position strategy
1. Entry into long position at $16784.5 / Stop loss when breaking the red support line
The final target is 17350.5 blocks
The main contents have been described above.
My analysis is for reference only.
I hope you operate safely with principle trading / stop loss essential
thank you.

December5 Bitcoin Bybit chart analysis
Hello.
“Make it simple, make profit”
It’s BitcoinGuide.
Don’t forget to
“Follow” me and press “Likes”.
If you "follow" press,
Only 30 Min chart ,
In real time, you can check major sections and move,
Real-time "update I dea" can be checked.
I will begin BTCUSD Bybit Bitcoin Chart Analysis for December 5.
Bitcoin 4 hour chart.
Today's approximate top price and bottom price are displayed
centered around the purple support line
Red upward / sky blue downward movement path check
The gap section at the bottom is 17016 dollars.
I created today's trading strategy.
The 30-minute chart is a light blue finger one-way neutral strategy.
The Bitcoin situation is very favorable for long positions,
Under various conditions, the Nasdaq is likely to move sideways.
Just like Brazil today
I think it will be an uphill battle for Bitcoin as well.
I bet on the Gap retracement section at the bottom and the indicator announcement at 12:00.
I think there will be some controversy
I checked the area pushing up to the light blue support line.
Please note
*In light blue finger movement path
Short -> Long Switching Strategy
1. Short position at $17282.5 / stop loss when orange resistance line is broken
2. $17019.5 long position switching / stop loss when breaking the light blue support line
$17518 long position target
If you succeed in your strategy today, get good vibes
With a 2% win rate expected by gamblers
I hope that Korea can beat Brazil.
My analysis is for reference only.
Please operate safely as principle trading / stop loss is essential.
Korea soccer fighting! Quarterfinals Kazuah~
Thanks for reading.

December2 Bitcoin Bybit chart analysis
Hello.
“Make it simple, make profit”
It’s BitcoinGuide.
Don’t forget to
“Follow” me and press “Likes”.
If you "follow" press,
Only 30 Min chart ,
In real time, you can check major sections and move,
Real-time "update I dea" can be checked.
I will begin BTCUSD Bybit Bitcoin Chart Analysis for December 2.
Bitcoin 4 hour chart.
Today's approximate top price and bottom price are displayed.
around the green support line.
Red upward / sky blue downward movement path check
I created today's trading strategy.
This is a one-way long position strategy on the 30-minute chart.
I proceeded as it was in accordance with the Nasdaq movement.
The Nasdaq trend looks good,
Tether dominance collapse condition / 30 minutes -> 1 hour chart A section that can be connected to the upward trend if only a thin sound is broken
Currently, it's a slight, downtrend.
Up to the green support line, it is a safe support line.
as it was left
* $16942.5 long position entry section / stop loss when breaking the green support line
Final target is $17566.5 / Weekend target is $18069.5
Please pay attention to the most important Nasdaq movement.
Maybe it's because of various things, but today seems to be a particularly difficult day to be active.
Good luck cheering for soccer
Have a good weekend
thank you.

December1 Bitcoin Bybit chart analysis
Hello.
“Make it simple, make profit”
It’s BitcoinGuide.
It's been a while.
Due to an unfortunate incident, I was suspended for 3 days.
Don’t forget to
“Follow” me and press “Likes”.
If you "follow" press,
Only 30 Min chart ,
In real time, you can check major sections and move,
Real-time "update I dea" can be checked.
I will begin BTCUSD Bybit Bitcoin Chart Analysis for December1.
Bitcoin 4 hour chart.
Today's approximate Top Price and Bottom Price are displayed.
centered around the purple support line
Red upward / sky blue downward movement path check
I created today's trading strategy.
This is a 30-minute chart one-way / sky blue finger long position strategy.
Bitcoin's pattern is faster than Nasdaq.
Because the 2-hour chart MACD dead cross is in progress
Vertical rise is difficult, in case of coupling with Nasdaq
I bet on a moderately upward slope.
When holding at the purple support line, the top price is the target
sky blue support extreme crosswalk
The bottom section of the deep wave support line is downward to the right.
*In light blue finger movement path
One-way long position strategy
1. Entry into long position at $16862.5 / Stop loss when breaking the light blue support line
$17724.5 long position target / can finish near the light blue and green resistance lines if the strength is insufficient.
Those who are still in the long-term trend
I think it would be good to operate with major altcoins in the spot exchange.
Even those entering
Nasdaq movement is the most important
Please operate safely while maintaining stop loss at the main support line.
There is one indicator announcement at 10:30 / 12:00,
It doesn't seem that important, so I ended up with a moderate amount of sidebar.
I hope you operate safely with principle trading / stop loss essential.
thank you.

November21 Bitcoin Bybit chart analysis
Hello.
“Make it simple, make profit”
It’s BitcoinGuide.
Don’t forget to
“Follow” me and press “Likes”.
If you "follow" press,
Only 30 Min chart ,
In real time, you can check major sections and move,
Real-time "update I dea" can be checked.
I will begin BTCUSD Bybit Bitcoin Chart Analysis for November 21.
Bitcoin 4 hour chart.
In the case of the Nasdaq, there are no important indicators announced today.
There is a high possibility of crossover.
Green parallel line based on rightward sideways
In the case of a beat, it is also a condition for rising without adjustment.
Please note.
Today's approximate Top price and Bottom price are displayed,
around the green support line.
Red upward / sky blue downward movement path check
I created today's trading strategy.
This is a one-way long position strategy on the 30-minute chart.
In fact, if it breaks through the purple support line today,
not very good
The light blue support line is the area that overlaps the previous low.
The bottom is wide open.
It should be supported at least within the green support line and made about upward.
Bollinger Band 4 -> 6 -> 12
Gap retracement may occur
To do that, we need Nasdaq's help, but
In Bitcoin, don't ask, the rebound should come out.
(Since it is 2 touches of the support line on the 12-hour chart, it is a strong position for a rebound.)
*At the red arrow path
long position strategy
1. Entry into long position at $16066.5 / stop loss when breaking the green support line
2. $16,406 short position operation section / stop loss when the orange resistance line is broken
3. $16191.5 long position switching / stop loss when breaking the green support line
Today's goal is the Gap retracement section at the top.
I'm bored with the constant sidewalk
When the upper red/dark blue resistance line is broken through
Please note that it can be linked to a strong uptrend.
My analysis is simply for reference purposes only.
US Dollar, Tether Dominance, Better Than Bitcoin
Nasdaq movement is the most important, so while paying attention to Nasdaq movement in real time
I hope you operate safely with principle trading / stop loss essential.
thank you.

November18 Bitcoin Bybit chart analysis
Hello.
“Make it simple, make profit”
It’s BitcoinGuide.
Don’t forget to
“Follow” me and press “Likes”.
If you "follow" press,
Only 30 Min chart ,
In real time, you can check major sections and move,
Real-time "update I dea" can be checked.
I will begin BTCUSD Bybit Bitcoin Chart Analysis for November 18.
Bitcoin 4 hour chart.
Today's approximate top price and bottom price are displayed.
around the green support line.
Red upward / sky blue downward movement path check
I created today's trading strategy.
Bitcoin 30-minute chart, one-way long position strategy.
For time reasons, the Nasdaq analysis is omitted.
Contrary to tether dominance, it seems that it will take time to work thinly on phonemes.
I'm sorry for yesterday's sideways movement until today's possibility of soaring.
Instead, we marked the Good -> Great section at the top until the weekend.
Above all, the Nasdaq movement is important,
Please check in real time.
*At the red arrow path
Long -> Short -> Long Switching Strategy
1. Entry into long position at $16,734 / stop loss when breaking the green support line
2. $17433.5 entry into short position / stop loss when strong blue resistance line is broken
3. Long position switching at $16,938 / stop loss when breaking the green support line
When the green support line breaks
Bottom section at the bottom is the only support line,
Following the Nasdaq move
Pay attention to the shape of the main Bollinger Band support line in real time, as it can be damaged while walking sideways.
My analysis is for reference only.
Please operate safely as principle trading / stop loss is essential.
thank you.

November16 Bitcoin Bybit chart analysis
Hello.
“Make it simple, make profit”
It’s BitcoinGuide.
Don’t forget to
“Follow” me and press “Likes”.
If you "follow" press,
Only 30 Min chart ,
In real time, you can check major sections and move,
Real-time "update I dea" can be checked.
I will begin BTCUSD Bybit Bitcoin Chart Analysis for November 16.
Bitcoin 4 hour chart.
Today's approximate top price and bottom price are displayed.
around the green support line.
Red upward / sky blue downward movement path check
I substituted the Nasdaq movement.
The 30-minute chart is a one-way neutral strategy.
In the case of Nasdaq, overall movement is not bad.
The 6-hour chart MACD dead cross is in progress, but
After the rising touch, it doesn't seem to be very important because it is advantageous in terms of pattern.
Instead, I calculated it as a pattern in Tether Dominance.
It seemed difficult for bitcoin to rise in a short period of time.
About this week, as Bitcoin makes higher lows,
If you keep your seat well, it is a condition that can rise significantly.
The most important one is the NASDAQ.
Nasdaq -> Bits + Tether Dominance
remember the relationship
In accordance with the Nasdaq movement, Bitcoin also bet on the upward trend.
*In arrow movement path
Long -> Short -> Long Switching Strategy
1. Entry into long position at $16649.5 / stop loss when breaking the green support line
2. Entry into short position at $17076.5 / stop loss when orange resistance line is broken
3. 16691 bull long position switching / stop loss when breaking the light blue support line
If rebound fails, in Tether Dominance
Because it reaches the rebound section, a correction can come out strongly once.
Please note
If you hold on to this section well, the conditions for a strong rise are created.
In the case of a green support line, please note that a movement that continues to raise the low can be connected.
Keep an eye on the Nasdaq movement.
Let's hold on well this week.
I have a health checkup tomorrow, so I don't think I'll be able to do my daily activities inevitably.
Please excuse me
My analysis is for reference only.
I hope you operate safely with principle trading / stop loss essential
thank you.

November15 Bitcoin Bybit chart analysisHello.
“Make it simple, make profit”
It’s BitcoinGuide.
Don’t forget to
“Follow” me and press “Likes”.
If you "follow" press,
Only 30 Min chart ,
In real time, you can check major sections and move,
Real-time "update I dea" can be checked.
I will begin BTCUSD Bybit Bitcoin Chart Analysis for November 15.
Bitcoin 4 hour chart.
I left today's approximate Top and Bottom prices.
around the green support line.
Red upward / sky blue downward movement path check
I made a trading strategy by substituting it with Nasdaq.
This is a one-way long position strategy on the Bitcoin 30-minute chart.
To be precise, it is a long -> short -> long switching strategy.
The US exchange rate has fallen dramatically.
The Nasdaq atmosphere looks very good today.
Because beats have a thick phoneme, it seems like it will take time in reality.
Substitute the Nasdaq movement as it is
I saw the game on the green support line.
*At the red arrow path
1. 16764.5 dollar long position entry section / Stop loss when breaking the green support line / If it does not break the pink support line shown, it is open up to the top section.
(It can be pushed up to the purple support line with an upward wave, and start with a chase long strategy in case you miss the entry point)
2. 17722 dollars short position switching / stop loss when the red resistance line is broken
3. $16907.5 long position switching / stop loss when breaking the green support line
After that, it is a strategy for finishing to the right along the green parallel line.
A few more support lines could be drawn below the green support line.
It went on tight.
The Bottom section at the bottom is the last support line.
If the current position breaks through the pink resistance line, the support line can continue to rise.
My analysis is for reference only, please.
I hope you operate safely with principle trading / stop loss essential.
thank you.

November14 Bitcoin Bybit chart analysis
Hello.
“Make it simple, make profit”
It’s BitcoinGuide.
Don’t forget to
“Follow” me and press “Likes”.
If you "follow" press,
Only 30 Min chart ,
In real time, you can check major sections and move,
Real-time "update I dea" can be checked.
I will begin BTCUSD Bybit Bitcoin Chart Analysis for November 14.
Bitcoin 4 hour chart.
Today's approximate Top and Bottom prices are displayed.
around the green support line
Check the red up/light blue down movement path
In the case of Nasdaq, ahead of the upper gap
3-hour chart MACD deadcross in progress,
The pattern is fine, but on the signal
You have reached the midpoint of an upward trend or correction.
based on the above
I made today's trading strategy.
This is a 30-minute chart one-way long position strategy.
Today, I bet everything on the green support line.
Because it is a rebound in the 6-hour support line touching section with the lowest point in front of us
Except for variables such as the Nasdaq crash, we decided that it would not be an easy place to die.
It's a place with some power.
A bullish case could end at the red resistance line.
*One-way long position strategy when moving the red arrow
1. $16705.5 Chasing Long / Stop Loss when breaking the green support line
(The pink and purple support lines drawn on the basis of the parallel line must be maintained without breaking.
You can go up to the top at the top. )
2. $17396.5 short position switching / Stop loss when the red resistance line is broken
From this point on, it seems advantageous to focus on long positions rather than short positions.
3. 16824 long position switching / Stop loss when the green support line is broken
The final target is $18778.
When adjustments are made directly from the current position
I think it would be good to wait for a long position in the sky blue finger section at the bottom.
I left a variable
The bottom section / sky blue support line at the bottom can be directly connected to the previous low.
It's very dangerous.
Since the rebound was successful, it is not indicated separately, but
Please note that until this week, up to 13.6K is open.
My analysis is for reference only.
Principle trading / Stop loss is essential, I hope that you operate safely.
thank you.

November11 Bitcoin Bybit chart analysis
Hello.
“Make it simple, make profit”
It’s BitcoinGuide.
Don’t forget to
“Follow” me and press “Likes”.
If you "follow" press,
Only 30 Min chart ,
In real time, you can check major sections and move,
Real-time "update I dea" can be checked.
I will begin BTCUSD Bybit Bitcoin Chart Analysis for November 11.
Bitcoin 4 hour chart.
Today's approximate top price, bottom price
around the green support line
Check the red up/light blue down movement path
In the case of Nasdaq
Today's main chart MACD Golden Cross is in progress.
We are about to touch the center line of the main Bollinger Bands chart.
The pattern is alive, and the signal is a strong upside condition.
Based on the above, we have created today's trading strategy.
Bitcoin 30 minute chart.
It is a one-way long position strategy.
In the case of Bitcoin, the 6-hour MACD Golden Cross is in progress.
In the case of the Nasdaq, the upper side seemed to be advantageous, so we applied it as is.
* When the red arrow moves
Short -> Long Switching Strategy
Currently, it has a bearish advantage as it has touched the 30-minute support.
Even if it rises, it seems difficult to raise it at once
I had a wave once in a while.
* I think it would be better to focus on the long position of $17275.
Pay attention to the green parallel line in the case of right-facing,
If the green support line breaks today, there seems to be no clear support line.
When the previous low / main chart support line is broken
Please note that it may continue to be delayed as it was yesterday.
I had a personal problem today, so I couldn't focus on the analysis.
While observing the main section,
The analysis is for reference only.
Principle trading / Stop loss is essential, I hope that you operate safely.
You've worked hard this week too. have a nice weekend everyone
thank you.

[2022-11-06] [BYBIT:BTCUSD] [LONG]Hello fellow traders,
Practice good risk management!
Anything can happen.
In order to make money, it is not necessary to know what will happen in the next moment in time.
For any given set of variables that define competitive advantage, there is a random distribution of failures and successes.
Competitive advantage is nothing more than an expression of a higher probability of the course of events developing in a certain way.
Every moment of the market is unique in its own way.
You alone are responsible for your trading – both gains and losses.
Good luck and happy trading!

November10 Bitcoin Bybit chart analysis
Hello.
“Make it simple, make profit”
It’s BitcoinGuide.
Don’t forget to
“Follow” me and press “Likes”.
If you "follow" press,
Only 30 Min chart ,
In real time, you can check major sections and move,
Real-time "update I dea" can be checked.
I will begin BTCUSD Bybit Bitcoin Chart Analysis for November 10.
Bitcoin 4 hour chart.
Today's approximate Top and Bottom prices are displayed.
around the green support line
Check the red up/light blue down movement path
In the case of the Nasdaq, it has touched the 3-hour support level.
In case of bad news from CPI
It's important to keep moving upwards.
If it fails to rebound and goes sideways
It is necessary to make an upward wave without departing from the main section.
If the rebound fails, Bitcoin is more likely to go down to the bottom.
Please note.
I made today's trading strategy.
This is a 30-minute chart one-way long position strategy.
If you look closely,
Long -> short -> long switching strategy.
You've created a strategy that's reckless, even nonsensical.
Currently, all sections are open except for the green support line.
Because it is on the downtrend by touching the Bollinger Bands support line on the main chart.
This is the lowest point of the week if kept, and a spot where further declines can occur if broken.
I bet on the green support line
The trend also went up and down, much stronger.
I decided that the support line could be stopped at the green support line only after a rebound like this.
When the green support line is broken, pay attention to the bottom section.
In case of damage or departure late in the morning
Please note that there may be a continuous drop from tomorrow onwards.
Nasdaq downtrend
Bitcoin is open below the next support line in the order of around $10000 -> $7594.
Beginners who want to operate long positions on the margin of the spot exchange
We strongly recommend that you open your mouth at the bottom or operate it after tomorrow.
* When the red arrow moves
Long -> Short -> Long Switching Strategy
1. $16248.5 long position entry section / Stop loss when leaving the green support line
2. 19472.5 USD short position switching / Stop loss when the red resistance line is broken
(Check if the orange resistance line is broken. If the breakout fails, the green support line or the previous low may be broken.)
3. $16493.5 long position switching / Stop loss when the green support line is broken
Even if it is damaged, it would be good to see the shape of the Bollinger Bands and try to win the final rebound.
Today's strategy is to shake up and down rather than for good news.
I want you to think of it as a wave.
Since the results in CPI were good, I thought about it for a long time today and came up with a strategy.
Nasdaq movement is the most important,
Keep an eye out for Nasdaq.
My analysis is for reference only.
Principle trading / Stop loss is essential, I hope that you operate safely.
Stay alive and see you tomorrow morning.
Thanks for reading.

November 9 Bitcoin Bybit chart analysis
Hello.
“Make it simple, make profit”
It’s BitcoinGuide.
Don’t forget to
“Follow” me and press “Likes”.
If you "follow" press,
Only 30 Min chart ,
In real time, you can check major sections and move,
Real-time "update I dea" can be checked.
I will begin BTCUSD Bybit Bitcoin Chart Analysis for November 9.
Bitcoin 4 hour chart.
Today's approximate top price, bottom price
Yesterday, I killed both short -> long
While touching the bottom first,
There is movement in the direction of a downtrend.
It is a rebound section after the daily peak main peak support line was touched.
This is a place where you can get a V-shaped rebound.
It's a lot less powerful than expected.
around the purple support line
(In the middle, the wave and support line are
This is the last uptrend line that was forced.)
In the current situation, it is not easy to fall to the bottom at once.
You can play around the maximum double bottom / near the green support line.
Please be careful.
Check the red up/light blue down movement path
I made today's trading strategy.
Bitcoin 30-minute chart one-way long position strategy.
In the case of the Nasdaq, there are no significant indicators released today.
Even if it goes down, it looks like a right-to-down sideways trend.
Daily chart MACD Golden Cross is in progress
Whether or not the 12-hour chart Golden Cross will be connected is an important situation.
Before the CPI announcement tomorrow, I think there will be a moderate sideways trend.
Conversely, in the case of Bitcoin,
After the downward touch, a downtrend is in progress.
They even touched the 2-3 hour support level.
Yesterday's daily weekly chart support line was judged to be valid until this week.
Today, I put weight on the double floor.
The beat always goes before a big trend change.
Just like yesterday, after killing both short and long and breaking the lowest point once
Good moves have been repeated.
I've been making the most realistic strategy rather than uselessly upside-down strategy.
I hit the 3-hour support/downtrend line.
Today, the best condition is to maintain the purple support line.
In addition, we have prepared a stop-loss strategy when breaking out of the support line.
* When the red arrow moves
Long -> Short -> Long Switching Strategy
* From current location or detour
You can touch 16817.5 dollars, so we will focus on this section. (As the 1-hour chart MACD dead cross is in progress, a rebound is possible after at least 8pm)
Touch the $18595 orange resistance wire at the top
After rubbing it, a rebound from the purple support line may come out depending on the Nasdaq movement.
After that, I wish you good operation in real time.
My analysis is for reference only.
Principle trading / Stop loss required
It's a comment I leave every day, but did you feel the pain yesterday?
Even the same information is a source of profit for some and resentment for others.
I want you to think for a moment about what is and whose fault is it.
Don't forget to buy in principle today / Stop Loss is essential
I wish you good luck
thank you.

WHEN IT TOUCHES THE 1/1 IT'S OVERWhen bitcoin touches the 1/1 line on the gann fann, the bear market will be officially over.
Good luck folks, this thing is going to rip upward and people are going to ... well who cares right, we all make our own decisions, sometimes at least.
Let's get it!!!!!
Woot

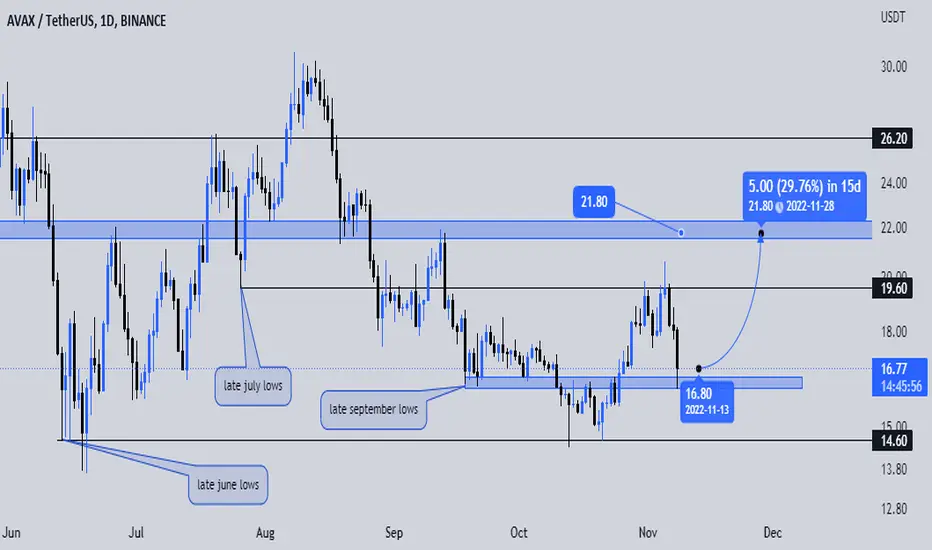
AVAX maybe now rejecting from september lowsWELCOME BACK MY CRYPTO FRIENDS, WE ARE HERE FOR AVAX TODAY
REMINDER : DO YOUR OWN RESEARCH, I only share my thoughts and views regarding the forecast
Here we are at Nov.8 and we can on AVAX/USDT now reject from late september lows, whats your opinion ??
Best Regards, Crypto Frantisek
November 8 Bitcoin Bybit chart analysis
Hello.
“Make it simple, make profit”
It’s BitcoinGuide.
Don’t forget to
“Follow” me and press “Likes”.
If you "follow" press,
Only 30 Min chart ,
In real time, you can check major sections and move,
Real-time "update I dea" can be checked.
I will begin BTCUSD Bybit Bitcoin Chart Analysis for November 8.
This is the Nasdaq 30-minute chart.
I think the Nasdaq move will be important today,
Share your analysis.
Nasdaq 30-minute chart analysis.
30 + 1 pattern in progress so far
The pattern is not broken and there is a rebound.
Proceed to 1 hour MACD deadcross / strong ascent condition
In particular, there is no announcement of a risk signal resistance line indicator.
*Bollinger Band 12-hour center / Long position target to the touch of the daily center line
If you continue to push with force,
Because the phonology is thin on the 12-hour chart Ichimoku Equilibrium
You can climb to the top section.
Depending on the situation, the 12-hour chart -> Daily chart MACD Golden Cross
Please note that it may be connected.
*If the rebound fails, the red resistance line becomes the target price.
When adjustments and declines occur at the current position
* Light blue finger section at the bottom / light blue support line when breaking
It may be related to the end of the season.
The red resistance line/purple support line could lead to a polar sideways movement.
Please note
It has been substituted for Bitcoin.
Bitcoin 30 minute chart.
It is a one-way long position strategy.
Downtrend and sideways were ignored.
Today's topic is Miracle Miracle.
I bet on the 1% condition that a miracle can happen.
Arrow movement path one-way long position strategy
Ignoring the chart due to Nasdaq coupling and variables, see the part where additional lows may be broken (Bottom light blue finger section)
Because the daily chart MACD dead cross is pressing all day
A rebound can be tricky.
Any strategy that breaks below the purple support level today is considered a failure.
* When the red arrow moves
long position strategy
1. 19766.5-dollar chase / Stop loss when the purple support line is broken
Depending on the situation, near the orange resistance line (1st target) -> Green resistance line (2nd target)
The ultimate goal is to reach the Gap retracement price depending on the Nasdaq conditions or the size of the rebound.
Even if it breaks out of the bright sky blue support line
It's good if you go up strong.
12 + Daily pattern in progress, one candle in Bollinger Bands ignoring resistance / support / center line
Because it is almost impossible to break it all at once,
Based on the Bitcoin chart, the current bottom cannot be broken.
Because Nasdaq is a variable
Keep it open up to the bottom, and if you reach the bottom early
It is a V-shaped rebound condition, but
After a clumsy rebound following the Nasdaq movement from the current position
If you break the support and lows slowly at dawn
It may continue to fall after tomorrow, so be careful.
With today's decline, the gap between the Nasdaq and the Nasdaq of last week
I followed the same path as the Nasdaq. (Bit and Nasdaq are both below the center line of the daily Bollinger Bands chart)
Currently, the Nasdaq movement is that important, so please focus on it.
My analysis is for reference only.
We hope that you operate safely as a principle of trading / stop loss is essential.
thank you.

$BNB/USDT 2D (#Bybit) Falling broadening wedge on resistanceBinance Coin (a.k.a. BNB Chain) got rejected on daily 200MA and does not seem to be able to break-out quite yet.
Let's hedge our holding with a short position without leverage, entering on the possible bearish retest!
Current Price:
303.00
Entry Zone:
309.95 - 339.85
Take-Profit Targets:
1) 248.80
2) 209.10
3) 172.45
Stop Targets:
1) 386.00
Published By: @Zblaba
Risk/Reward= 1:1.25 | 1:1.9 | 1:2.5
Expected Profit= +16.26% | +35.64% | +46.92%
Possible Loss= -18.81%
Tags: #BNB #BNBUSDT #Binance #BnbChain #BuildNBuild #BinaryFinance #Payment #SC #CEx #CeFi #DEx #DeFi #BSC
Websites: www.binance.com www.bnbchain.world
Contract:
#Mainnet

November 7 Bitcoin Bybit chart analysis
Hello.
“Make it simple, make profit”
It’s BitcoinGuide.
Don’t forget to
“Follow” me and press “Likes”.
If you "follow" press,
Only 30 Min chart ,
In real time, you can check major sections and move,
Real-time "update I dea" can be checked.
I will begin BTCUSD Bybit Bitcoin Chart Analysis for November 7.
Bitcoin 4 hour chart.
Today's approximate Top and Bottom prices are displayed.
around the green support line.
Check the red up/light blue down movement path
In the case of the beat, because the turnover rate was fast when I raised it strongly last week.
Bitcoin 4 + 6 + 12 MACD Deadcross Is In Progress
Nasdaq 6 MACD Golden Cross is in progress.
Also, today, the Nasdaq has not released any indicators, and the pattern is alive.
It becomes a strong rising condition.
Based on the above, I made today's trading strategy.
Bitcoin 30 minute chart.
It is a one-way long position strategy.
It is a short -> long switching strategy.
At the bottom, we focused on $20554 long position switching.
Currently, the 12-hour chart MACD dead cross continues to press.
By touching the 12-hour center line, the pattern is broken.
Based on a rebound on the Nasdaq,
After imprinting the danger signal, I made a strategy to return the upper gap.
Following the Nasdaq movement from the current position
In case of a rebound, the purple support line / green support line in the return correction.
You have to wait long
In case of vertical drop, it can be pushed up to the bottom
Please note.
* When the light blue finger moves
Short -> Long Switching Strategy
1. $20734 short position entry section / Stop loss when the second pink resistance line at the top is broken
2. 20554 long position switching / Stop loss when the green support line is broken
$21123 in the gap section is a long position target.
Breaking the first and second resistance levels failed,
If there is a correction on the Nasdaq at the same time
Since the pattern is broken in a big trend, it can flow downwards to the bottom right.
Those who operate spot exchanges, pay attention to whether the green support line is broken.
Long and short in each position
My analysis is simply for reference and usage, please.
We hope that you operate safely as a principle of trading / stop loss is essential.
thank you.

November 4 Bitcoin Bybit chart analysis
Hello.
“Make it simple, make profit”
It’s BitcoinGuide.
Don’t forget to
“Follow” me and press “Likes”.
If you "follow" press,
Only 30 Min chart ,
In real time, you can check major sections and move,
Real-time "update I dea" can be checked.
I will begin BTCUSD Bybit Bitcoin Chart Analysis for November 4.
Bitcoin 4 hour chart.
Today's approximate top price and bottom price
around the purple support line
Red up/light blue down movement path check
In the case of the Nasdaq, there are no significant indicators released.
There are no dangerous signals, the pattern is alive and the conditions are strong.
I have created a trading strategy for the day.
Bitcoin 30 minute chart.
It is a one-way long position strategy.
In line with the purple parallel line, it is a long-position strategy.
Yesterday the Nasdaq managed to get out of its worst crisis.
End of season -> A rebound is in progress.
As explained above, we created a strategy on the condition that the Nasdaq rebound will be maintained.
* When the red arrow moves
long position strategy
1. $ 20561 chase long / Stop loss when breaking the green support line
If the purple parallel line is maintained at the current position,
Top price is the target
If the correction comes to the green support line, the target is the pink resistance line of 20844.5 bullion.
Since the entry price and the stop loss price are not far
The hand loss proceeds with the green support line with plenty of room.
Keep an eye on the Nasdaq movement.
My analysis is simply for reference and usage, please.
We hope that you operate safely as a principle of trading / stop loss is essential.
You worked hard this week and have a great weekend
thank you.

November 3 Bitcoin Bybit chart analysis
Hello.
“Make it simple, make profit”
It’s BitcoinGuide.
Don’t forget to
“Follow” me and press “Likes”.
If you "follow" press,
Only 30 Min chart ,
In real time, you can check major sections and move,
Real-time "update I dea" can be checked.
I will begin BTCUSD Bybit Bitcoin Chart Analysis for November 3.
Bitcoin 4 hour chart.
Today's approximate Top and Bottom prices are displayed.
around the purple support line
Red up/light blue down movement path check
In the case of Nasdaq, the daily chart MACD dead cross
This is a dangerous section because you keep pressing and the lower part is open.
Based on the above, we have created today's trading strategy.
This is a 30-minute chart arrow one-way long position strategy.
I will boldly take yesterday's strategy as it is.
Arrow moving path, long position
When it goes down, it is a sky blue finger, short -> long switching strategy.
I proceeded according to the arrow movement path.
Please refer to the blue finger section.
If it does not break through to the bright sky blue support line at the upper end by today,
It's the best for a long position.
* When the red arrow moves
Short -> Long Switching Strategy
1. 20419.5 USD short position entry section / Stop loss when the orange resistance line is broken
2. 20257.5 USD long position switching / Stop loss when the light blue support line is broken
The target price is 20584.5 dollars.
Those who trade on the spot exchange or short-term
Operate mainly in long positions,
There is not much fluctuation up and down, so those who take the long-term trend
It's fine as long as it doesn't deviate from the bottom to the bottom section.
Instead, today could be the biggest crisis for the Nasdaq.
In case of a vertical or strong decline
It can be linked to the end of the season immediately, so be careful.
I calculated and displayed the fluctuations between the Nasdaq indicator releases.
My skills aren't that great, so it's hard to keep up with the Nasdaq movement.
It is also difficult to apply the movement to Bitcoin as it is.
Please refer to the analysis article only for reference and use.
We hope that you operate safely as a principle of trading / stop loss is essential.
thank you.

arkaDIKOUSD_ghostTrade_TradeGod - Long 800% 4hOKCOIN:DIKOUSD
ARKADIKO/USD ripe for a parabolic return to the previous delta volume divergence level @ 0.2504.
hidden volume divergence between the highs formed 29th - 30th on a 4h resolution.
Huge volume changes are evident over last 24hrs and believe the following is now expanding before us:
Entry: 0.0185 ✅
TP: 0.2504 - ETA =< Sunday 6th Nov 2022
Its a volume thing 😁 Enjoy at your own risk 🤔 as always...

November 2 Bitcoin Bybit chart analysis
Hello.
“Make it simple, make profit”
It’s BitcoinGuide.
Don’t forget to
“Follow” me and press “Likes”.
If you "follow" press,
Only 30 Min chart ,
In real time, you can check major sections and move,
Real-time "update I dea" can be checked.
I will begin BTCUSD Bybit Bitcoin Chart Analysis for November 2.
Bitcoin 4 hour chart.
Today's approximate Top and Bottom prices are displayed.
around the purple support line
Check the red up/light blue down movement path
The main issues are the real-time Nasdaq 12-hour chart MACD deadcross in progress.
30 minutes resistance touch VS 15 minutes support line touch
ascending dominance is in progress,
9:15 a.m. -> 3 a.m. Based on the US interest rate announcement
I made today's trading strategy.
This is a 30-minute chart one-way neutral strategy.
To be precise, it is a long -> short -> long switching strategy.
Because the branch point is very large,
Watching Nasdaq Movement, Focusing on Purple Support Line
Please check the up/down movement.
I chose the red arrow movement path.
In case of failure, please refer to the light blue finger operation.
Currently, Bitcoin
It has a downtrend to a touch of the 2 hour support line and a touch of the resistance level of 30 minutes.
According to the Ichimoku Equilibrium, the daily chart positive fortune is being kept thin, so it is a condition for a strong decline.
There are no other dangerous signals.
* When the red arrow moves
Long -> short -> long -> short -> long switching strategy.
1. $20449.5 long position entry section / Stop loss when departing from the purple support line
2. $20581.5 short position entry section / Stop loss when breaking the orange resistance line
(Please pay attention to the long wait of the purple support line or the movement of the light blue finger when the 20581.5 dollar touch fails.)
3. $20431 long position switching / Stop loss when the purple support line breaks
4. 20680 short position switching section / Stop loss when breaking through the bright resistance line
5. 20396.5 USD long position switching / Stop loss when the green support line is broken
Because the range from the switching spot and the green support line at the bottom is not large.
I think it would be good to see the long position maintenance section and stop loss as a deviation from the green support line.
I think there are a lot of people who are maintaining long positions in the past.
I pursued and harassed my followers in loyalty.
If the strategy at the top is off or the power is insufficient
Notice the light blue finger short -> long switching movement.
Be careful as there may be strong gains depending on the Nasdaq.
There is a possibility that there is a possibility of extreme sideways guarantee, so please pay attention to the indicator announcement.
My analysis is for reference only.
Principle trading / Stop loss is essential, I hope that you operate safely.
thank you.
